EUR/JPY Channel Formation (6.08.2025) The EUR/JPY Pair on the M30 timeframe presents a Potential Selling Opportunity due to a recent Formation of a Channel Pattern. This suggests a shift in momentum towards the downside in the coming hours.
Possible Short Trade:
Entry: Consider Entering A Short Position around Trendline Of The Pattern.
Target Levels:
1st Support – 169.74
2nd Support – 169.25
🎁 Please hit the like button and
🎁 Leave a comment to support for My Post !
Your likes and comments are incredibly motivating and will encourage me to share more analysis with you.
Best Regards, KABHI_TA_TRADING
Thank you.
Disclosure: I am part of Trade Nation's Influencer program and receive a monthly fee for using their TradingView charts in my analysis.
J-jpy

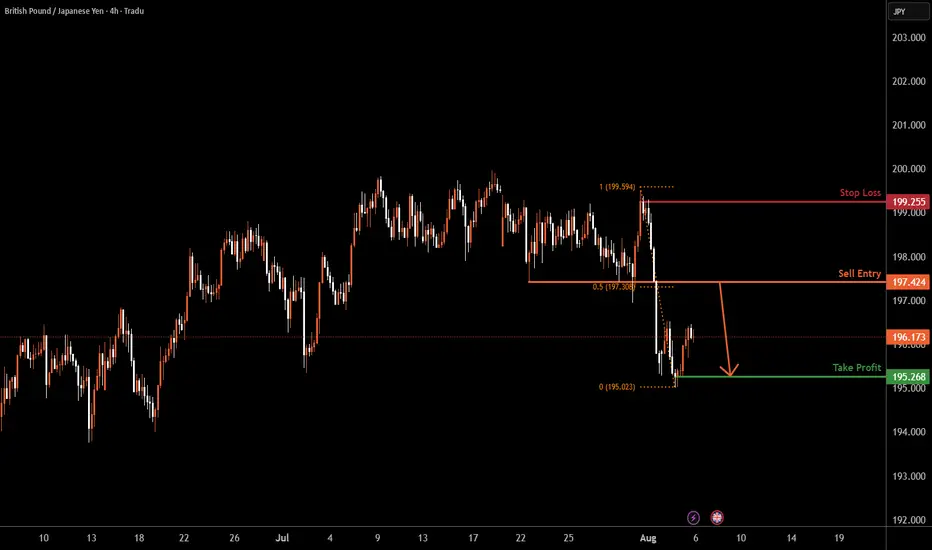
GBPJPY H4 | Heading into 50% Fibonacci resistanceGBP/JPY is rising towards the sell entry at 197.42, which has been identified as a pullback resistance that aligns with the 50% Fibonacci retracement and could reverse to the downside.
Stop loss is at 199.25, which is a swing high resistance.
Take profit is at 195.26, which is a swing low support.
High Risk Investment Warning
Trading Forex/CFDs on margin carries a high level of risk and may not be suitable for all investors. Leverage can work against you.
Stratos Markets Limited (tradu.com ):
CFDs are complex instruments and come with a high risk of losing money rapidly due to leverage. 65% of retail investor accounts lose money when trading CFDs with this provider. You should consider whether you understand how CFDs work and whether you can afford to take the high risk of losing your money.
Stratos Europe Ltd (tradu.com ):
CFDs are complex instruments and come with a high risk of losing money rapidly due to leverage. 66% of retail investor accounts lose money when trading CFDs with this provider. You should consider whether you understand how CFDs work and whether you can afford to take the high risk of losing your money.
Stratos Global LLC (tradu.com ):
Losses can exceed deposits.
Please be advised that the information presented on TradingView is provided to Tradu (‘Company’, ‘we’) by a third-party provider (‘TFA Global Pte Ltd’). Please be reminded that you are solely responsible for the trading decisions on your account. There is a very high degree of risk involved in trading. Any information and/or content is intended entirely for research, educational and informational purposes only and does not constitute investment or consultation advice or investment strategy. The information is not tailored to the investment needs of any specific person and therefore does not involve a consideration of any of the investment objectives, financial situation or needs of any viewer that may receive it. Kindly also note that past performance is not a reliable indicator of future results. Actual results may differ materially from those anticipated in forward-looking or past performance statements. We assume no liability as to the accuracy or completeness of any of the information and/or content provided herein and the Company cannot be held responsible for any omission, mistake nor for any loss or damage including without limitation to any loss of profit which may arise from reliance on any information supplied by TFA Global Pte Ltd.
The speaker(s) is neither an employee, agent nor representative of Tradu and is therefore acting independently. The opinions given are their own, constitute general market commentary, and do not constitute the opinion or advice of Tradu or any form of personal or investment advice. Tradu neither endorses nor guarantees offerings of third-party speakers, nor is Tradu responsible for the content, veracity or opinions of third-party speakers, presenters or participants.
USDJPY Breakout and Potential RetraceHey Traders, in today's trading session we are monitoring USDJPY for a selling opportunity around 148.300 zone, USDJPY was trading in an uptrend and successfully managed to break it out. Currently is in a correction phase in which it is approaching the retrace area at 148.300 support and resistance area.
Trade safe, Joe.

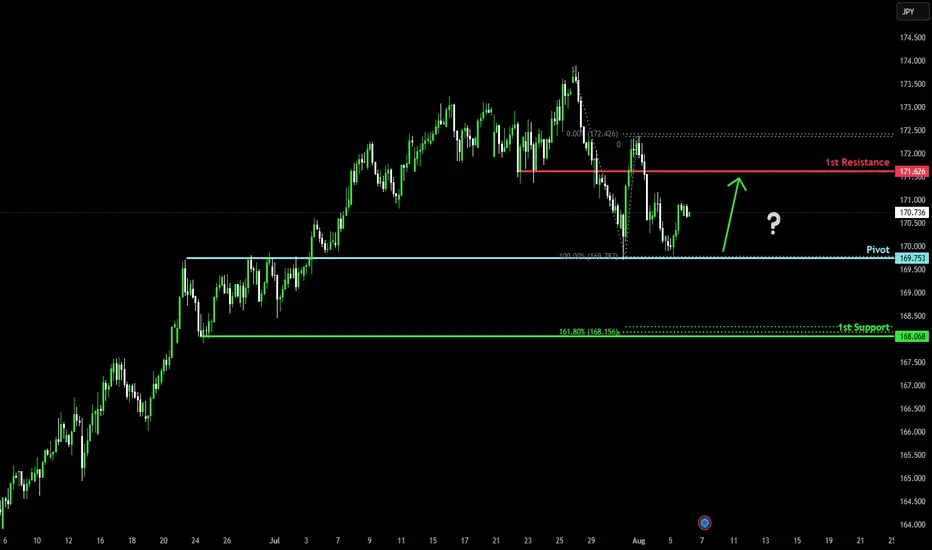
Bullish bounce off?EUR/JPY has bounced off the pivot which has been identified as an overlap support and could rise to the 1st resistance.
Pivot: 169.75
1st Support: 168.06
1st Resistance: 171.62
Risk Warning:
Trading Forex and CFDs carries a high level of risk to your capital and you should only trade with money you can afford to lose. Trading Forex and CFDs may not be suitable for all investors, so please ensure that you fully understand the risks involved and seek independent advice if necessary.
Disclaimer:
The above opinions given constitute general market commentary, and do not constitute the opinion or advice of IC Markets or any form of personal or investment advice.
Any opinions, news, research, analyses, prices, other information, or links to third-party sites contained on this website are provided on an "as-is" basis, are intended only to be informative, is not an advice nor a recommendation, nor research, or a record of our trading prices, or an offer of, or solicitation for a transaction in any financial instrument and thus should not be treated as such. The information provided does not involve any specific investment objectives, financial situation and needs of any specific person who may receive it. Please be aware, that past performance is not a reliable indicator of future performance and/or results. Past Performance or Forward-looking scenarios based upon the reasonable beliefs of the third-party provider are not a guarantee of future performance. Actual results may differ materially from those anticipated in forward-looking or past performance statements. IC Markets makes no representation or warranty and assumes no liability as to the accuracy or completeness of the information provided, nor any loss arising from any investment based on a recommendation, forecast or any information supplied by any third-party.
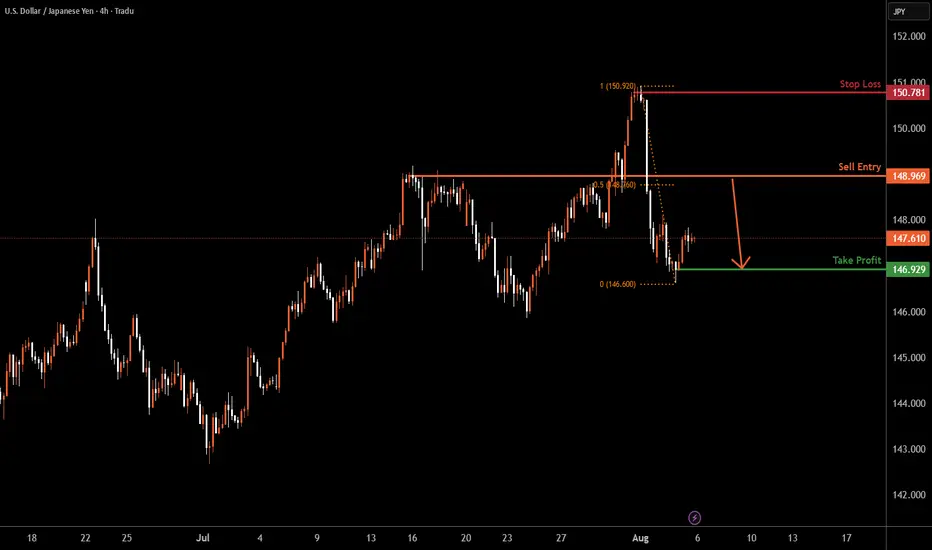
USDJPY H4 | Bearish reversal off pullback resistanceUSD/JPY is rising towards the sell entry which is a pullback resistance that is slightly above the 50% Fibonacci retracement and could drop from this level to the take profit.
Sell entry is at 148.96, which is a pullback resistance that is slightly above the 50% Fibonacci retracement.
Stop loss is at 150.78, which is a swing high resistance.
Take profit is at 146.92, which is a swing low support.
High Risk Investment Warning
Trading Forex/CFDs on margin carries a high level of risk and may not be suitable for all investors. Leverage can work against you.
Stratos Markets Limited (tradu.com ):
CFDs are complex instruments and come with a high risk of losing money rapidly due to leverage. 65% of retail investor accounts lose money when trading CFDs with this provider. You should consider whether you understand how CFDs work and whether you can afford to take the high risk of losing your money.
Stratos Europe Ltd (tradu.com ):
CFDs are complex instruments and come with a high risk of losing money rapidly due to leverage. 66% of retail investor accounts lose money when trading CFDs with this provider. You should consider whether you understand how CFDs work and whether you can afford to take the high risk of losing your money.
Stratos Global LLC (tradu.com ):
Losses can exceed deposits.
Please be advised that the information presented on TradingView is provided to Tradu (‘Company’, ‘we’) by a third-party provider (‘TFA Global Pte Ltd’). Please be reminded that you are solely responsible for the trading decisions on your account. There is a very high degree of risk involved in trading. Any information and/or content is intended entirely for research, educational and informational purposes only and does not constitute investment or consultation advice or investment strategy. The information is not tailored to the investment needs of any specific person and therefore does not involve a consideration of any of the investment objectives, financial situation or needs of any viewer that may receive it. Kindly also note that past performance is not a reliable indicator of future results. Actual results may differ materially from those anticipated in forward-looking or past performance statements. We assume no liability as to the accuracy or completeness of any of the information and/or content provided herein and the Company cannot be held responsible for any omission, mistake nor for any loss or damage including without limitation to any loss of profit which may arise from reliance on any information supplied by TFA Global Pte Ltd.
The speaker(s) is neither an employee, agent nor representative of Tradu and is therefore acting independently. The opinions given are their own, constitute general market commentary, and do not constitute the opinion or advice of Tradu or any form of personal or investment advice. Tradu neither endorses nor guarantees offerings of third-party speakers, nor is Tradu responsible for the content, veracity or opinions of third-party speakers, presenters or participants.
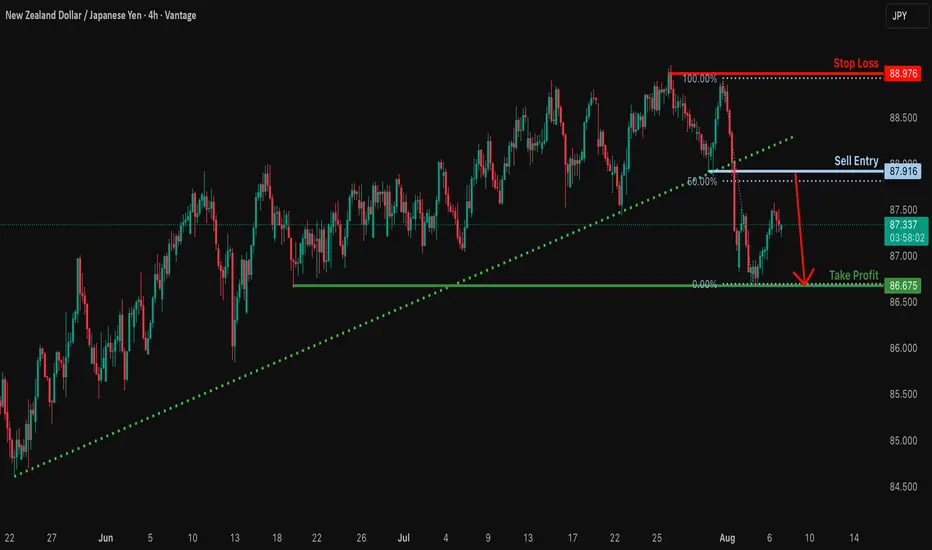
Bearish reversal?NZD/JPY is rising towards the resistance level which is a pullback resistance that aligns with the 50% Fibonacci retracement and could drop from this level to our take profit.
Entry: 87.91
Why we like it:
There is a pullback resistance that lines up with the 50% Fibonacci retracement.
Stop loss: 88.97
Why we like it:
There is a multi swing high resistance.
Take profit: 86.67
Why we like it:
There is amulti swing low support.
Enjoying your TradingView experience? Review us!
Please be advised that the information presented on TradingView is provided to Vantage (‘Vantage Global Limited’, ‘we’) by a third-party provider (‘Everest Fortune Group’). Please be reminded that you are solely responsible for the trading decisions on your account. There is a very high degree of risk involved in trading. Any information and/or content is intended entirely for research, educational and informational purposes only and does not constitute investment or consultation advice or investment strategy. The information is not tailored to the investment needs of any specific person and therefore does not involve a consideration of any of the investment objectives, financial situation or needs of any viewer that may receive it. Kindly also note that past performance is not a reliable indicator of future results. Actual results may differ materially from those anticipated in forward-looking or past performance statements. We assume no liability as to the accuracy or completeness of any of the information and/or content provided herein and the Company cannot be held responsible for any omission, mistake nor for any loss or damage including without limitation to any loss of profit which may arise from reliance on any information supplied by Everest Fortune Group.
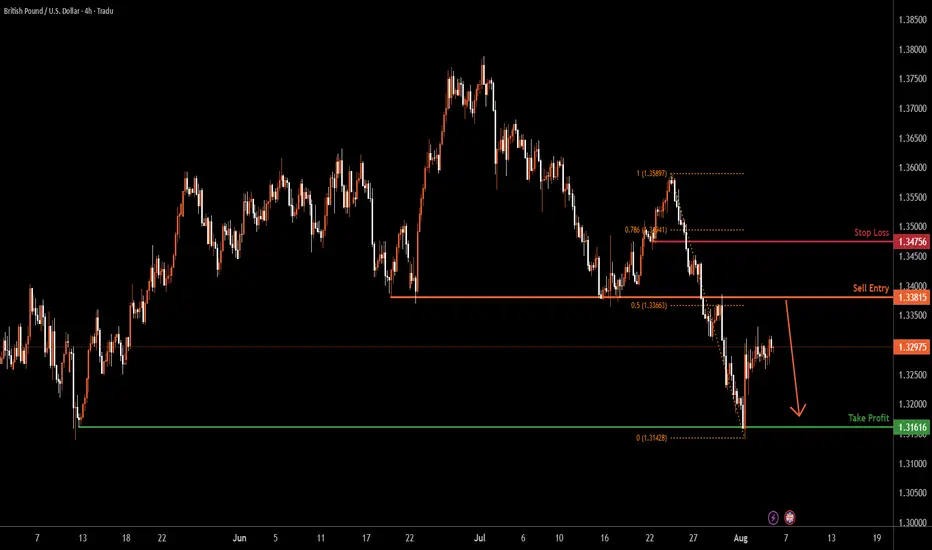
GBPUSD H4 | Bearish reversal off pullback resistanceThe Cable (GBP/USD) is rising towards the sell entry at 1.3381, which acts as a pullback resistance and could drop to the downside.
Stop loss is at 1.3475, which is a pullback resistance that is slightly below the 78.6% Fibonacci retracement.
Take profit is at 1.3161, which is a multi-swing low support.
High Risk Investment Warning
Trading Forex/CFDs on margin carries a high level of risk and may not be suitable for all investors. Leverage can work against you.
Stratos Markets Limited (tradu.com ):
CFDs are complex instruments and come with a high risk of losing money rapidly due to leverage. 65% of retail investor accounts lose money when trading CFDs with this provider. You should consider whether you understand how CFDs work and whether you can afford to take the high risk of losing your money.
Stratos Europe Ltd (tradu.com ):
CFDs are complex instruments and come with a high risk of losing money rapidly due to leverage. 66% of retail investor accounts lose money when trading CFDs with this provider. You should consider whether you understand how CFDs work and whether you can afford to take the high risk of losing your money.
Stratos Global LLC (tradu.com ):
Losses can exceed deposits.
Please be advised that the information presented on TradingView is provided to Tradu (‘Company’, ‘we’) by a third-party provider (‘TFA Global Pte Ltd’). Please be reminded that you are solely responsible for the trading decisions on your account. There is a very high degree of risk involved in trading. Any information and/or content is intended entirely for research, educational and informational purposes only and does not constitute investment or consultation advice or investment strategy. The information is not tailored to the investment needs of any specific person and therefore does not involve a consideration of any of the investment objectives, financial situation or needs of any viewer that may receive it. Kindly also note that past performance is not a reliable indicator of future results. Actual results may differ materially from those anticipated in forward-looking or past performance statements. We assume no liability as to the accuracy or completeness of any of the information and/or content provided herein and the Company cannot be held responsible for any omission, mistake nor for any loss or damage including without limitation to any loss of profit which may arise from reliance on any information supplied by TFA Global Pte Ltd.
The speaker(s) is neither an employee, agent nor representative of Tradu and is therefore acting independently. The opinions given are their own, constitute general market commentary, and do not constitute the opinion or advice of Tradu or any form of personal or investment advice. Tradu neither endorses nor guarantees offerings of third-party speakers, nor is Tradu responsible for the content, veracity or opinions of third-party speakers, presenters or participants.
Bearish reversal off 61.8% Fibonacci resistance?AUD/JPY is rising towards the pivot which acts as a pullback resistance and could reverse to the 1st support, which aligns with the 61.8% Fibonacci retracement.
Pivot: 96.11
1st Support: 94.30
1st Resistance: 97.25
Risk Warning:
Trading Forex and CFDs carries a high level of risk to your capital and you should only trade with money you can afford to lose. Trading Forex and CFDs may not be suitable for all investors, so please ensure that you fully understand the risks involved and seek independent advice if necessary.
Disclaimer:
The above opinions given constitute general market commentary, and do not constitute the opinion or advice of IC Markets or any form of personal or investment advice.
Any opinions, news, research, analyses, prices, other information, or links to third-party sites contained on this website are provided on an "as-is" basis, are intended only to be informative, is not an advice nor a recommendation, nor research, or a record of our trading prices, or an offer of, or solicitation for a transaction in any financial instrument and thus should not be treated as such. The information provided does not involve any specific investment objectives, financial situation and needs of any specific person who may receive it. Please be aware, that past performance is not a reliable indicator of future performance and/or results. Past Performance or Forward-looking scenarios based upon the reasonable beliefs of the third-party provider are not a guarantee of future performance. Actual results may differ materially from those anticipated in forward-looking or past performance statements. IC Markets makes no representation or warranty and assumes no liability as to the accuracy or completeness of the information provided, nor any loss arising from any investment based on a recommendation, forecast or any information supplied by any third-party.

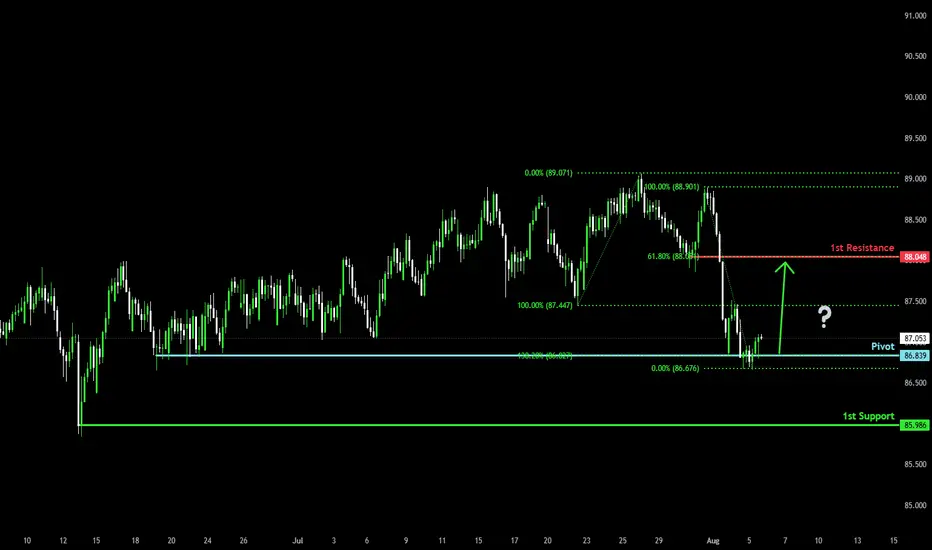
Bullish reversal?NZD/JPY is reacting off the pivot and could bounce to the 1st resistance which acts as a pullback resistance.
Pivot: 86.83
1st Support: 85.98
1st Resistance: 88.04
Risk Warning:
Trading Forex and CFDs carries a high level of risk to your capital and you should only trade with money you can afford to lose. Trading Forex and CFDs may not be suitable for all investors, so please ensure that you fully understand the risks involved and seek independent advice if necessary.
Disclaimer:
The above opinions given constitute general market commentary, and do not constitute the opinion or advice of IC Markets or any form of personal or investment advice.
Any opinions, news, research, analyses, prices, other information, or links to third-party sites contained on this website are provided on an "as-is" basis, are intended only to be informative, is not an advice nor a recommendation, nor research, or a record of our trading prices, or an offer of, or solicitation for a transaction in any financial instrument and thus should not be treated as such. The information provided does not involve any specific investment objectives, financial situation and needs of any specific person who may receive it. Please be aware, that past performance is not a reliable indicator of future performance and/or results. Past Performance or Forward-looking scenarios based upon the reasonable beliefs of the third-party provider are not a guarantee of future performance. Actual results may differ materially from those anticipated in forward-looking or past performance statements. IC Markets makes no representation or warranty and assumes no liability as to the accuracy or completeness of the information provided, nor any loss arising from any investment based on a recommendation, forecast or any information supplied by any third-party.
USDJPY – DAILY FORECAST Q3 | W32 | D5 | Y25📊 USDJPY – DAILY FORECAST
Q3 | W32 | D5 | Y25
Daily Forecast 🔍📅
Here’s a short diagnosis of the current chart setup 🧠📈
Higher time frame order blocks have been identified — these are our patient points of interest 🎯🧭.
It’s crucial to wait for a confirmed break of structure 🧱✅ before forming a directional bias.
This keeps us disciplined and aligned with what price action is truly telling us.
📈 Risk Management Protocols
🔑 Core principles:
Max 1% risk per trade
Only execute at pre-identified levels
Use alerts, not emotion
Stick to your RR plan — minimum 1:2
🧠 You’re not paid for how many trades you take, you’re paid for how well you manage risk.
🧠 Weekly FRGNT Insight
"Trade what the market gives, not what your ego wants."
Stay mechanical. Stay focused. Let the probabilities work.
FX:USDJPY

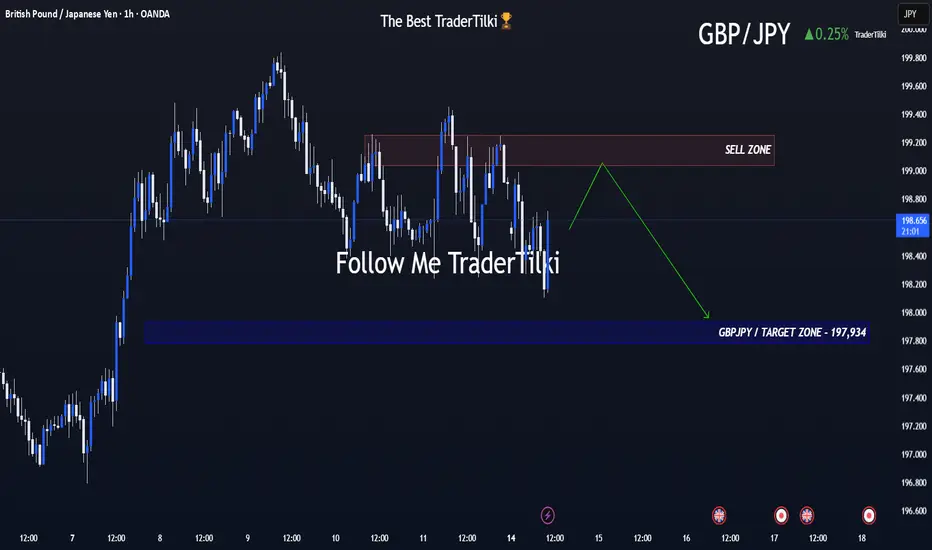
Volatile Times for GBPJPY: What’s Going On Behind the Moves?Good morning, Guys,
I’m anticipating a new short opportunity on GBPJPY once the pair reaches my sell zone level. From there, my target is set at 197.934.
Every like from you is what truly motivates me to keep sharing these insights.
Massive thanks to everyone who shows love and support!
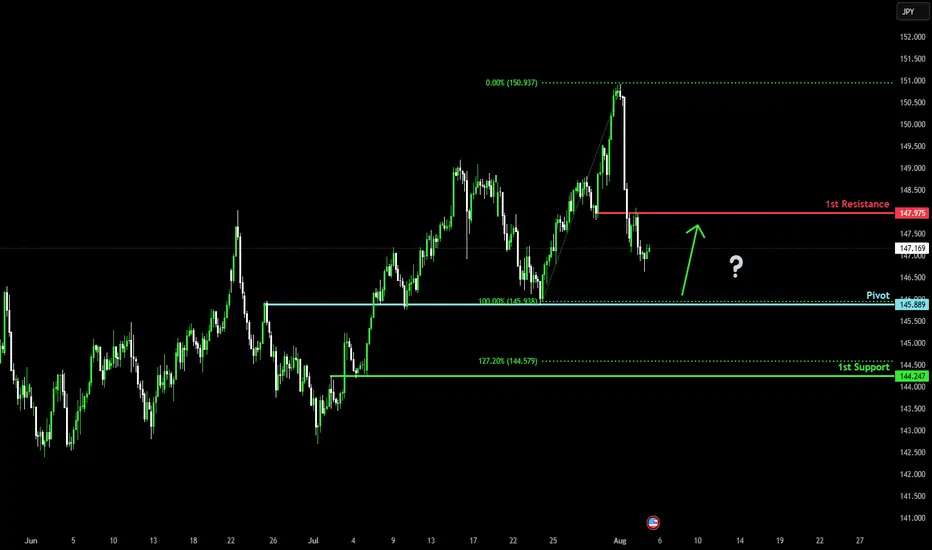
Falling towards major support?USD/JPY is falling towards the pivot, which has been identified as an overlap support and could bounce to the 1st resistance.
Pivot: 145.88
1st Support: 144.24
1st Resistance: 147.97
Risk Warning:
Trading Forex and CFDs carries a high level of risk to your capital and you should only trade with money you can afford to lose. Trading Forex and CFDs may not be suitable for all investors, so please ensure that you fully understand the risks involved and seek independent advice if necessary.
Disclaimer:
The above opinions given constitute general market commentary, and do not constitute the opinion or advice of IC Markets or any form of personal or investment advice.
Any opinions, news, research, analyses, prices, other information, or links to third-party sites contained on this website are provided on an "as-is" basis, are intended only to be informative, is not an advice nor a recommendation, nor research, or a record of our trading prices, or an offer of, or solicitation for a transaction in any financial instrument and thus should not be treated as such. The information provided does not involve any specific investment objectives, financial situation and needs of any specific person who may receive it. Please be aware, that past performance is not a reliable indicator of future performance and/or results. Past Performance or Forward-looking scenarios based upon the reasonable beliefs of the third-party provider are not a guarantee of future performance. Actual results may differ materially from those anticipated in forward-looking or past performance statements. IC Markets makes no representation or warranty and assumes no liability as to the accuracy or completeness of the information provided, nor any loss arising from any investment based on a recommendation, forecast or any information supplied by any third-party.
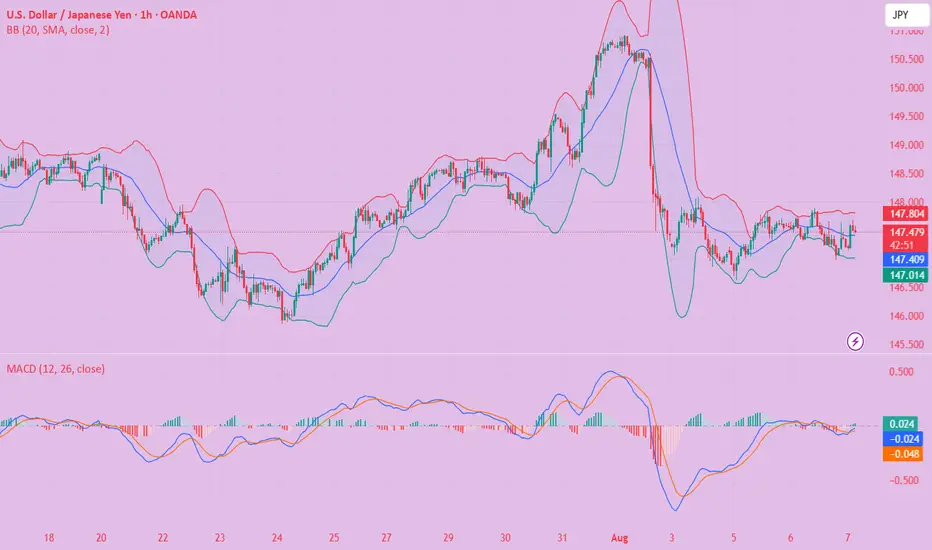
USD/JPY(20250807)Today's AnalysisMarket News:
Federal Reserve Chairman Kashkari: A rate cut may be appropriate in the short term, and two rate cuts this year are reasonable. Trump: The new Fed governor will likely be temporary, and the appointment will be announced within 2-3 days.
Technical Analysis:
Today's Buy/Sell Levels:
147.40
Support and Resistance Levels:
148.30
147.96
147.74
147.05
146.83
146.49
Trading Strategy:
If the market breaks above 147.40, consider a buy entry, with the first target price being 147.74. If the market breaks below 147.05, consider a sell entry, with the first target price being 146.83
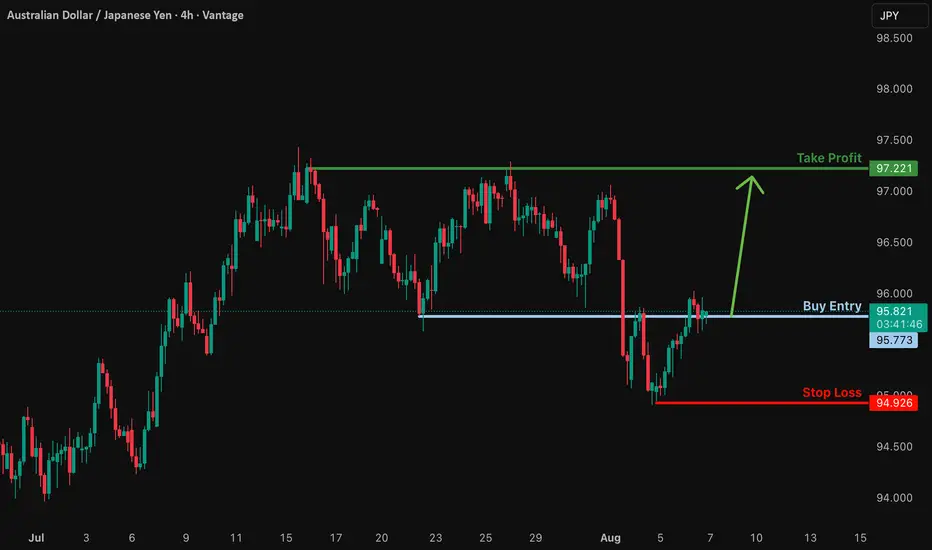
Bullish rise?AUD/JPY is reacting off the support level which is an overlap support and could bounce from this level to our take profit.
Entry: 95.77
Why we like it:
There is an overlap support.
Stop loss: 94.92
Why we like it:
There is a swing low support.
Take profit: 97.22
Why we like it:
There is a multi swing high resistance.
Enjoying your TradingView experience? Review us!
Please be advised that the information presented on TradingView is provided to Vantage (‘Vantage Global Limited’, ‘we’) by a third-party provider (‘Everest Fortune Group’). Please be reminded that you are solely responsible for the trading decisions on your account. There is a very high degree of risk involved in trading. Any information and/or content is intended entirely for research, educational and informational purposes only and does not constitute investment or consultation advice or investment strategy. The information is not tailored to the investment needs of any specific person and therefore does not involve a consideration of any of the investment objectives, financial situation or needs of any viewer that may receive it. Kindly also note that past performance is not a reliable indicator of future results. Actual results may differ materially from those anticipated in forward-looking or past performance statements. We assume no liability as to the accuracy or completeness of any of the information and/or content provided herein and the Company cannot be held responsible for any omission, mistake nor for any loss or damage including without limitation to any loss of profit which may arise from reliance on any information supplied by Everest Fortune Group.
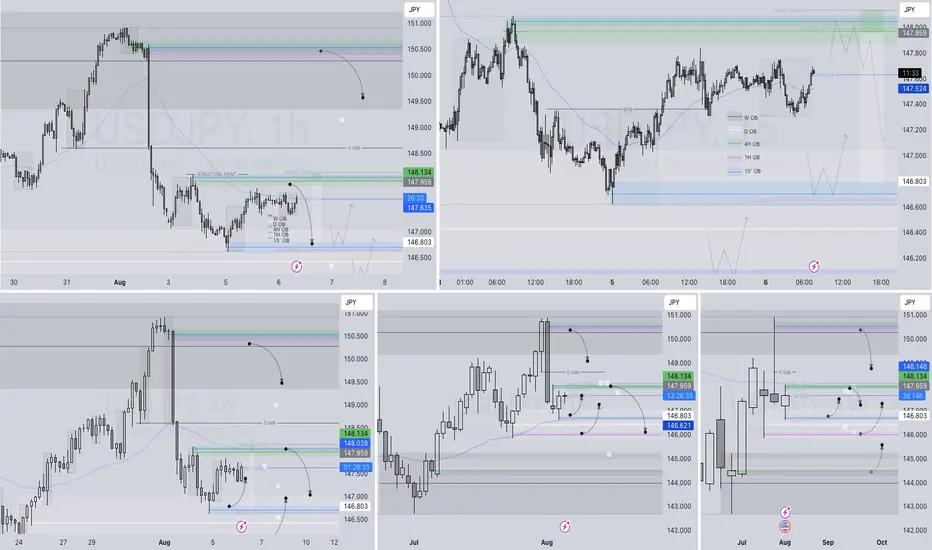
USDJPY – DAILY FORECAST Q3 | W32 | D6 | Y25📊 USDJPY – DAILY FORECAST
Q3 | W32 | D6 | Y25
Daily Forecast 🔍📅
Here’s a short diagnosis of the current chart setup 🧠📈
Higher time frame order blocks have been identified — these are our patient points of interest 🎯🧭.
It’s crucial to wait for a confirmed break of structure 🧱✅ before forming a directional bias.
This keeps us disciplined and aligned with what price action is truly telling us.
📈 Risk Management Protocols
🔑 Core principles:
Max 1% risk per trade
Only execute at pre-identified levels
Use alerts, not emotion
Stick to your RR plan — minimum 1:2
🧠 You’re not paid for how many trades you take, you’re paid for how well you manage risk.
🧠 Weekly FRGNT Insight
"Trade what the market gives, not what your ego wants."
Stay mechanical. Stay focused. Let the probabilities work.
FX:USDJPY
#016: CHF/JPY Long Investment Opportunity
Today I want to show you this long investment opportunity by placing a BUY LIMIT order on CHF/JPY. Hello, I'm Forex Trader Andrea Russo, an independent trader and prop trader with $200,000 in capital under management. Thank you in advance for your time.
The CHF/JPY pair is building an extremely interesting technical pattern, which could offer one of the best risk-controlled long opportunities in recent weeks.
🧠 Advanced Structural Analysis
After an orderly sequence of lower highs, the price recently completed a bearish move that looks more like directional manipulation than a true breakout.
Three key elements support this hypothesis:
- Final compression on decreasing volume
- Visible divergence between relative strength and price movement
- Volume clusters interrupted in the lower zone, with the LVN area still empty and devoid of institutional liquidity
🔍 The hunting zone is already active
According to our studies, the price is exactly within the so-called "stop hunting zone," a range between technical and psychological levels where:
- Retail traders are closing long positions at a loss
- Breakout traders are entering short positions late
- Market makers are accumulating passively, exploiting market emotion
Historically, these zones herald strong reversals if defended by banks' protective orders.
🔄 Multi-Timeframe Confluence
All higher timeframes (4H, 8H, and Daily) show a consistent picture of active cyclical support, with a potential harmonic pattern nearing completion and a technical structure that coincides with previous levels of institutional reaction.
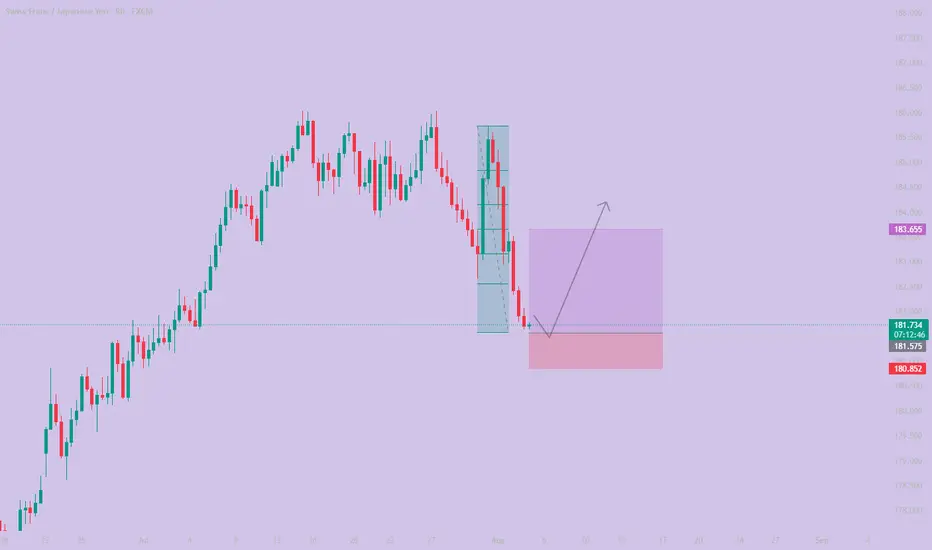
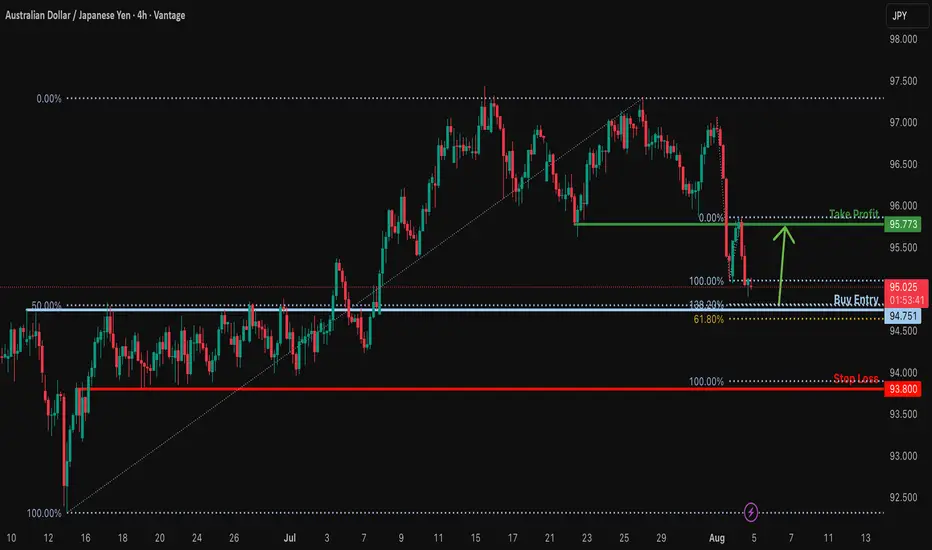
Bullish reversal off Fibonacci confluence?AUD/JPY is falling towards a support level, which is a pullback support aligning with the 138.2% Fibonacci extension, the 50% Fibonacci retracement, and the 61.8% Fibonacci projection. A bounce from this level could push the price toward our take-profit target.
Entry: 94.75
Why we like it:
There is a pullback support level that aligns with the 50% Fibonacci retracement, the 138.2% Fibonacci extension and the 61.8% Fibonacci projection.
Stop loss: 93.80
Why we like it:
There is a pullback support that lines up witht he 100% Fibonacci projection.
Takeprofit: 95.77
Why we like it:
There is an overlap resistance.
Enjoying your TradingView experience? Review us!
Please be advised that the information presented on TradingView is provided to Vantage (‘Vantage Global Limited’, ‘we’) by a third-party provider (‘Everest Fortune Group’). Please be reminded that you are solely responsible for the trading decisions on your account. There is a very high degree of risk involved in trading. Any information and/or content is intended entirely for research, educational and informational purposes only and does not constitute investment or consultation advice or investment strategy. The information is not tailored to the investment needs of any specific person and therefore does not involve a consideration of any of the investment objectives, financial situation or needs of any viewer that may receive it. Kindly also note that past performance is not a reliable indicator of future results. Actual results may differ materially from those anticipated in forward-looking or past performance statements. We assume no liability as to the accuracy or completeness of any of the information and/or content provided herein and the Company cannot be held responsible for any omission, mistake nor for any loss or damage including without limitation to any loss of profit which may arise from reliance on any information supplied by Everest Fortune Group.
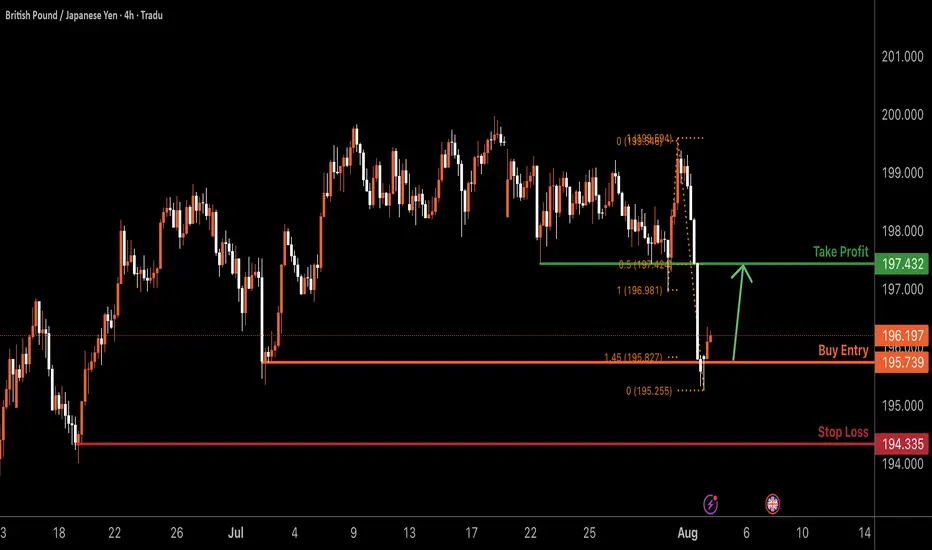
GBPJPY H4 | Bullish bounce offGBP/JPY has bounced off the buy entry, which has been identified as a swing low support and could potentially rise from this level to the take profit.
Buy entry is at 195.73, which is a swing low support that lines up with the 145% Fibonacci extension.
Stop loss is at 194.33, which is a swing low support.
Take profit is at 197.43, which is a pullback resistance that aligns with the 50% Fibonacci retracement.
High Risk Investment Warning
Trading Forex/CFDs on margin carries a high level of risk and may not be suitable for all investors. Leverage can work against you.
Stratos Markets Limited (tradu.com ):
CFDs are complex instruments and come with a high risk of losing money rapidly due to leverage. 65% of retail investor accounts lose money when trading CFDs with this provider. You should consider whether you understand how CFDs work and whether you can afford to take the high risk of losing your money.
Stratos Europe Ltd (tradu.com ):
CFDs are complex instruments and come with a high risk of losing money rapidly due to leverage. 66% of retail investor accounts lose money when trading CFDs with this provider. You should consider whether you understand how CFDs work and whether you can afford to take the high risk of losing your money.
Stratos Global LLC (tradu.com ):
Losses can exceed deposits.
Please be advised that the information presented on TradingView is provided to Tradu (‘Company’, ‘we’) by a third-party provider (‘TFA Global Pte Ltd’). Please be reminded that you are solely responsible for the trading decisions on your account. There is a very high degree of risk involved in trading. Any information and/or content is intended entirely for research, educational and informational purposes only and does not constitute investment or consultation advice or investment strategy. The information is not tailored to the investment needs of any specific person and therefore does not involve a consideration of any of the investment objectives, financial situation or needs of any viewer that may receive it. Kindly also note that past performance is not a reliable indicator of future results. Actual results may differ materially from those anticipated in forward-looking or past performance statements. We assume no liability as to the accuracy or completeness of any of the information and/or content provided herein and the Company cannot be held responsible for any omission, mistake nor for any loss or damage including without limitation to any loss of profit which may arise from reliance on any information supplied by TFA Global Pte Ltd.
The speaker(s) is neither an employee, agent nor representative of Tradu and is therefore acting independently. The opinions given are their own, constitute general market commentary, and do not constitute the opinion or advice of Tradu or any form of personal or investment advice. Tradu neither endorses nor guarantees offerings of third-party speakers, nor is Tradu responsible for the content, veracity or opinions of third-party speakers, presenters or participants.
USDJPY H4 | Bullish bounce offBased on the H4 chart analysis, we can see that the price has bounced off the buy entry, which is an overlap support, and could potentially rise further.
Buy entry is at 147.04, which is an overlap support that aligns with the 78.6% Fibonacci retracement.
Stop loss is at 145.82, which is a multi-swing low support.
Take profit is at 148.72, which is a pullback resistance that lines up with the 38.2% Fibonacci retracement.
High Risk Investment Warning
Trading Forex/CFDs on margin carries a high level of risk and may not be suitable for all investors. Leverage can work against you.
Stratos Markets Limited (tradu.com ):
CFDs are complex instruments and come with a high risk of losing money rapidly due to leverage. 65% of retail investor accounts lose money when trading CFDs with this provider. You should consider whether you understand how CFDs work and whether you can afford to take the high risk of losing your money.
Stratos Europe Ltd (tradu.com ):
CFDs are complex instruments and come with a high risk of losing money rapidly due to leverage. 66% of retail investor accounts lose money when trading CFDs with this provider. You should consider whether you understand how CFDs work and whether you can afford to take the high risk of losing your money.
Stratos Global LLC (tradu.com ):
Losses can exceed deposits.
Please be advised that the information presented on TradingView is provided to Tradu (‘Company’, ‘we’) by a third-party provider (‘TFA Global Pte Ltd’). Please be reminded that you are solely responsible for the trading decisions on your account. There is a very high degree of risk involved in trading. Any information and/or content is intended entirely for research, educational and informational purposes only and does not constitute investment or consultation advice or investment strategy. The information is not tailored to the investment needs of any specific person and therefore does not involve a consideration of any of the investment objectives, financial situation or needs of any viewer that may receive it. Kindly also note that past performance is not a reliable indicator of future results. Actual results may differ materially from those anticipated in forward-looking or past performance statements. We assume no liability as to the accuracy or completeness of any of the information and/or content provided herein and the Company cannot be held responsible for any omission, mistake nor for any loss or damage including without limitation to any loss of profit which may arise from reliance on any information supplied by TFA Global Pte Ltd.
The speaker(s) is neither an employee, agent nor representative of Tradu and is therefore acting independently. The opinions given are their own, constitute general market commentary, and do not constitute the opinion or advice of Tradu or any form of personal or investment advice. Tradu neither endorses nor guarantees offerings of third-party speakers, nor is Tradu responsible for the content, veracity or opinions of third-party speakers, presenters or participants.

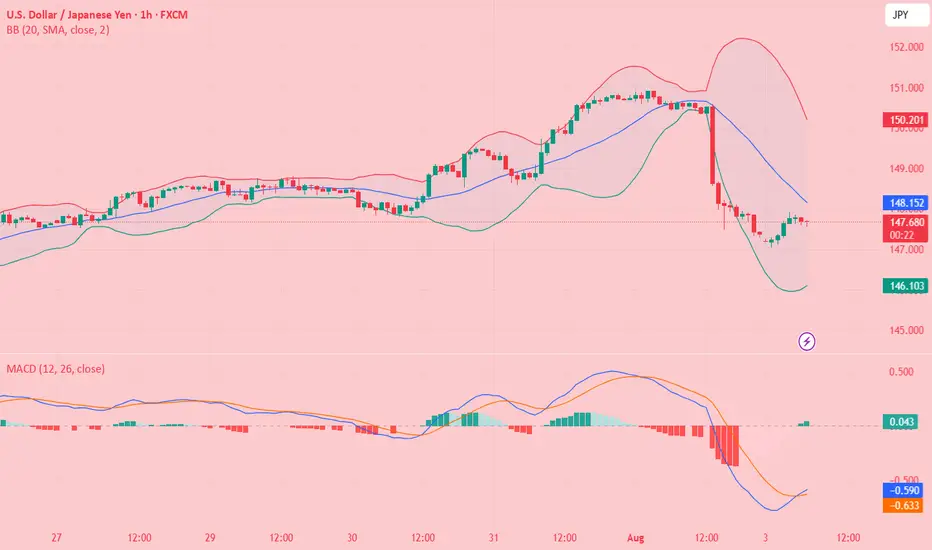
USD/JPY(20250804)Today's AnalysisMarket News:
① The US non-farm payrolls rose by 73,000 jobs in July, far below the expected 110,000; the previous two months saw a significant downward revision of 258,000 jobs, prompting traders to fully price in two Fed rate cuts before the end of the year.
② The US ISM Manufacturing PMI for July unexpectedly fell to 48, below the expected 49.5 and the lowest level since October 2024.
③ The University of Michigan Consumer Confidence Index for July reached a five-month high.
Technical Analysis:
Today's Buy/Sell Levels:
148.53
Support and Resistance Levels:
152.12
150.78
149.91
147.15
146.28
144.94
Trading Strategy:
If it breaks above 148.53, consider entering a buy position, with the first target price being 149.91. If it breaks below 147.15, consider entering a sell position, with the first target price being 146.28.
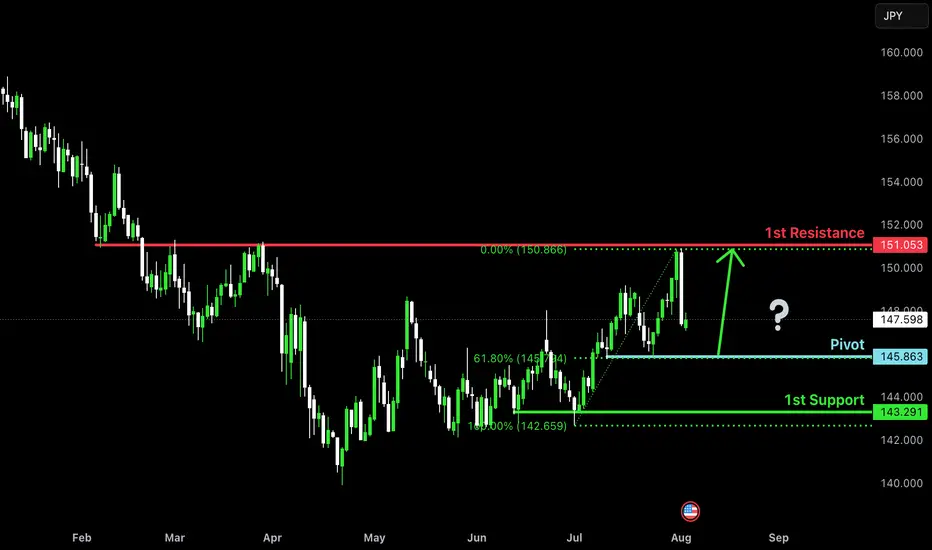
Bullish bounce off pullback support?USD/JPY is falling towards the pivot, which is a pullback support and could bounce to the 1st resistance.
Pivot: 145.86
1st Support: 143.29
1st Resistance: 151.05
Risk Warning:
Trading Forex and CFDs carries a high level of risk to your capital and you should only trade with money you can afford to lose. Trading Forex and CFDs may not be suitable for all investors, so please ensure that you fully understand the risks involved and seek independent advice if necessary.
Disclaimer:
The above opinions given constitute general market commentary, and do not constitute the opinion or advice of IC Markets or any form of personal or investment advice.
Any opinions, news, research, analyses, prices, other information, or links to third-party sites contained on this website are provided on an "as-is" basis, are intended only to be informative, is not an advice nor a recommendation, nor research, or a record of our trading prices, or an offer of, or solicitation for a transaction in any financial instrument and thus should not be treated as such. The information provided does not involve any specific investment objectives, financial situation and needs of any specific person who may receive it. Please be aware, that past performance is not a reliable indicator of future performance and/or results. Past Performance or Forward-looking scenarios based upon the reasonable beliefs of the third-party provider are not a guarantee of future performance. Actual results may differ materially from those anticipated in forward-looking or past performance statements. IC Markets makes no representation or warranty and assumes no liability as to the accuracy or completeness of the information provided, nor any loss arising from any investment based on a recommendation, forecast or any information supplied by any third-party.
EURJPY 4hour TF - August 3rd,2025🟦 EURJPY 4H Analysis Bearish Idea
📅 August 3, 2025
🔹 Top-Down Trend Bias:
• Monthly – Bullish
• Weekly – Bullish
• Daily – Bullish
• 4H – Bearish
EURJPY has pulled back through the previous support zone around 171.000 and is currently consolidating after a sharp bearish move. Short term trend remains bearish, but higher timeframes suggest this may be a corrective phase.
🔍 Key Zone: 171.00 – 171.70
This zone represents the 38.2% fib retracement and prior structure. A rejection from this area could trigger further downside, while a break above may confirm a higher low.
✅ Scenario A: Bearish Continuation (Blue Path)
1.If price taps into 171.00–171.70 and rejects
2.Look for bearish confirmation (rejection wick, bearish engulfing, BOS)
Target: 169.60 (key support)
This setup follows short term momentum and offers clean R:R into prior liquidity.
⚠️ Scenario B: Bullish Break & Hold (Orange Path)
1.If price breaks and closes above 172.250
2.Watch for continuation toward 173.750, our extended fib target
3.Structure shift + bullish PA would align with HTF bullish trend
This would confirm strength returning to the pair, ideal for HTF trend continuation traders.
🧠 Final Notes
• 171.00–171.70 is the reaction zone to watch
• HTFs remain bullish, but 4H momentum must flip to validate upside
• Let price confirm direction

USDJPY 4Hour TF - August 3rd, 2025🟦 USDJPY 4H Analysis Bullish Idea
📅 August 3, 2025
🔹 Top-Down Trend Bias:
• Monthly – Bullish
• Weekly – Bearish
• Daily – Bullish
• 4H – Bearish
USDJPY has retraced sharply from local highs, breaking down into prior support near 147.50. Short term structure has shifted bearish, but higher timeframes still lean bullish making this a key reaction zone to monitor.
🔍 Key Zone: 147.00 – 147.50
This zone sits at a prior key support zone. How price reacts here will determine whether the pair resumes its bullish leg or continues deeper.
✅ Scenario A: Bullish Rejection (Blue Path)
1.If price holds above 147.00–147.50 and prints bullish confirmation
2.Look for continuation toward 151.50
Target: 151.50 (next clean resistance zone)
This setup aligns with the HTF bullish trend. Clean break of structure and bullish reactions are needed for confirmation.
⚠️ Scenario B: Bearish Breakdown (Orange Path)
1.If price breaks and closes below 147.500 zone
2.Watch for lower high + retest rejection
Target: 145.00 support zone
This is a lower probability counter trend continuation but is possible if price action presents the needed confirmations.
🧠 Final Notes
• Price is at a decision point, wait for Price action confirmation
• HTF bias leans bullish, but 4H structure must shift back up
• Trade with structure, not against it
