This Guy has arrows down to 4400My last market update ended up receiving a comment from a Trading View user that seemingly was mocking the fact that my shorter-term chart posted in an update to my followers had directional arrows down to the approximate area of ES 4400.
Here's my longer-term expectations. If some didn't like 4400, I suspect they will equally dislike sub-ES 1,000.
Best to all.
Chris
J-SPX

Spx500usdThere u go by decimals, almost there,
Here you go, it might be in bull today, I just hope so
Keep Ur own trades safe guy and DYOR
Do always Your Own Reseach
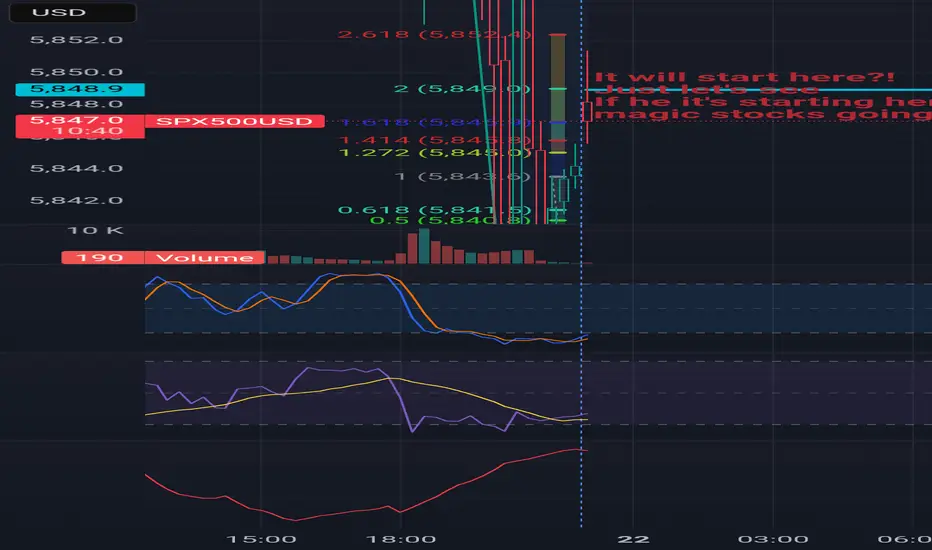
Spx500usd up? 1min chart at 23h London time?As it is , all I hope is that spx 500usd starts here at that blue line, after all, if it starts at the blue line the stock as might be up again, I'm not into the fundamentals by this time, I'm just making some Elliot and indicators-some mine, others don't, and trend analysis
Hope u guys all in profit
After all we all looking for the same
Keep Ur trades safe
And Do Always Your Own Research
DAYOR
Keep it safe
This my my graph at 1min candles, returned to 15min chart
Keep it safe.
And keep cool.

Is minor B done?In my last post…” We Have a Full Pattern into The Target Box” … I stated, “I am now looking for a 5-wave pattern to develop to the downside, followed by a 3-wave retrace, that in the coming weeks can take us back out of the target box to the downside.”
That pattern may have begun today in the very micro sense. This is very preliminary, so we need follow through to the downside so that in the days and weeks to come, we can confirm a top in minor B.

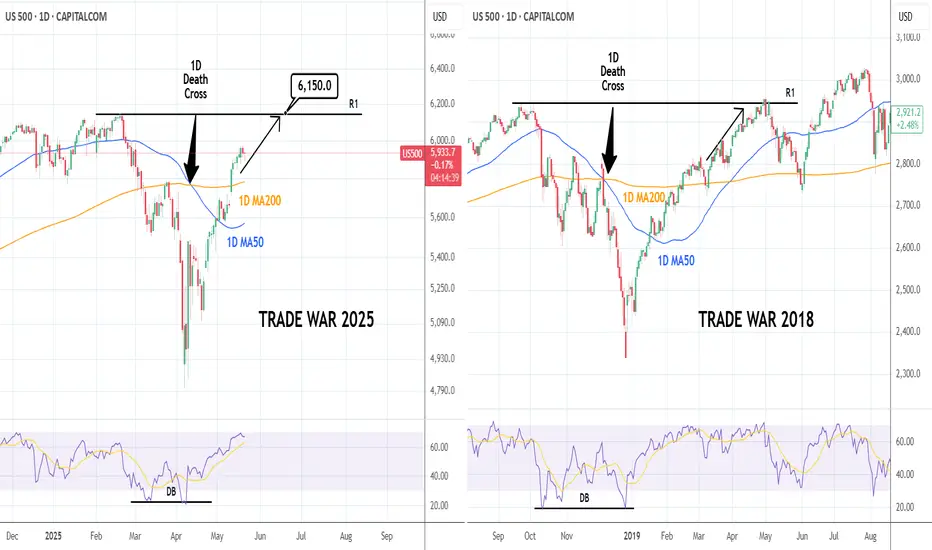
S&P500: First Trade War indicates that ATH comes soon.S&P500 is a very healthy bullish levels on its 1D technical outlook (RSI = 65.213, MACD = 111.000, ADX = 49.249), being considerably over its 1D MA200, with the 1D RSI very close to the overbought zone. This resembles the first Trade War in 2018, when once the 1D MA200 was crossed, it became a Support level and extended the rally to the index Highs and the R1. We remain bullish on SPX with TP = 6,150.
See how our prior idea has worked out:
## If you like our free content follow our profile to get more daily ideas. ##
## Comments and likes are greatly appreciated. ##
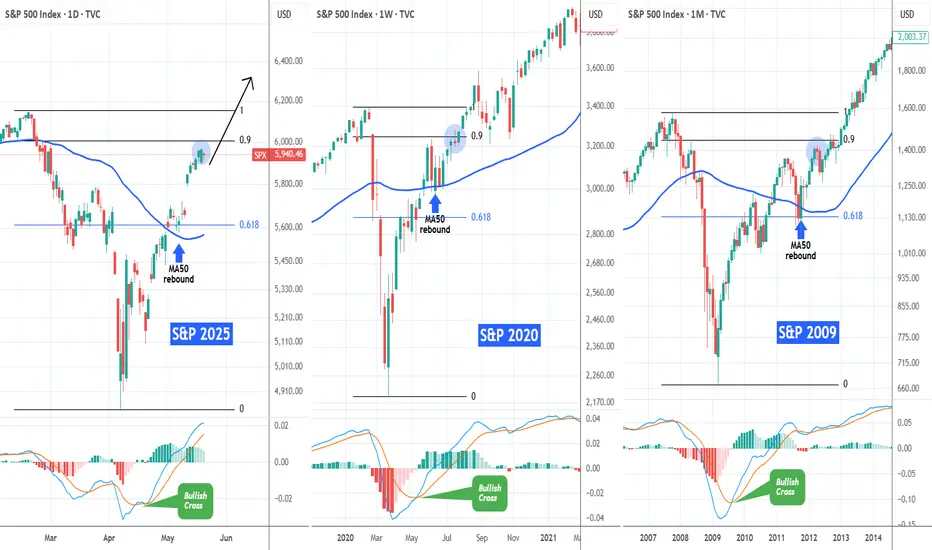
S&P500 Same recovery path with 2020 and 2009The S&P500 index (SPX) has recovered almost 90% of its losses since the February 19 2025 All Time High (ATH) and many have already started calling for a technical correction.
If we compare however this 2025 Tariff fueled correction with the recent most aggressive ones (COVID crash in 2020 and Housing Crisis 2008/2009) we see a different picture.
On their respective 0.9 Fibonacci levels (close to which we are today), both of those market recoveries went straight to new ATHs, without testing their MA50 (blue trend-line) until the next Cycle peak. They had that tested before when the price was trading near (or on)the 0.618 Fib. Notice also how a MACD Bullish on all three charts, confirmed the aggressive recovery pattern straight after the bottom.
Instead of a correction, history shows that we might be looking at new ATH soon.
-------------------------------------------------------------------------------
** Please LIKE 👍, FOLLOW ✅, SHARE 🙌 and COMMENT ✍ if you enjoy this idea! Also share your ideas and charts in the comments section below! This is best way to keep it relevant, support us, keep the content here free and allow the idea to reach as many people as possible. **
-------------------------------------------------------------------------------
💸💸💸💸💸💸
👇 👇 👇 👇 👇 👇
05/20/25 Trade Journal, and Where is the Stock Market going tomoEOD accountability report: +293.75
Sleep: 4.5 hours , Overall health: Calm and tired. need to catch up on sleep.
What was my initial plan?
Market structure was bearish so, I started the day shorting, but once market flipped bullish, I switched to BTD mode.
Daily Trade recap based on VX Algo System
— 9:00 AM Market Structure flipped bearish on VX Algo X3!
— 10:20 AM VXAlgo NQ X1 Buy Signal
— 11:18 AM Market Structure flipped bullish on VX Algo X3!
— 12:30 PM Market Structure flipped bearish on VX Algo X3!
— 1:20 PM VXAlgo NQ X1 Sell Signal
— 3:13 PM VXAlgo ES X1 Buy signal 2x signal (C+ set up)
Next day plan--> Above 5900 = Bullish, if we lose 48min support at 5900--> 5800 next
Video Recaps -->https://tradingview.sweetlogin.com/u/WallSt007/#published-charts

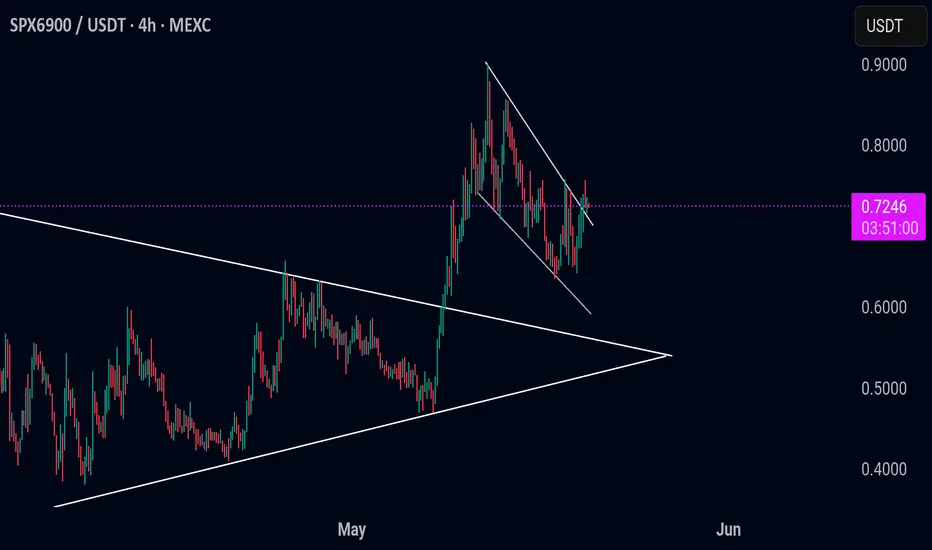
SPX/USDT Breakout SPXUSDT:
SPX is now trading around $0.7255. #SPX has already broken out of the bull flag pattern and looks bullish. So, the possible scenario is that, as a bull flag is a bullish pattern, we can expect bullish momentum. Otherwise, if the price dumps and trades inside the bull flag channel, the breakout will be considered a fakeout. Keep an eye on it.
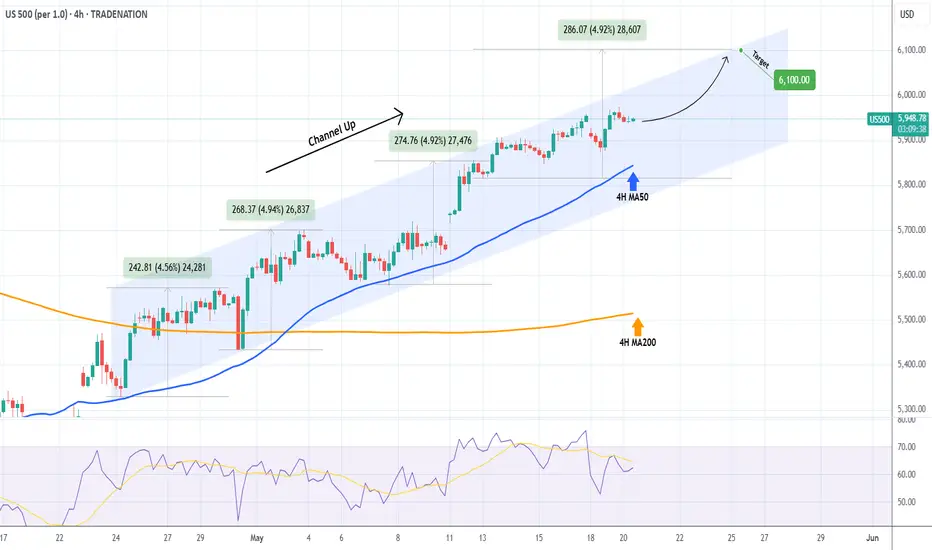
S&P500 Steady Channel Up to 6100The S&P500 index (SPX) has been trading within a Channel Up pattern from the moment (April 22) it broke above the 4H MA50 (blue trend-line). For that 1 month period, it has held the 4H MA50 and that maintains the bullish trend, generating Bullish Legs to High after High.
The last two Bullish Legs have increased by +4.92%, so as long as the 4H MA50 holds, we expect the current Leg to be completed at 6100.
-------------------------------------------------------------------------------
** Please LIKE 👍, FOLLOW ✅, SHARE 🙌 and COMMENT ✍ if you enjoy this idea! Also share your ideas and charts in the comments section below! This is best way to keep it relevant, support us, keep the content here free and allow the idea to reach as many people as possible. **
-------------------------------------------------------------------------------
Disclosure: I am part of Trade Nation's Influencer program and receive a monthly fee for using their TradingView charts in my analysis.
💸💸💸💸💸💸
👇 👇 👇 👇 👇 👇
Where is the Stock Market going tomorrow? Trade Journal 05/19/25EOD accountability report: +500
Sleep: 3.5 hours , Overall health: tired
What was my initial plan?
Short if market went under 5920, long with X7 buy signals, and short at 5968 area, and long if we retrace to 5925s
overall market went accordingly to Bullish structure and x7 buy signal. that's the whole reason of the system, to let you know what the market is and all you need to do is follow accordingly instead of fighting it.
Daily Trade recap based on VX Algo System
— 7:00 AM Market Structure flipped bullish on VX Algo X3!
— 9:36 AM VXAlgo X7 Buy Signal, ticker = NQ1!, price = 21281.25
— 2:00 PM VXAlgo ES X3 Sell Signal
— 2:35 PM Market Structure flipped bearish on VX Algo X3!
Next day plan--> Above 5920/5900 = Bullish, if we lose 48min support at 5928 --> 5875 next
Video Recaps -->https://tradingview.sweetlogin.com/u/WallSt007/#published-charts

Nightly $SPY / $SPX Scenarios for May 20, 2025🔮 Nightly AMEX:SPY / SP:SPX Scenarios for May 20, 2025 🔮
🌍 Market-Moving News 🌍
📉 Bear Market Concerns Emerge
Veteran investor David Kotok warns of a potential bear market, projecting that tariffs could reduce S&P 500 earnings per share from $260 to $230 over the next year. This outlook suggests a possible decline of the index to the 4,000–4,400 range, with elevated Treasury yields further pressuring valuations.
🚢 Retail Inventory Challenges Amid Tariff Uncertainty
The Port of Los Angeles reports potential lower inventories for retailers due to ongoing U.S.-China tariff uncertainties. Despite a temporary 90-day tariff reduction, complexities in forecasting cargo volumes persist, potentially leading to fewer product choices and rising prices for consumers.
🛍️ Retail Earnings Spotlight
Major retailers, including Home Depot ( NYSE:HD ), are set to report earnings today. Investors will closely monitor these reports for insights into consumer spending patterns amid economic uncertainties.
💬 Federal Reserve Officials Scheduled to Speak
Federal Reserve officials, including Richmond Fed President Tom Barkin and Boston Fed President Susan Collins, are scheduled to speak today. Their remarks will be scrutinized for indications of future monetary policy directions.
📊 Key Data Releases 📊
📅 Tuesday, May 20:
10:00 AM ET: Labor Force Characteristics of Foreign-born Workers (Annual 2024)
10:00 AM ET: State Job Openings and Labor Turnover for March 2025
⚠️ Disclaimer:
This information is for educational and informational purposes only and should not be construed as financial advice. Always consult a licensed financial advisor before making investment decisions.
📌 #trading #stockmarket #economy #news #trendtao #charting #technicalanalysis

BRIEFING Week #20 : ETH Reversed, WTI Next ?!Here's your weekly update ! Brought to you each weekend with years of track-record history..
Don't forget to hit the like/follow button if you feel like this post deserves it ;)
That's the best way to support me and help pushing this content to other users.
Kindly,
Phil

Weekly $SPY / $SPX Scenarios for May 19–23, 2025🔮 Weekly AMEX:SPY / SP:SPX Scenarios for May 19–23, 2025 🔮
🌍 Market-Moving News 🌍
📉 Moody's Downgrades U.S. Credit Rating
Moody's has downgraded the U.S. sovereign credit rating from Aaa to Aa1, citing concerns over rising national debt and interest payment ratios. This move aligns Moody's with previous downgrades by Fitch and S&P Global, potentially impacting investor sentiment and increasing market volatility.
🛍️ Retail Earnings in Focus
Major U.S. retailers, including Home Depot ( NYSE:HD ), Lowe’s ( NYSE:LOW ), Target ( NYSE:TGT ), TJX Companies ( NYSE:TJX ), Ross Stores ( NASDAQ:ROST ), and Ralph Lauren ( NYSE:RL ), are set to report earnings this week. Investors will be closely monitoring these reports for insights into consumer spending patterns amid ongoing tariff concerns.
💬 Federal Reserve Officials Scheduled to Speak
Several Federal Reserve officials, including Governor Michelle Bowman and New York Fed President John Williams, are scheduled to speak this week. Their remarks will be scrutinized for indications of future monetary policy directions, especially in light of recent economic data and market developments.
📊 Key Data Releases 📊
📅 Monday, May 19:
8:30 AM ET: Federal Reserve Bank of Atlanta President Raphael Bostic speaks.
8:45 AM ET: Federal Reserve Vice Chair Philip Jefferson and New York Fed President John Williams speak.
10:00 AM ET: U.S. Leading Economic Indicators for April.
📅 Tuesday, May 20:
8:30 AM ET: Building Permits and Housing Starts for April.
10:00 AM ET: Federal Reserve Bank of Minneapolis President Neel Kashkari speaks.
📅 Wednesday, May 21:
10:00 AM ET: Existing Home Sales for April.
10:30 AM ET: EIA Crude Oil Inventory Report.
📅 Thursday, May 22:
8:30 AM ET: Initial Jobless Claims.
9:45 AM ET: S&P Global Flash U.S. Manufacturing and Services PMI for May.
📅 Friday, May 23:
10:00 AM ET: New Home Sales for April.
⚠️ Disclaimer:
This information is for educational and informational purposes only and should not be construed as financial advice. Always consult a licensed financial advisor before making investment decisions.
📌 #trading #stockmarket #economy #news #trendtao #charting #technicalanalysis

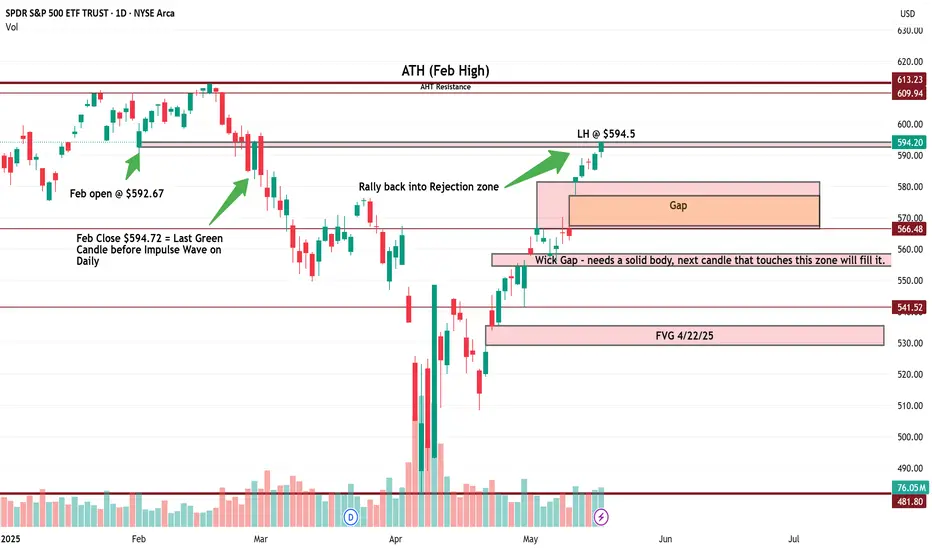
$SPY Daily Chart Taz Plan - May 2025 into June-July Breakdown📉 SPY Daily Chart Trading Plan — May 2025
Thesis:
Price has returned to the exact level ($594.20) where the February impulse breakdown began. This zone is acting as a Lower High rejection within a broader bearish structure. A clean rejection here opens the door to multiple inefficiency fills below.
🔍 Structure Breakdown:
Feb High (ATH): $613.23
Feb Open: $592.67
Feb Close (last green candle before impulse): $594.20
Current Price: $594.20
Marked LH: $592.50
This is a rally back into rejection, not strength.
📉 Key Zones & Gaps:
🔺 Gap Supply: $566.48 – $578.50
🔺 Wick Gap: $558 – $566 → Needs a full-body candle to initiate fill
🟥 FVG (4/22): $528 – $541.52
🧱 Major Support: $481.80
🧠 Trade Plan:
Short Entry 1 (Confirmation-Based):
🔻 Red candle rejection under $592.50 = starter short
🔻 Watch RSI and MACD for momentum fade
Short Entry 2 (Gap Breach):
🔻 If $578 is broken and retested → scale in
🔻 Gap fill expected quickly once triggered
Short Entry 3 (Wick Gap):
🔻 Body close through $558 = last add
🔻 Sets up for final flush to FVG
🎯 Targets:
$578.50 → $566.48 (Gap Fill)
$558 → $541.52 (Wick Gap & FVG Top)
$528 – $530 (FVG Close)
$481.80 (Long-Term Panic Target)
❌ Invalidation:
Daily close > $595.50 = Pause thesis
Weekly close > $600 = Structural shift, short squeeze zone
🧠 Final Thoughts:
This isn’t just a gap fill play — it’s a structural fade from a lower high back into memory. The Feb impulse wave left behind layers of inefficiency, and price just tapped the origin of the breakdown.
Momentum is peaking. If this is a trap, the downside should begin immediately.
Let the chart prove it.
US Downgrade, 3-5-10% Pullbacks But Still Bullish on S&PHappy Sunday!!!
US Futures open lower after Friday's close and Moody's downgrade.
Last time this occurred in 2011, the S&P dropped around 10% from the "news."
This is all interesting timing but I'm still liking pullbacks for opportunities to position
bullish in the US indexes (S&P, Nasdaq, Dow)
Because the melt-up continues to run (US/China gap last week and drift higher), I'm trying to stay patient for a pause or pullback
Trump and Bessent are still chirping about Tariffs and a government "detox" so a round of trade war related news may help calm the market's red hot advance post April 7 lows
I'm selling calls on owned positions for income. I'm waiting for more favorable levels to add new positions, but within 3-4% of all time highs for the S&P and Nasdaq I don't think anybody will be surprised to see the all-time highs revisited in the near to medium-term
Let's have a great week - thanks for watching!!!
-Chris Pulver

SPX: in an optimistic moodIt was a good week for the S&P 500, which managed to gain each day during the previous week, surging by around 5% on a weekly basis. Positive market sentiment was supported by easing of trade tariffs tensions between the US and China. It should be also noted that the US Administration signed significant partnerships with countries in the Middle East, mostly in the field of technology and further support to AI development. These agreements will ensure that US companies, mostly in the AI and tech industry, will secure trillions of US Dollars in investments within the next couple of years. In this sense, the US tech companies gained during the week, with Nvidia as a leader in the chip industry, surging around 16% on a weekly basis. META was traded higher by some 8%, Apple surged by 6%, while Microsoft gained modest 3% on a weekly basis.
Analysts are noting that the markets are currently re-thinking the stagflation risks, which was previously priced during the peak of US-China trade tariffs tensions. This was the major catalyst for the positive sentiment during the previous week, and easily might support its continued optimism also in the weeks ahead. Still, it should be considered that the US equity market continues to be vulnerable to fundamentals, especially toward the news related to trade tariffs. Such fundamentals might bring some short term volatility, however, general positive sentiment is currently holding.
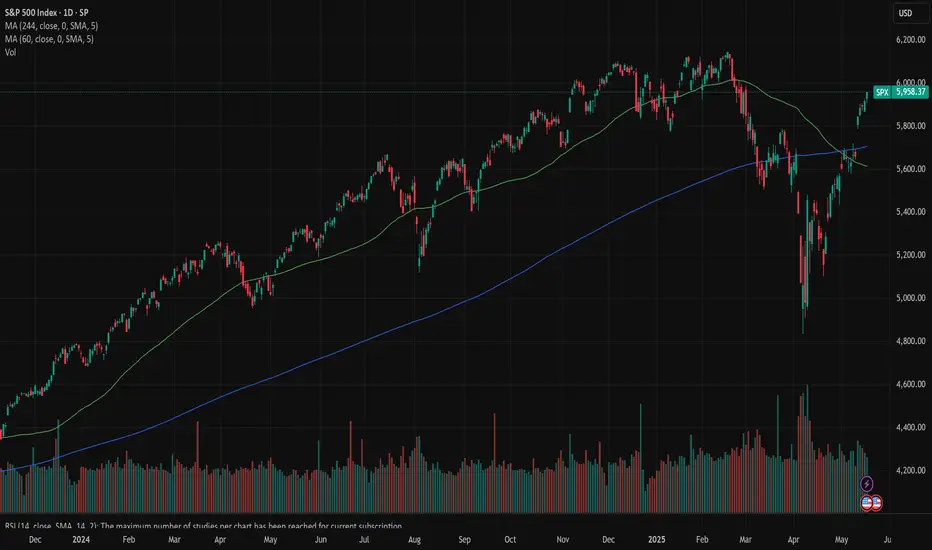
SPX headed for a correctionMoody's has downgraded US Debt. This news is a catalyst for a overdue correction (Or reversal?)
I published this script some days back. It can predict price inflection points very well
Based on the past behaviour, I can say we are heading for a correction technically and the fill the gap of last week

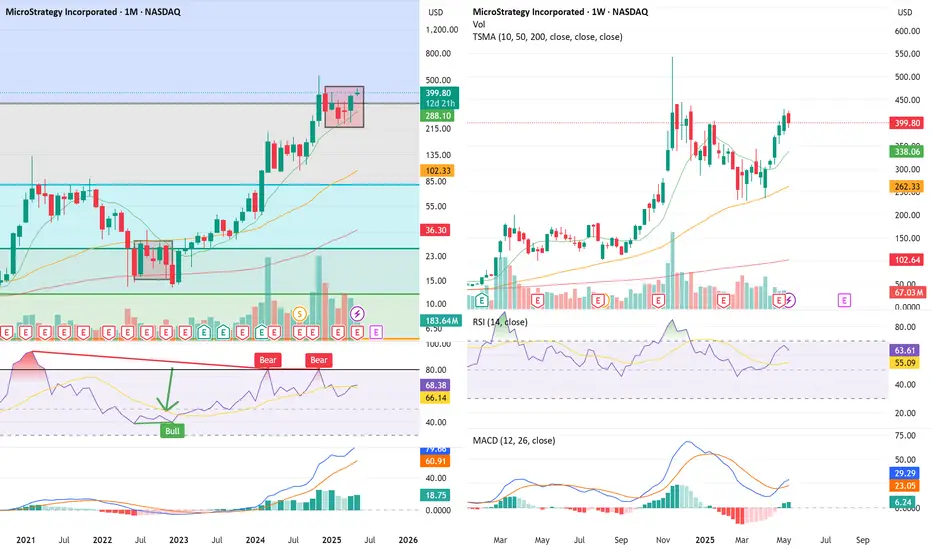
$MSTR Monthly Top Form: “Backwards 4” + Multi-TF RSI DivergenceBefore we begin... trading view is restricting my post for an indicator.. maybe someone reported it... not sure... doesn't seem like a problem... it's a TD Sequential ...
🔍 The Setup — Monthly “Backwards 4” Pattern + Multi-Timeframe Breakdown
We’re now forming the 5th candle in what I call the “Backwards 4” formation, or the upside-down lowercase ‘h’ — a recurring reversal structure I’ve tracked at macro tops.
Structure breakdown:
✅ Strong monthly green candle
2–3. 🔻 Two red candles that retrace the body but don’t break it
✅ A second green candle that re-tests the highs and baits breakout buyers
❌ Final candle closes red → confirms exhaustion → multi-month drawdown begins
We saw this exact setup in early 2021 before MSTR collapsed from $1,000+ to $134. The pattern is now repeating — but this time it’s backed by RSI + MACD divergences on all major timeframes.
📊 Multi-Timeframe Technical Breakdown
📆 Monthly
Inside the “Backwards 4” zone now (candle 5)
RSI Bear Divergence: price made new highs but RSI keeps printing lower highs
MACD flattening after extended expansion
Volume fading for 3 months straight
📌 Momentum is dying while price floats. That’s not strength — that’s late-cycle distribution.
📆 Weekly
TD9 printed this week at the top of a tight 5-month box
RSI rejected at 63.61 — exact same rejection level as last cycle highs
MACD histogram curling while price stayed flat
Range: ~$338–$430 → energy has been spent
📌 This isn’t breakout behavior — it’s a liquidity trap.
📆 Daily
Double top attempt failed at $406
MACD crossed bearish, histogram turning red
RSI Bear Divergence Confirmed:
Price made higher highs from April to May
RSI made lower highs, tagging 66.90 vs. 74.70 earlier this year
📌 Daily has now logged 3 bearish RSI divergence peaks since February.
📋 Trading Plan (as of May 17, 2025)
Position: No current short — stalking ideal entry
Entry Zone: $406–$410 rejection zone (upper box resistance)
Trigger: Daily close under $390 confirms failed breakout
Add Confirmation: Weekly close under $375 = trend shift
Stop: Above $430 monthly high (invalidates breakout fade)
Target 1: $320–$290 (May red close zone)
Target 2: $262 (range midpoint / fib retrace)
Target 3: $240 (prior base support)
Stretch Targets: $175 and $102 if macro breaks down
Waiting for clean structure breakdown before initiating core position. This is a setup worth being early but precise on.
🧠 Final Thoughts:
This is one of my highest conviction macro top setups.
The “Backwards 4” is showing up again with RSI and MACD fading across the board. Price is floating under resistance on weakening momentum, and volume confirms it.
If May closes red, we likely begin a multi-month correction.
I’m watching for the breakdown trigger under $390 to begin building short exposure, targeting sub-$300 by month-end and lower into summer if momentum continues to unwind.
📉📦 Let’s see how it finishes.
+10% from tomorrow till mid-MaySPX is getting ready to rebound with around 10% till mid-May. Invalidated if breaks below 5400.

S&P500 Historic reversals like this delivered even +100% gains!The S&P500 (SPX) is making a remarkable bullish reversal and on the monthly (1M) chart is even more evident due to April's candle, which almost closed flat leaving a huge wick under it, a feat we've never seen in recent history.
What we have seen however since the 2008 Housing Crisis, is every time the index hits (or approaches) its 1M MA50 (blue trend-line), it reverses to an incredible rally, technically a new Bull Cycle.
This is what happened in April, the index came a breath away from the 1M MA50 and delivered the strongest monthly bullish reversal of our time. On top of that, it hit and rebounded exactly on the former All Time High Resistance, which held and turned into Support. All such Resistance levels since 2008 have held. Also note that the only time the 1M MA50 really broke (closed the month below it), was during the March 2020 COVID flash-crash, which is a non-technical event/ irregularity and still it rebounded on the 1M MA100 (green trend-line).
The minimum long-term rise that SPX had after such correction was +76.20% and the maximum +104.17%. Assuming the minimum price increase for the current emerging rise, we expect the index to hit 8300 by late 2027.
-------------------------------------------------------------------------------
** Please LIKE 👍, FOLLOW ✅, SHARE 🙌 and COMMENT ✍ if you enjoy this idea! Also share your ideas and charts in the comments section below! This is best way to keep it relevant, support us, keep the content here free and allow the idea to reach as many people as possible. **
-------------------------------------------------------------------------------
💸💸💸💸💸💸
👇 👇 👇 👇 👇 👇

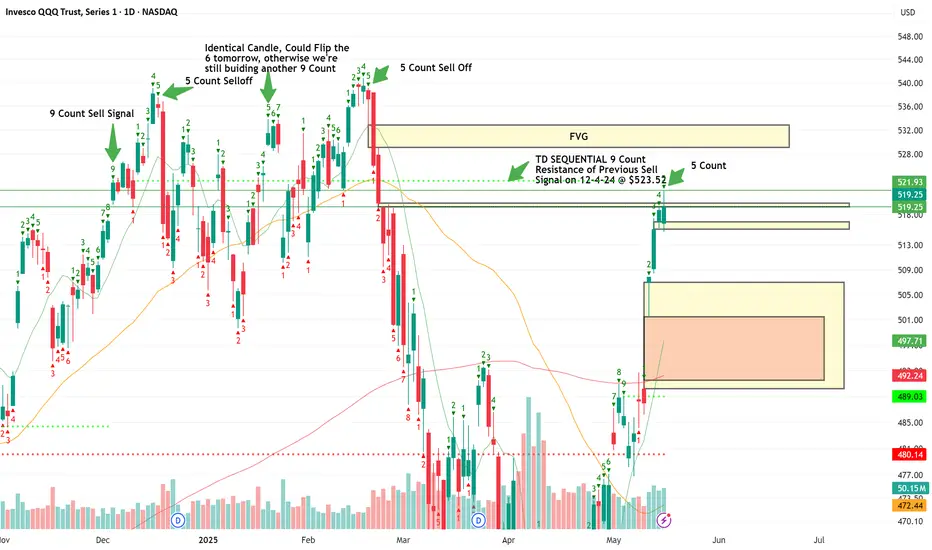
$QQQ Over $523.5 for a retest of Highs. Lower High Setup?As you can see on the notes in the chart, several 5 counts lead to sell offs in the last Quarter. Will this trend continue or will we run it to a 9 Count again? 3 Days left. Watch these levels as I have a possible selloff to May open Price. This would effectively follow my 10D chart forecast of new lows in the next 30-40 trading days, if not 20 for significant damage either way. I will continue to update as we go.
Nightly $SPY / $SPX Scenarios for May 16, 2025🔮 Nightly AMEX:SPY / SP:SPX Scenarios for May 16, 2025 🔮
🌍 Market-Moving News 🌍
📉 Jamie Dimon Warns of Possible Recession
JPMorgan Chase CEO Jamie Dimon cautioned that a U.S. recession remains a real possibility amid ongoing uncertainty from the Trump administration's tariff policies. Speaking at JPMorgan’s Global Markets Conference in Paris, Dimon stated that while he hopes a recession can be avoided, it should not be ruled out.
💵 Stablecoin Legislation May Bolster U.S. Dollar
U.S. policymakers are advancing legislation to regulate dollar-linked stablecoins, aiming to reinforce the strength and global status of the U.S. dollar. The proposed Guiding and Establishing National Innovation for U.S. Stablecoins Act of 2025 (GENIUS Act) seeks to regulate stablecoins and their issuers, potentially anchoring the dollar's influence in the global financial ecosystem.
🏠 The Great Property Sell Fest Begins in India
The Great Property Sell Fest, a first-of-its-kind property festival in the Indian real estate market, is scheduled to take place from May 16 to 18, 2025. The event will be hosted across key locations including Gurugram, Noida, and Panipat, offering a unique platform for homeowners looking to sell their properties at premium prices.
📊 Key Data Releases 📊
📅 Friday, May 16:
8:30 AM ET: U.S. Import and Export Price Indexes for April
⚠️ Disclaimer:
This information is for educational and informational purposes only and should not be construed as financial advice. Always consult a licensed financial advisor before making investment decisions.
📌 #trading #stockmarket #economy #news #trendtao #charting #technicalanalysis

S&P500 - The bottom we have been waiting for!The S&P500 - TVC:SPX - officially created the bottom:
(click chart above to see the in depth analysis👆🏻)
This month we officially saw one of the craziest stock market fakeouts of the past decade. With a drop and reversal rally of about +15%, the S&P500 is about to even close with a green monthly candle, which then indicates that the stock market bottom was created.
Levels to watch: $120, $250
Keep your long term vision!
Philip (BasicTrading)
