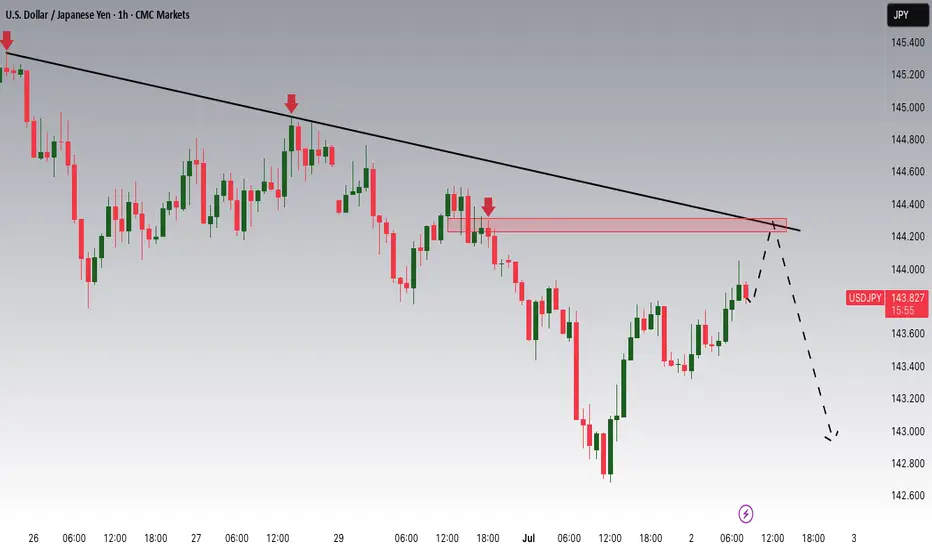
USDJPY Potential DownsidesHey Traders, in today's trading session we are monitoring USDJPY for a selling opportunity around 144.200 zone, USDJPY is trading in a downtrend and currently is in a correction phase in which it is approaching the trend at 144.200 support and resistance area.
Trade safe, Joe.
J-USD
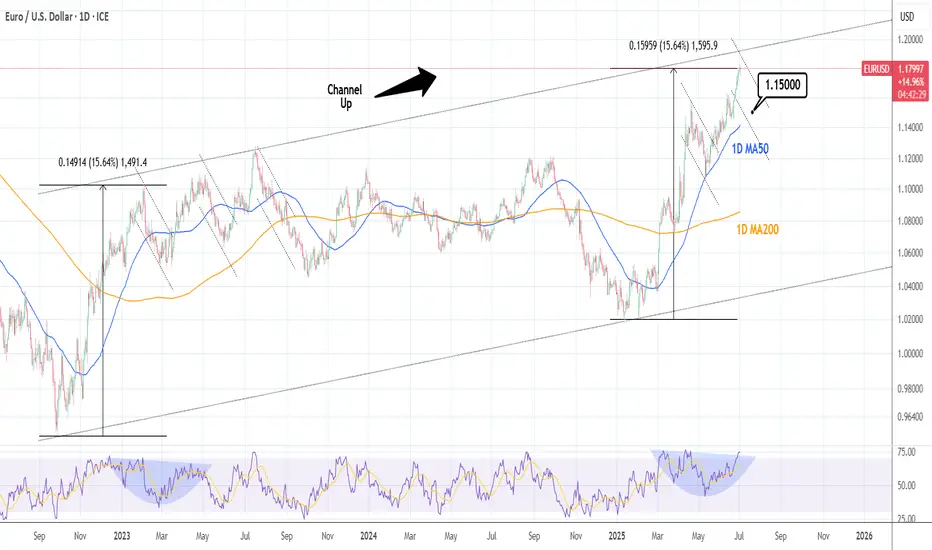
EURUSD: Correction to 1D MA50 possible.EURUSD is vastly overbought on its 1D technical outlook (RSI = 74.017, MACD = 0.011, ADX = 27.363) having completed a +15.64% rise from the February 3rd 2025 Low. That was a technical HL bottom on the 3 year Channel Up and the same amount of price increase was seen on its first bullish wave. When it peaked it made three successive highs over a 6 month period (Feb-July 2023) before starting a long term bearish sentiment creation. For now, we can expect at least a 1D MA50 test on the short-term (TP = 1.15000).
## If you like our free content follow our profile to get more daily ideas. ##
## Comments and likes are greatly appreciated. ##
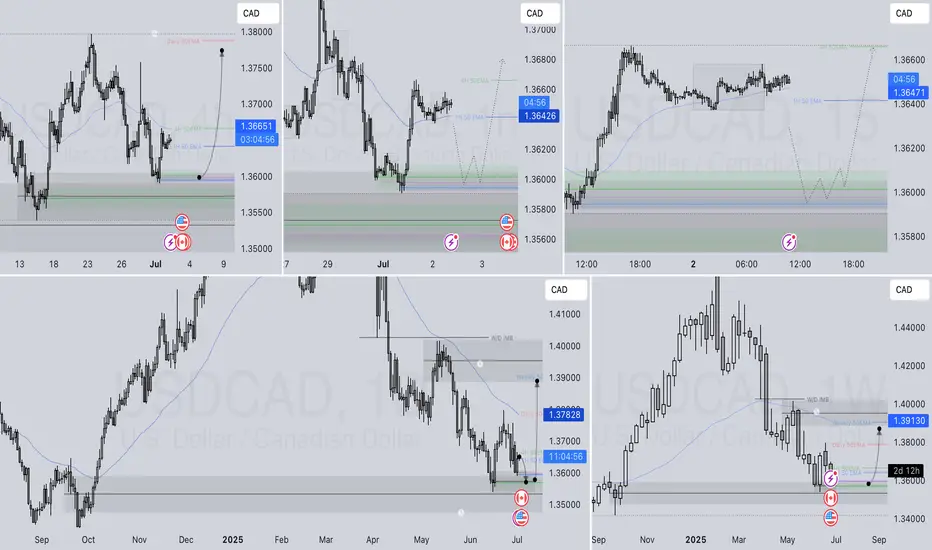
USDCAD LONG DAILY FORECAST Q3 D2 W27 Y25USDCAD LONG DAILY FORECAST Q3 D2 W27 Y25
Professional Risk Managers👋
Welcome back to another FRGNT chart update📈
Diving into some Forex setups using predominantly higher time frame order blocks alongside confirmation breaks of structure.
Let’s see what price action is telling us today! 👀
💡Here are some trade confluences📝
✅Daily Order block identified
✅4H Order Block identified
✅1H Order Block identified
🔑 Remember, to participate in trading comes always with a degree of risk, therefore as professional risk managers it remains vital that we stick to our risk management plan as well as our trading strategies.
📈The rest, we leave to the balance of probabilities.
💡Fail to plan. Plan to fail.
🏆It has always been that simple.
❤️Good luck with your trading journey, I shall see you at the very top.
🎯Trade consistent, FRGNT X
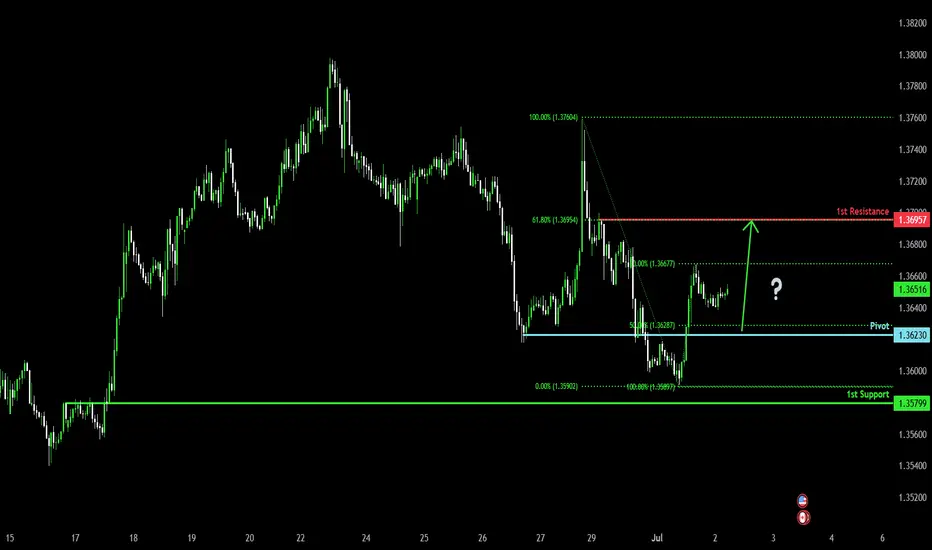
Falling towards 50% Fibonacci support?The Loonie (USD/CAD) is falling towards, the pivot which acts as a pullback support and could bounce to the 61.8% Fibonacci resistance.
Pivot: 1.3623
1st Support: 1.3579
1st Resistance: 1.3695
Risk Warning:
Trading Forex and CFDs carries a high level of risk to your capital and you should only trade with money you can afford to lose. Trading Forex and CFDs may not be suitable for all investors, so please ensure that you fully understand the risks involved and seek independent advice if necessary.
Disclaimer:
The above opinions given constitute general market commentary, and do not constitute the opinion or advice of IC Markets or any form of personal or investment advice.
Any opinions, news, research, analyses, prices, other information, or links to third-party sites contained on this website are provided on an "as-is" basis, are intended only to be informative, is not an advice nor a recommendation, nor research, or a record of our trading prices, or an offer of, or solicitation for a transaction in any financial instrument and thus should not be treated as such. The information provided does not involve any specific investment objectives, financial situation and needs of any specific person who may receive it. Please be aware, that past performance is not a reliable indicator of future performance and/or results. Past Performance or Forward-looking scenarios based upon the reasonable beliefs of the third-party provider are not a guarantee of future performance. Actual results may differ materially from those anticipated in forward-looking or past performance statements. IC Markets makes no representation or warranty and assumes no liability as to the accuracy or completeness of the information provided, nor any loss arising from any investment based on a recommendation, forecast or any information supplied by any third-party.
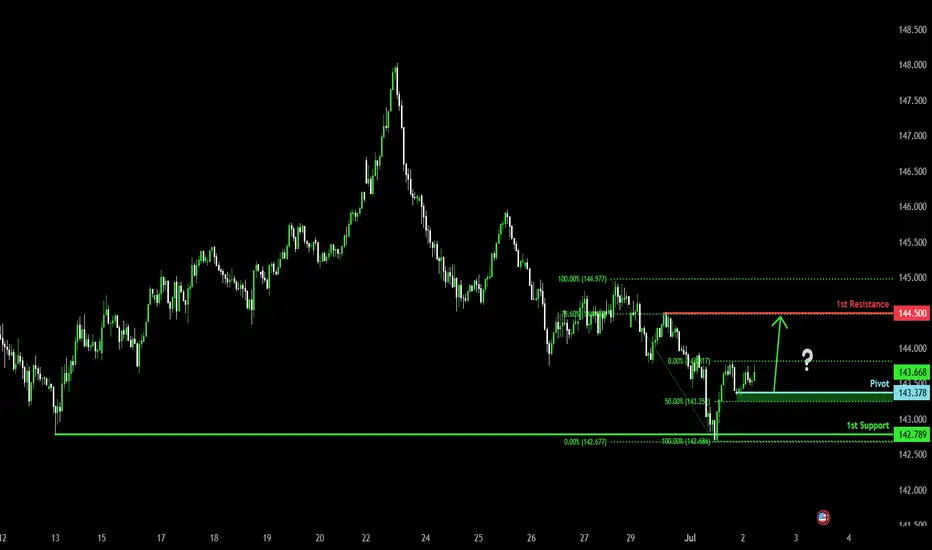
Potential bullish continuation?USD/JPY has bounced off the pivot and could rise to the 1st resistance, which aligns with the 78.6% Fibonacci retracement.
Pivot: 143.37
1st Support: 142.78
1st Resistance: 144.50
Risk Warning:
Trading Forex and CFDs carries a high level of risk to your capital and you should only trade with money you can afford to lose. Trading Forex and CFDs may not be suitable for all investors, so please ensure that you fully understand the risks involved and seek independent advice if necessary.
Disclaimer:
The above opinions given constitute general market commentary, and do not constitute the opinion or advice of IC Markets or any form of personal or investment advice.
Any opinions, news, research, analyses, prices, other information, or links to third-party sites contained on this website are provided on an "as-is" basis, are intended only to be informative, is not an advice nor a recommendation, nor research, or a record of our trading prices, or an offer of, or solicitation for a transaction in any financial instrument and thus should not be treated as such. The information provided does not involve any specific investment objectives, financial situation and needs of any specific person who may receive it. Please be aware, that past performance is not a reliable indicator of future performance and/or results. Past Performance or Forward-looking scenarios based upon the reasonable beliefs of the third-party provider are not a guarantee of future performance. Actual results may differ materially from those anticipated in forward-looking or past performance statements. IC Markets makes no representation or warranty and assumes no liability as to the accuracy or completeness of the information provided, nor any loss arising from any investment based on a recommendation, forecast or any information supplied by any third-party.
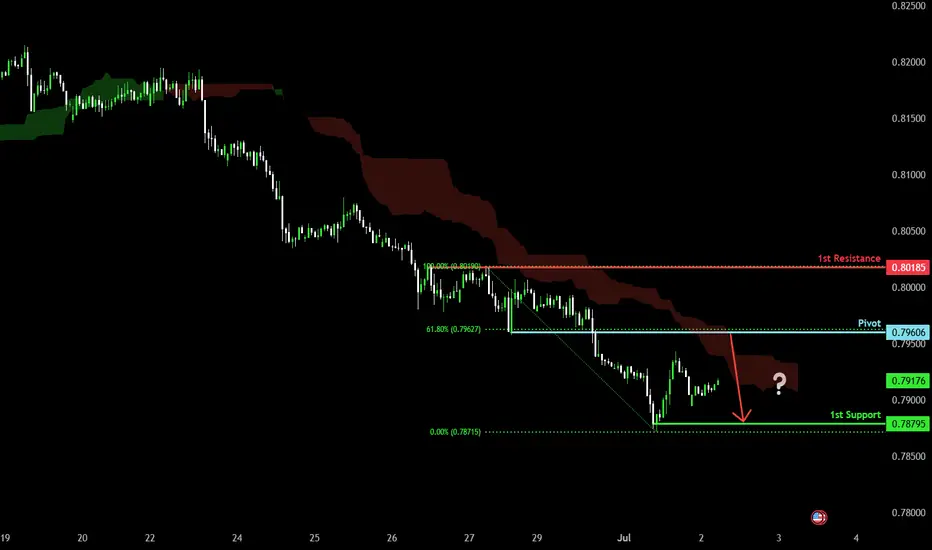
Bearish continuation?The Swissie (USD/CHF) is rising towards the pivot, which has been identified as a pullback resistance and could reverse to the 1st support.
Pivot: 0.7960
1st Support: 0.7879
1st Resistance: 0.8018
Risk Warning:
Trading Forex and CFDs carries a high level of risk to your capital and you should only trade with money you can afford to lose. Trading Forex and CFDs may not be suitable for all investors, so please ensure that you fully understand the risks involved and seek independent advice if necessary.
Disclaimer:
The above opinions given constitute general market commentary, and do not constitute the opinion or advice of IC Markets or any form of personal or investment advice.
Any opinions, news, research, analyses, prices, other information, or links to third-party sites contained on this website are provided on an "as-is" basis, are intended only to be informative, is not an advice nor a recommendation, nor research, or a record of our trading prices, or an offer of, or solicitation for a transaction in any financial instrument and thus should not be treated as such. The information provided does not involve any specific investment objectives, financial situation and needs of any specific person who may receive it. Please be aware, that past performance is not a reliable indicator of future performance and/or results. Past Performance or Forward-looking scenarios based upon the reasonable beliefs of the third-party provider are not a guarantee of future performance. Actual results may differ materially from those anticipated in forward-looking or past performance statements. IC Markets makes no representation or warranty and assumes no liability as to the accuracy or completeness of the information provided, nor any loss arising from any investment based on a recommendation, forecast or any information supplied by any third-party.
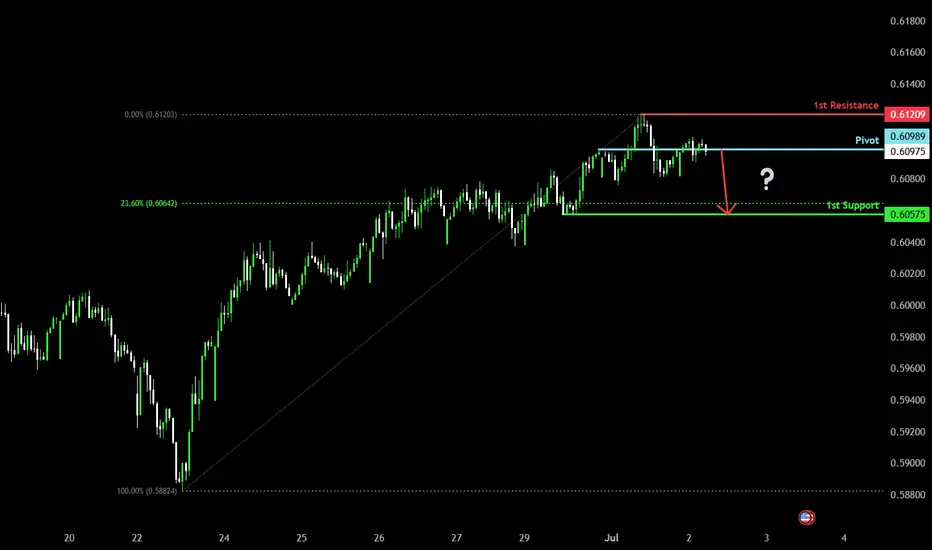
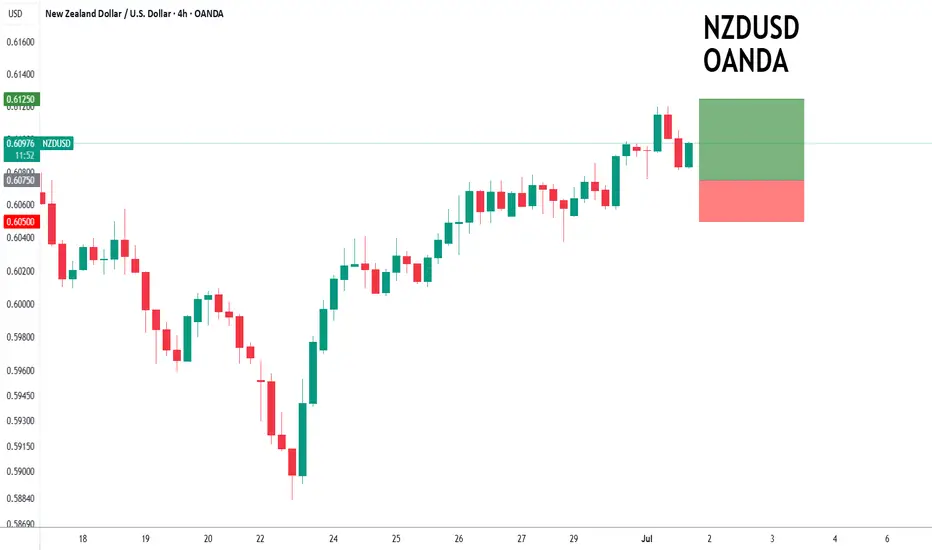
Potential bearish drop?The Kiwi (NZD/USD) is reacting off the pivot which is a pullback resistance and could drop to the 1st support.
Pivot: 0.6098
1st Support: 0.6057
1st Resistance: 0.6120
Risk Warning:
Trading Forex and CFDs carries a high level of risk to your capital and you should only trade with money you can afford to lose. Trading Forex and CFDs may not be suitable for all investors, so please ensure that you fully understand the risks involved and seek independent advice if necessary.
Disclaimer:
The above opinions given constitute general market commentary, and do not constitute the opinion or advice of IC Markets or any form of personal or investment advice.
Any opinions, news, research, analyses, prices, other information, or links to third-party sites contained on this website are provided on an "as-is" basis, are intended only to be informative, is not an advice nor a recommendation, nor research, or a record of our trading prices, or an offer of, or solicitation for a transaction in any financial instrument and thus should not be treated as such. The information provided does not involve any specific investment objectives, financial situation and needs of any specific person who may receive it. Please be aware, that past performance is not a reliable indicator of future performance and/or results. Past Performance or Forward-looking scenarios based upon the reasonable beliefs of the third-party provider are not a guarantee of future performance. Actual results may differ materially from those anticipated in forward-looking or past performance statements. IC Markets makes no representation or warranty and assumes no liability as to the accuracy or completeness of the information provided, nor any loss arising from any investment based on a recommendation, forecast or any information supplied by any third-party.
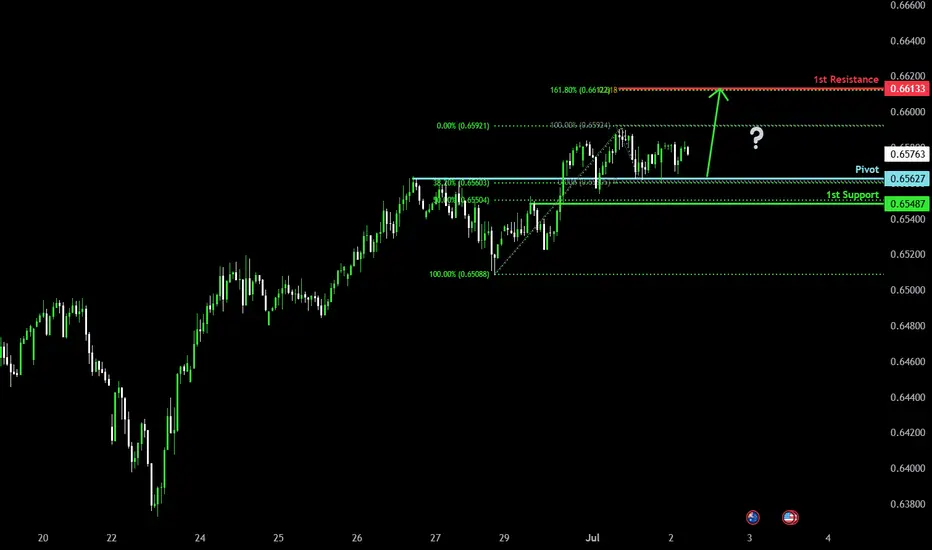
Bullish bounce?The Aussie (AUD/USD) is falling towards the pivot and could bounce to the 1st resistance that aligns with the 161.8% Fibonacci extension and the 61.8% Fibonacci projection.
Pivot: 0.6562
1st Support: 0.6548
1st Resistance: 0.6613
Risk Warning:
Trading Forex and CFDs carries a high level of risk to your capital and you should only trade with money you can afford to lose. Trading Forex and CFDs may not be suitable for all investors, so please ensure that you fully understand the risks involved and seek independent advice if necessary.
Disclaimer:
The above opinions given constitute general market commentary, and do not constitute the opinion or advice of IC Markets or any form of personal or investment advice.
Any opinions, news, research, analyses, prices, other information, or links to third-party sites contained on this website are provided on an "as-is" basis, are intended only to be informative, is not an advice nor a recommendation, nor research, or a record of our trading prices, or an offer of, or solicitation for a transaction in any financial instrument and thus should not be treated as such. The information provided does not involve any specific investment objectives, financial situation and needs of any specific person who may receive it. Please be aware, that past performance is not a reliable indicator of future performance and/or results. Past Performance or Forward-looking scenarios based upon the reasonable beliefs of the third-party provider are not a guarantee of future performance. Actual results may differ materially from those anticipated in forward-looking or past performance statements. IC Markets makes no representation or warranty and assumes no liability as to the accuracy or completeness of the information provided, nor any loss arising from any investment based on a recommendation, forecast or any information supplied by any third-party.
Bearish drop?The Cable (GBP/USD) is reacting off the pivot and could drop to the 1st support.
Pivot: 1.3749
1st Support: 1.3684
1st Resistance: 1.3788
Risk Warning:
Trading Forex and CFDs carries a high level of risk to your capital and you should only trade with money you can afford to lose. Trading Forex and CFDs may not be suitable for all investors, so please ensure that you fully understand the risks involved and seek independent advice if necessary.
Disclaimer:
The above opinions given constitute general market commentary, and do not constitute the opinion or advice of IC Markets or any form of personal or investment advice.
Any opinions, news, research, analyses, prices, other information, or links to third-party sites contained on this website are provided on an "as-is" basis, are intended only to be informative, is not an advice nor a recommendation, nor research, or a record of our trading prices, or an offer of, or solicitation for a transaction in any financial instrument and thus should not be treated as such. The information provided does not involve any specific investment objectives, financial situation and needs of any specific person who may receive it. Please be aware, that past performance is not a reliable indicator of future performance and/or results. Past Performance or Forward-looking scenarios based upon the reasonable beliefs of the third-party provider are not a guarantee of future performance. Actual results may differ materially from those anticipated in forward-looking or past performance statements. IC Markets makes no representation or warranty and assumes no liability as to the accuracy or completeness of the information provided, nor any loss arising from any investment based on a recommendation, forecast or any information supplied by any third-party.

NZDUSD to continue in the upward move?NZDUSD - 24h expiry
There is no clear indication that the upward move is coming to an end.
Although we remain bullish overall, a correction is possible with plenty of room to move lower without impacting the trend higher.
Risk/Reward would be poor to call a buy from current levels.
A move through 0.6100 will confirm the bullish momentum.
The measured move target is 0.6130.
We look to Buy at 0.6075 (stop at 0.6050)
Our profit targets will be 0.6125 and 0.6130
Resistance: 0.6100 / 0.6125 / 0.6130
Support: 0.6075 / 0.6060 / 0.6050
Risk Disclaimer
The trade ideas beyond this page are for informational purposes only and do not constitute investment advice or a solicitation to trade. This information is provided by Signal Centre, a third-party unaffiliated with OANDA, and is intended for general circulation only. OANDA does not guarantee the accuracy of this information and assumes no responsibilities for the information provided by the third party. The information does not take into account the specific investment objectives, financial situation, or particular needs of any particular person. You should take into account your specific investment objectives, financial situation, and particular needs before making a commitment to trade, including seeking advice from an independent financial adviser regarding the suitability of the investment, under a separate engagement, as you deem fit.
You accept that you assume all risks in independently viewing the contents and selecting a chosen strategy.
Where the research is distributed in Singapore to a person who is not an Accredited Investor, Expert Investor or an Institutional Investor, Oanda Asia Pacific Pte Ltd (“OAP“) accepts legal responsibility for the contents of the report to such persons only to the extent required by law. Singapore customers should contact OAP at 6579 8289 for matters arising from, or in connection with, the information/research distributed.
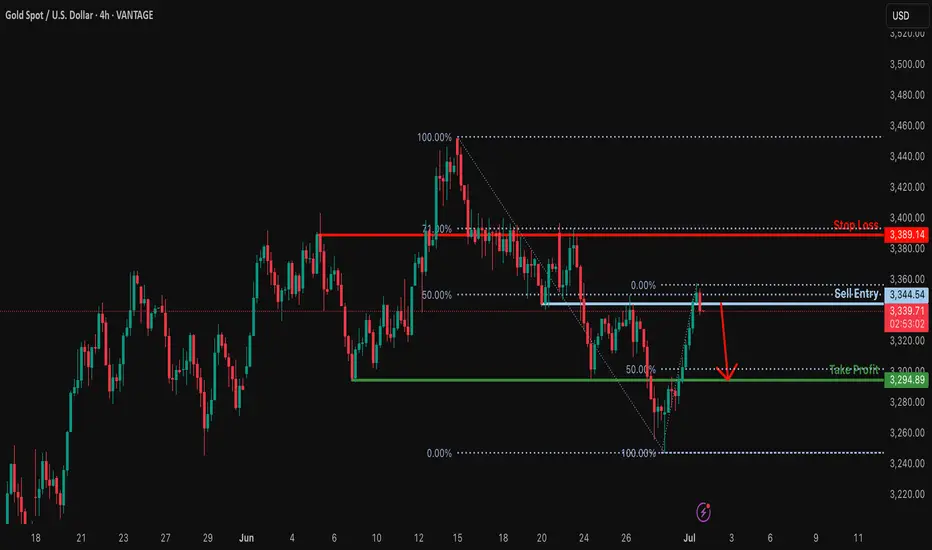
Bearish drop?XAU/USD is reacting off the resistance which is a pullback resistance that lines up with the 50% Fibonacci retracement and could drop from this level to our take profit.
Entry: 3,344.54
Why we like it:
There is a pullback resistance that lines up with the 50% Fibonacci retracement.
Stop loss: 3,389.14
Why we like it:
There is a pullback resistance that lines up with the 71% Fibonacci retracement.
Take prpofit: 3,294.89
Why we like it:
There is a pullback support level that aligns with the 50% Fibonacci retracement.
Enjoying your TradingView experience? Review us!
Please be advised that the information presented on TradingView is provided to Vantage (‘Vantage Global Limited’, ‘we’) by a third-party provider (‘Everest Fortune Group’). Please be reminded that you are solely responsible for the trading decisions on your account. There is a very high degree of risk involved in trading. Any information and/or content is intended entirely for research, educational and informational purposes only and does not constitute investment or consultation advice or investment strategy. The information is not tailored to the investment needs of any specific person and therefore does not involve a consideration of any of the investment objectives, financial situation or needs of any viewer that may receive it. Kindly also note that past performance is not a reliable indicator of future results. Actual results may differ materially from those anticipated in forward-looking or past performance statements. We assume no liability as to the accuracy or completeness of any of the information and/or content provided herein and the Company cannot be held responsible for any omission, mistake nor for any loss or damage including without limitation to any loss of profit which may arise from reliance on any information supplied by Everest Fortune Group.
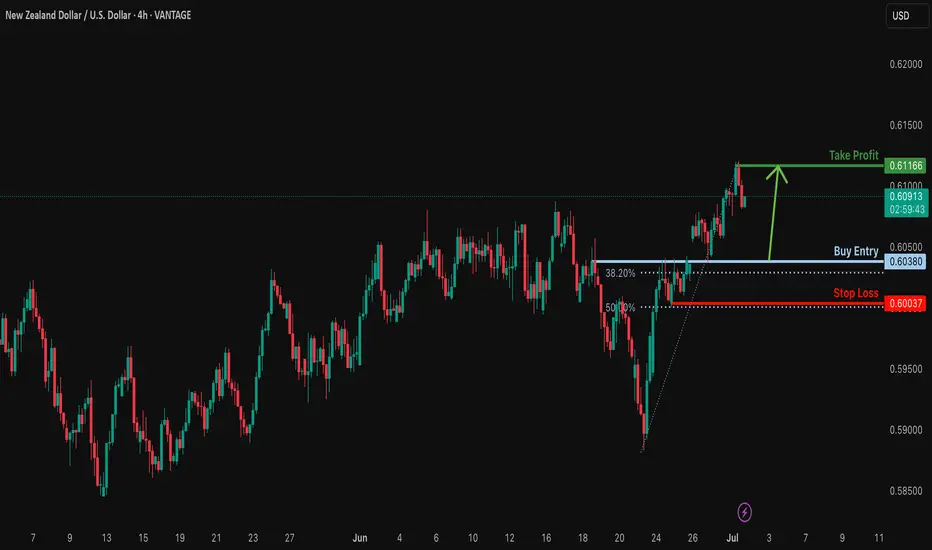
Bullish bounce?NZD/USD is falling towards the support level which is an overlap support that is slightly above the 38.2% Fibonacci retracement and could bounce from this level to our take profit.
Entry: 0.6038
Why we like it:
There is an overlap support that is slightly above the 38.2% Fibonacci retracement.
Stop loss: 0.6038
Why we like it:
There is a pullback support that aligns with the 50% Fibonacci retracement.
Take profit: 0.6116
Why we like it:
There is a pullback resistance.
Enjoying your TradingView experience? Review us!
Please be advised that the information presented on TradingView is provided to Vantage (‘Vantage Global Limited’, ‘we’) by a third-party provider (‘Everest Fortune Group’). Please be reminded that you are solely responsible for the trading decisions on your account. There is a very high degree of risk involved in trading. Any information and/or content is intended entirely for research, educational and informational purposes only and does not constitute investment or consultation advice or investment strategy. The information is not tailored to the investment needs of any specific person and therefore does not involve a consideration of any of the investment objectives, financial situation or needs of any viewer that may receive it. Kindly also note that past performance is not a reliable indicator of future results. Actual results may differ materially from those anticipated in forward-looking or past performance statements. We assume no liability as to the accuracy or completeness of any of the information and/or content provided herein and the Company cannot be held responsible for any omission, mistake nor for any loss or damage including without limitation to any loss of profit which may arise from reliance on any information supplied by Everest Fortune Group.
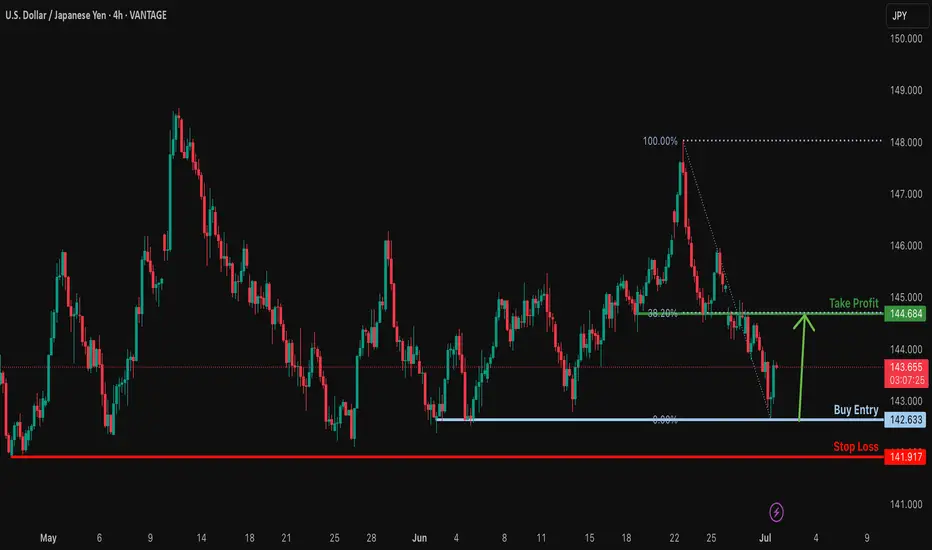
Bullish bounce off pullback support?USD/JPY has bounced off the support level which is a pullback support and could potentially rise from this level to our take profit.
Entry: 142.63
Why we like it:
There is a pullback support.
Stop loss: 141.91
Why we like it:
There is a pullback support.
Take profit: 144.68
Why we like it:
There is an overlap resistance that lines up with the 38.2% Fibonacci retracement.
Enjoying your TradingView experience? Review us!
Please be advised that the information presented on TradingView is provided to Vantage (‘Vantage Global Limited’, ‘we’) by a third-party provider (‘Everest Fortune Group’). Please be reminded that you are solely responsible for the trading decisions on your account. There is a very high degree of risk involved in trading. Any information and/or content is intended entirely for research, educational and informational purposes only and does not constitute investment or consultation advice or investment strategy. The information is not tailored to the investment needs of any specific person and therefore does not involve a consideration of any of the investment objectives, financial situation or needs of any viewer that may receive it. Kindly also note that past performance is not a reliable indicator of future results. Actual results may differ materially from those anticipated in forward-looking or past performance statements. We assume no liability as to the accuracy or completeness of any of the information and/or content provided herein and the Company cannot be held responsible for any omission, mistake nor for any loss or damage including without limitation to any loss of profit which may arise from reliance on any information supplied by Everest Fortune Group.
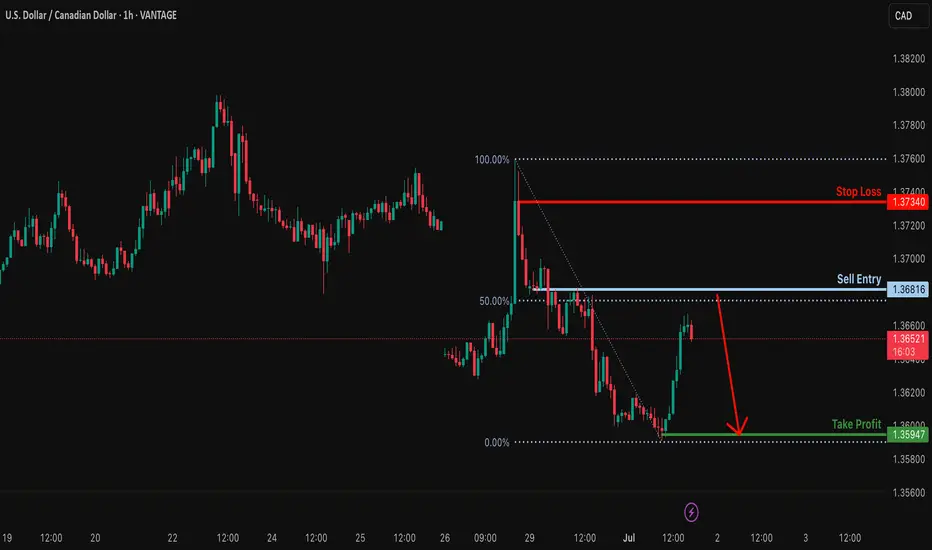
Heading into 50% Fibonacci resistance?USD/CAD is rising towards the resistance level which is a pullback resistance that lines up with the 50% Fibonacci retracement and could drop from this level to our take profit.
Entry: 1.3681
Why we like it:
There is a pullback resistance that aligns with the 50% Fibonacci retracement.
Stop loss: 1.3734
Why we like it:
There is a pullback resistance.
Take profit: 1.3594
Why we like it:
There is a pullback support.
Enjoying your TradingView experience? Review us!
Please be advised that the information presented on TradingView is provided to Vantage (‘Vantage Global Limited’, ‘we’) by a third-party provider (‘Everest Fortune Group’). Please be reminded that you are solely responsible for the trading decisions on your account. There is a very high degree of risk involved in trading. Any information and/or content is intended entirely for research, educational and informational purposes only and does not constitute investment or consultation advice or investment strategy. The information is not tailored to the investment needs of any specific person and therefore does not involve a consideration of any of the investment objectives, financial situation or needs of any viewer that may receive it. Kindly also note that past performance is not a reliable indicator of future results. Actual results may differ materially from those anticipated in forward-looking or past performance statements. We assume no liability as to the accuracy or completeness of any of the information and/or content provided herein and the Company cannot be held responsible for any omission, mistake nor for any loss or damage including without limitation to any loss of profit which may arise from reliance on any information supplied by Everest Fortune Group.
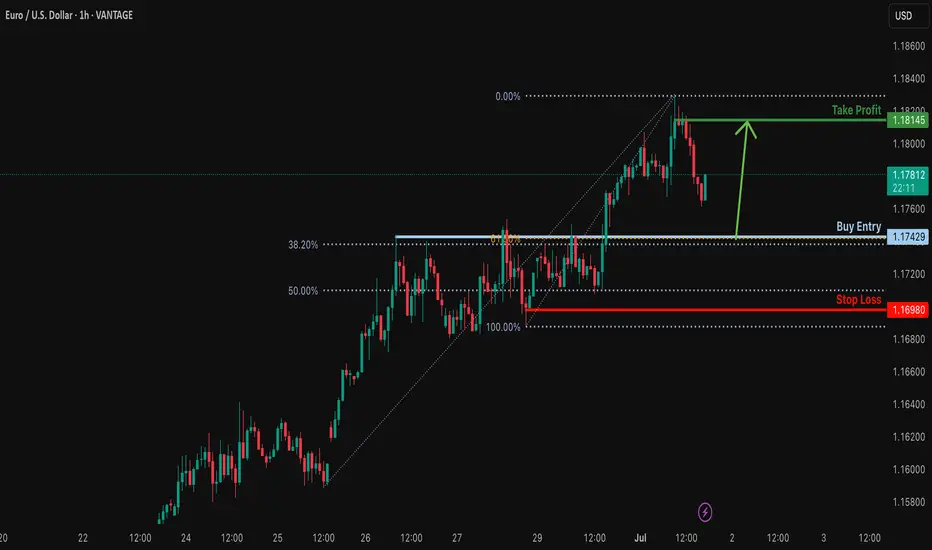
Bullish bounce off pullback support?EUR/USD is falling towards the support level which is a pullback support that aligns with the 38.2% and the 61.8% Fibonacci retracement and could bounce from this level to our take profit.
Entry: 1.1742
Why we like it:
There is a pullback support level that lines up with the 38.2% and the 61.8% Fibonacci retracement.
Stop loss: 1.1698
Why we like it:
There is a pullback support that is slightly below the 50% Fibonacci retracement.
Take profit: 1.1814
Why we like it:
There is a pullback resistance.
Enjoying your TradingView experience? Review us!
Please be advised that the information presented on TradingView is provided to Vantage (‘Vantage Global Limited’, ‘we’) by a third-party provider (‘Everest Fortune Group’). Please be reminded that you are solely responsible for the trading decisions on your account. There is a very high degree of risk involved in trading. Any information and/or content is intended entirely for research, educational and informational purposes only and does not constitute investment or consultation advice or investment strategy. The information is not tailored to the investment needs of any specific person and therefore does not involve a consideration of any of the investment objectives, financial situation or needs of any viewer that may receive it. Kindly also note that past performance is not a reliable indicator of future results. Actual results may differ materially from those anticipated in forward-looking or past performance statements. We assume no liability as to the accuracy or completeness of any of the information and/or content provided herein and the Company cannot be held responsible for any omission, mistake nor for any loss or damage including without limitation to any loss of profit which may arise from reliance on any information supplied by Everest Fortune Group.
EURUSD Potential UpsidesHey Traders, in today's trading session we are monitoring EURUSD for a buying opportunity around 1.17600 zone, EURUSD is trading in an uptrend and currently is in a correction phase in which it is approaching the trend at 1.17600 support and resistance area.
Trade safe, Joe.
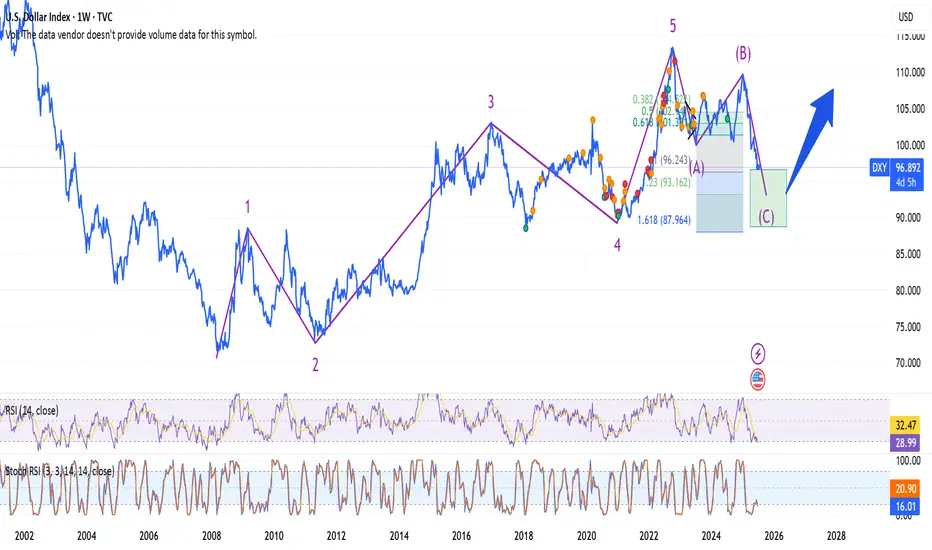
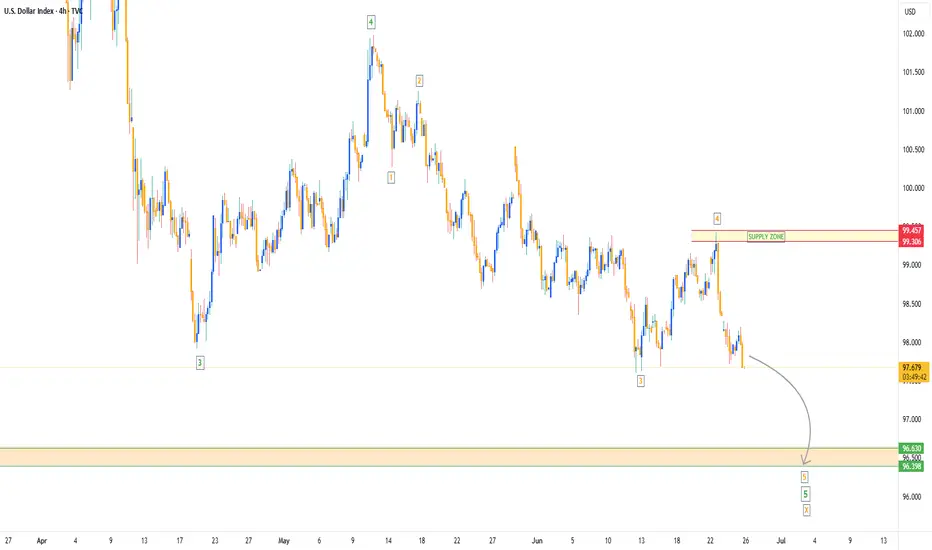
Dollar Index Bearish to $96The DXY has been in a downtrend for a while & that bearish pressure is not over yet. I expect more bearish downside towards the $96 zone, before we can re-analyse the market for any signs of bullish takeover.
⭕️Major Wave 3 Impulse Move Complete.
⭕️Major Wave 4 Corrective Move Complete.
⭕️Minor 4 Waves of Major Wave 5 Complete, With Minor Wave 5 Yet Pending.
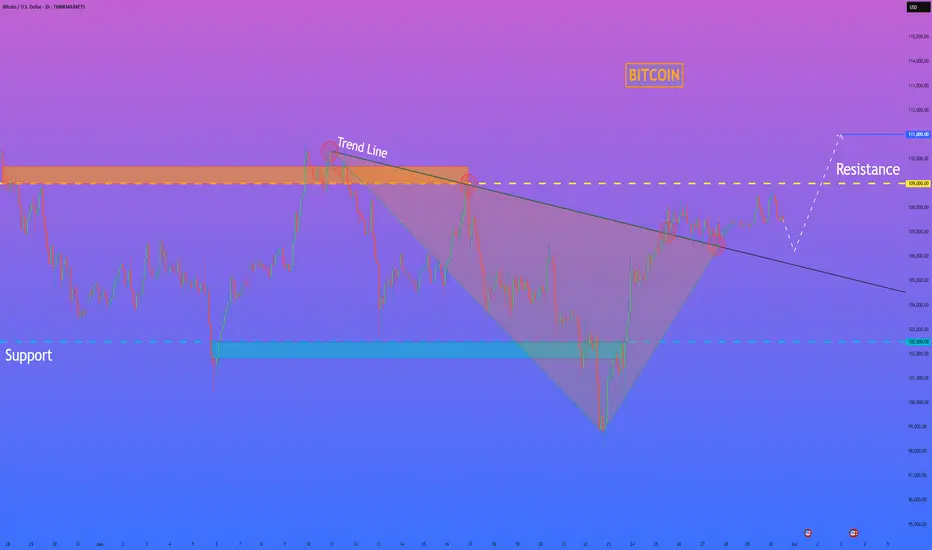
HelenP. I Bitcoin may continue grow and break resistance levelHi folks today I'm prepared for you Bitcoin analytics. After looking at this chart, we can see how the price broke the resistance level, which coincided with the resistance zone, and continued to move down next. When the price almost reached the support level, it turned around and tried to grow, but failed and dropped to the support zone. After this movement, BTC turned around and made an impulse up to the resistance zone, breaking the resistance level one more time. Then it reached the trend line and started to decline in a broadening wedge, where it broke the resistance level again. Later, the price even declined below the support level, breaking this level too and falling to the support line of the wedge pattern. Next, price turned around and made a strong impulse up to the resistance level, thereby breaking the support level with the trend line, exiting from the broadening wedge too. Bitcoin made a retest of the trend line and then continued to grow. In my opinion, BTCUSD will correct to almost to trend line and then rise to the resistance level. Then it can break this level and continue to move up; therefore, I set my goal at 111000 points. If you like my analytics you may support me with your like/comment ❤️
Disclaimer: As part of ThinkMarkets’ Influencer Program, I am sponsored to share and publish their charts in my analysis.
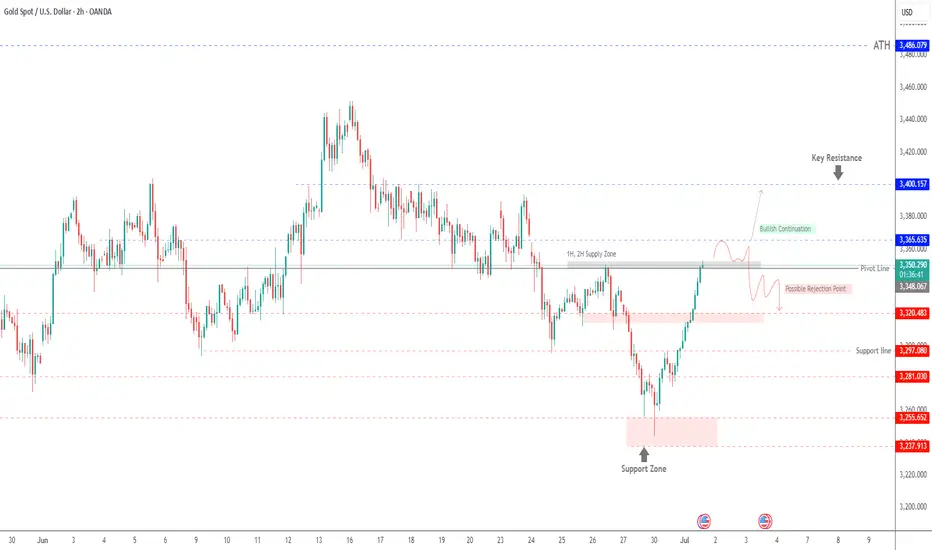
XAU/USD – Testing 2H/1H Supply Zone | Breakout or Rejection?XAU/USD – Testing 1H/2H Supply Zone | Bullish Continuation or Rejection Ahead
Gold has rallied strongly from the support zone around 3,238–3,255, breaking multiple intraday resistance levels and now approaching a critical 1H/2H Supply Zone near 3,348–3,366.
This area previously acted as a strong sell-off zone, making it a key decision point.
Scenario 1: Bullish Continuation
If price breaks and closes above 3,366 with momentum, we could see further upside toward the next resistance at 3,400 and possibly retest the ATH zone at 3,486. A short consolidation or retest within the zone would confirm strength.
Scenario 2: Rejection from Supply Zone
If the supply holds, a rejection from the zone could lead to a pullback toward:
3,320.48 (minor support)
3,297.08 (support line)
Or deeper retracement to the 3,255–3,238 support zone
Key Technical Levels
Supply Zone: 3,348 – 3,366
Resistance: 3,400 – 3,486 (ATH)
Support Levels: 3,320 – 3,297 – 3,255 – 3,238
Pivot Line: 3,348
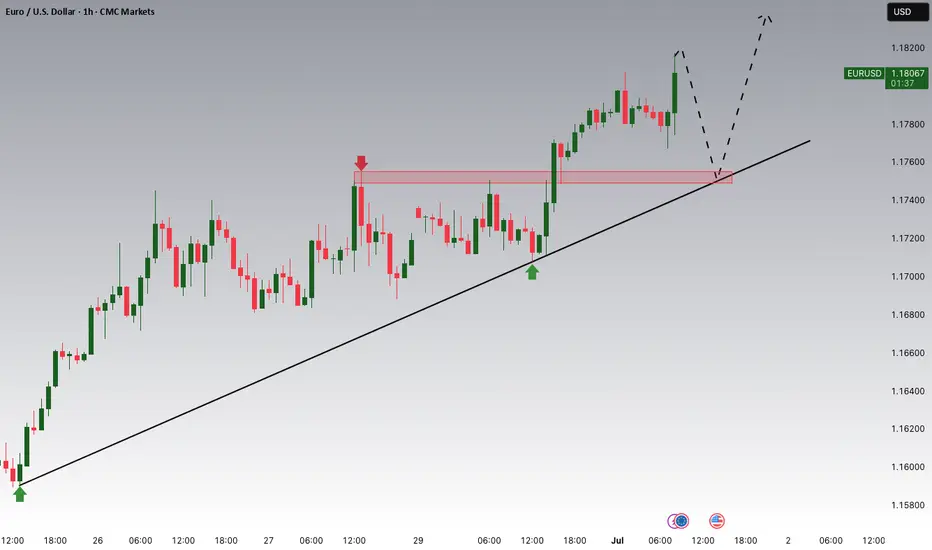
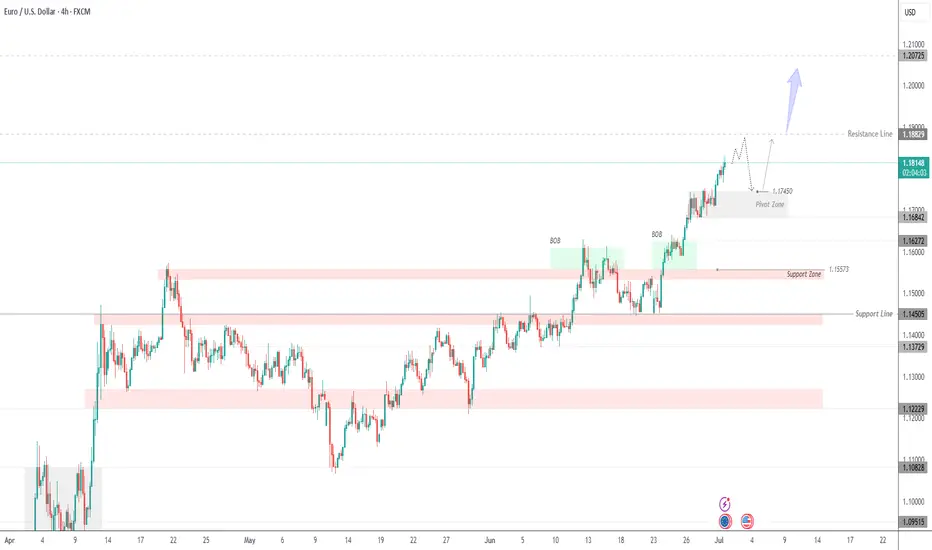
Euro Continues Bullish Trend | Eyes on 1.1882 & 1.2075EUR/USD – Strong Bullish Structure | Watching 1.1745 Pivot Zone for Reentry
The Euro continues to trade in a well-defined bullish trend, supported by institutional demand and clear price structure.
After breaking above the 1.1684 resistance zone, EUR/USD extended toward 1.1818 and now approaches the next resistance at 1.1882. This level may act as a temporary cap, but if breached with momentum, the pair could target the 1.2075 zone next.
Bullish Order Blocks (BOBs) marked on the chart highlight previous accumulation zones where buyers stepped in aggressively. These areas are still valid for demand-based pullbacks.
Key Area to Watch – 1.1745 Pivot Zone:
This level serves as a potential reentry point if the price retraces. As long as EUR/USD holds above this zone, bullish momentum remains intact. A confirmed bounce here could resume the uptrend toward 1.1882 and beyond.
However, a clean break below 1.1745 could open the door for a deeper correction toward 1.1627 or even 1.1557, which is the next major support zone.
Key Levels:
Resistance: 1.1882, 1.2075
Pivot Zone: 1.1745
Support: 1.1627, 1.1557
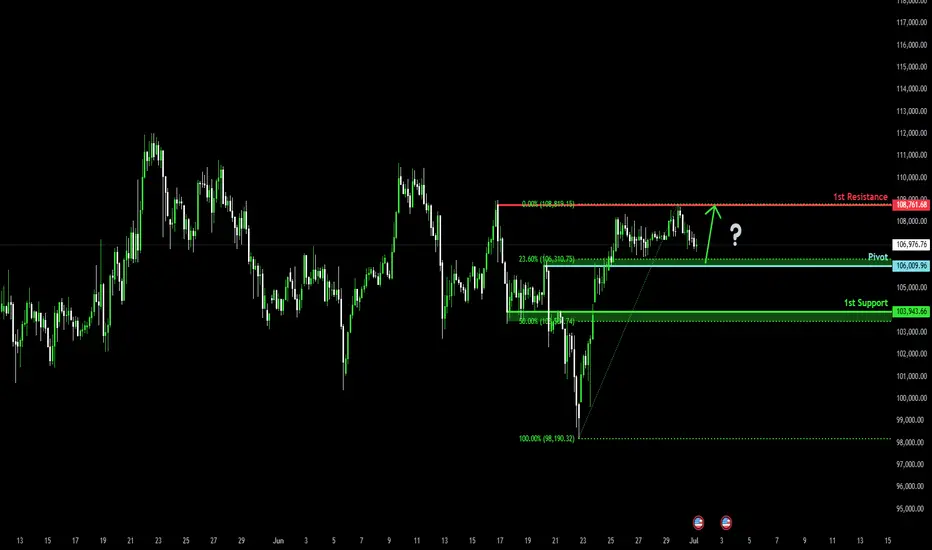
Bullish bounce?The Bitcoin (BTC/USD) is falling towards the pivot which acts as a pullback support and could bounce to the 1st resistance.
Pivot: 106,009.96
1st Support: 103.943.66
1st Resistance: 108,761.68
Risk Warning:
Trading Forex and CFDs carries a high level of risk to your capital and you should only trade with money you can afford to lose. Trading Forex and CFDs may not be suitable for all investors, so please ensure that you fully understand the risks involved and seek independent advice if necessary.
Disclaimer:
The above opinions given constitute general market commentary, and do not constitute the opinion or advice of IC Markets or any form of personal or investment advice.
Any opinions, news, research, analyses, prices, other information, or links to third-party sites contained on this website are provided on an "as-is" basis, are intended only to be informative, is not an advice nor a recommendation, nor research, or a record of our trading prices, or an offer of, or solicitation for a transaction in any financial instrument and thus should not be treated as such. The information provided does not involve any specific investment objectives, financial situation and needs of any specific person who may receive it. Please be aware, that past performance is not a reliable indicator of future performance and/or results. Past Performance or Forward-looking scenarios based upon the reasonable beliefs of the third-party provider are not a guarantee of future performance. Actual results may differ materially from those anticipated in forward-looking or past performance statements. IC Markets makes no representation or warranty and assumes no liability as to the accuracy or completeness of the information provided, nor any loss arising from any investment based on a recommendation, forecast or any information supplied by any third-party.
USD/JPY Bearish Flag (30.06.2025)The USD/JPY Pair on the M30 timeframe presents a Potential Selling Opportunity due to a recent Formation of a Bearish Flag Breakout Pattern. This suggests a shift in momentum towards the downside in the coming hours.
Possible Short Trade:
Entry: Consider Entering A Short Position around Trendline Of The Pattern.
Target Levels:
1st Support – 143.40
2nd Support – 142.86
🎁 Please hit the like button and
🎁 Leave a comment to support for My Post !
Your likes and comments are incredibly motivating and will encourage me to share more analysis with you.
Best Regards, KABHI_TA_TRADING
Thank you.
Disclosure: I am part of Trade Nation's Influencer program and receive a monthly fee for using their TradingView charts in my analysis.

DXY USD Dollar Bearish Short term, then bullishI am not a financial advisor. This is not meant to be and does not constitute financial, investment, trading, or any other types of advice or recommendation.