EURUSD Testing Patience – Bearish Trend Not Over YetEURUSD – Overview
EURUSD continues to trade under pressure amid bearish momentum, respecting key technical levels.
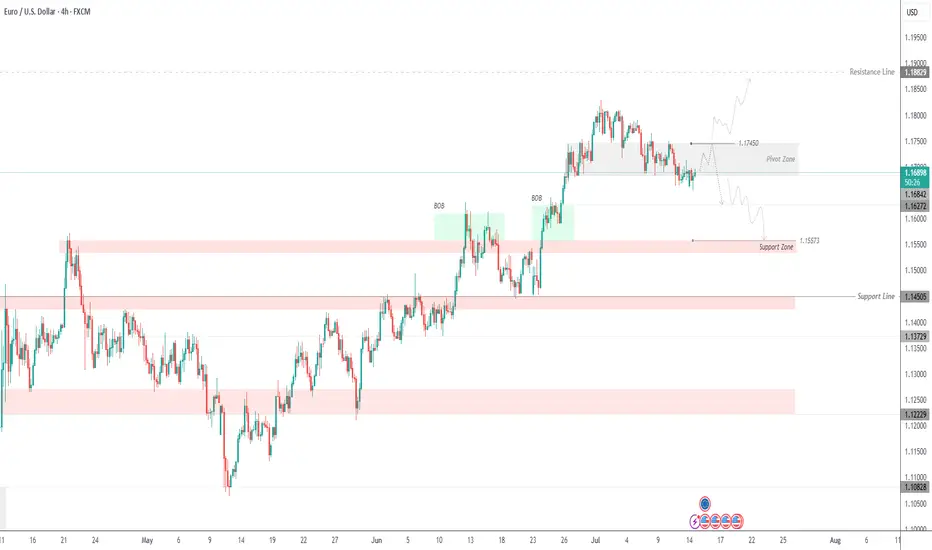
The price maintains bearish momentum as long as it trades below 1.1745, with downside targets at 1.1627 and 1.1557.
A retest of 1.1745 is possible and considered normal in this structure. However, if the price stabilizes below 1.1684, it will likely continue dropping toward the support targets.
To shift back to a bullish bias, the pair must break and hold above 1.1745.
Pivot Line: 1.1695
Support Levels: 1.1627 – 1.1557
Resistance Levels: 1.1745 – 1.1810
previous idea:
J-USD
Gold Bullish Above 3342 – Watching 3365 BreakoutGold Futures Rise on Trade & Geopolitical Tensions
Gold continues to gain as renewed tariff threats from the U.S. and rising geopolitical risks weigh on market sentiment.
While markets have become somewhat desensitized to Trump’s recurring trade rhetoric, concerns remain that resolutions may be delayed.
Technical Outlook:
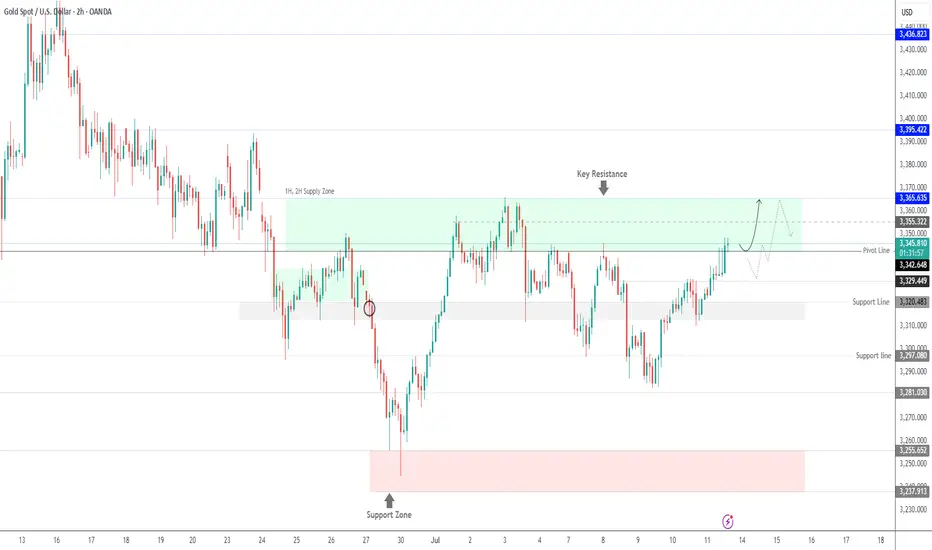
As long as the price holds above 3342, the bullish trend is likely to continue toward 3355 and 3365.
A stable close above 3365 would open the way to 3395.
However, a 1H close below 3342 may trigger a pullback to 3329.
Pivot: 3342
Resistance: 3355, 3365, 3395
Support: 3329, 3319, 3309
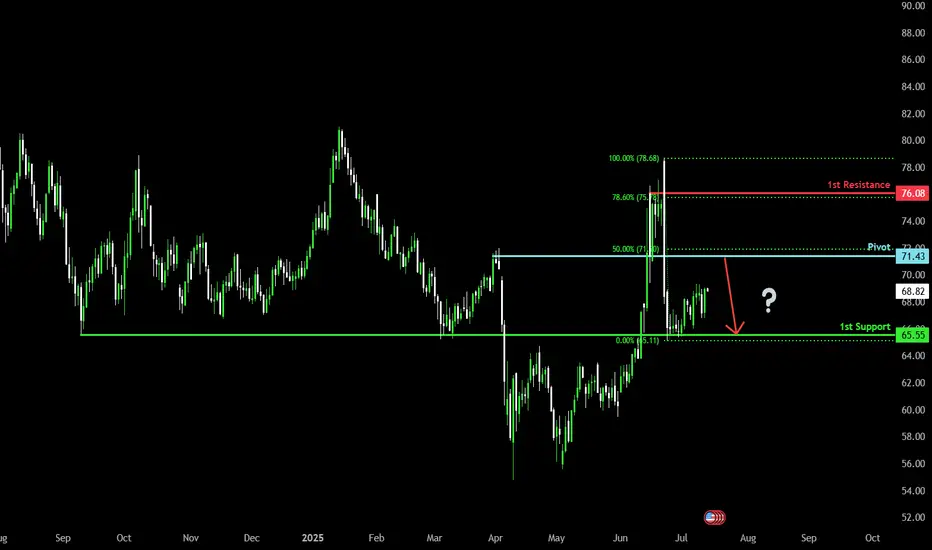
Heading into 50% Fibonacci resitance?WTI Oil (XTI/USD) is rising towards the pivot and could reverse to the 1st support.
Pivot: 71.43
1st Support: 65.55
1st Resistance: 76.08
Risk Warning:
Trading Forex and CFDs carries a high level of risk to your capital and you should only trade with money you can afford to lose. Trading Forex and CFDs may not be suitable for all investors, so please ensure that you fully understand the risks involved and seek independent advice if necessary.
Disclaimer:
The above opinions given constitute general market commentary, and do not constitute the opinion or advice of IC Markets or any form of personal or investment advice.
Any opinions, news, research, analyses, prices, other information, or links to third-party sites contained on this website are provided on an "as-is" basis, are intended only to be informative, is not an advice nor a recommendation, nor research, or a record of our trading prices, or an offer of, or solicitation for a transaction in any financial instrument and thus should not be treated as such. The information provided does not involve any specific investment objectives, financial situation and needs of any specific person who may receive it. Please be aware, that past performance is not a reliable indicator of future performance and/or results. Past Performance or Forward-looking scenarios based upon the reasonable beliefs of the third-party provider are not a guarantee of future performance. Actual results may differ materially from those anticipated in forward-looking or past performance statements. IC Markets makes no representation or warranty and assumes no liability as to the accuracy or completeness of the information provided, nor any loss arising from any investment based on a recommendation, forecast or any information supplied by any third-party.
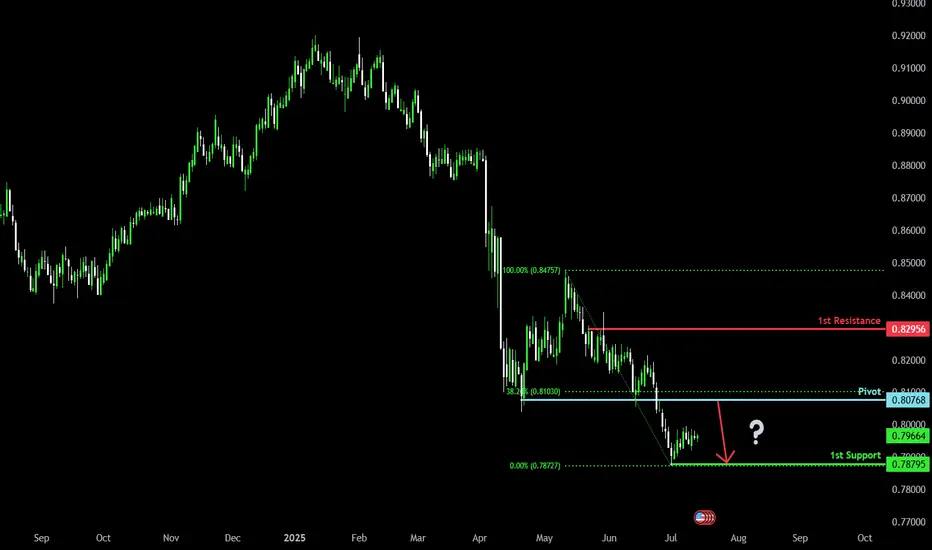
Bearish reversal off pullback resistance?The Swissie (USD/CHF) is rising towards the pivot, which is a pullback resistance that lines up with the 38.2% Fibonacci retracement and could reverse to the 1st support.
Pivot: 0.8076
1st Support: 0.7879
1st Resistance: 0.8295
Risk Warning:
Trading Forex and CFDs carries a high level of risk to your capital and you should only trade with money you can afford to lose. Trading Forex and CFDs may not be suitable for all investors, so please ensure that you fully understand the risks involved and seek independent advice if necessary.
Disclaimer:
The above opinions given constitute general market commentary, and do not constitute the opinion or advice of IC Markets or any form of personal or investment advice.
Any opinions, news, research, analyses, prices, other information, or links to third-party sites contained on this website are provided on an "as-is" basis, are intended only to be informative, is not an advice nor a recommendation, nor research, or a record of our trading prices, or an offer of, or solicitation for a transaction in any financial instrument and thus should not be treated as such. The information provided does not involve any specific investment objectives, financial situation and needs of any specific person who may receive it. Please be aware, that past performance is not a reliable indicator of future performance and/or results. Past Performance or Forward-looking scenarios based upon the reasonable beliefs of the third-party provider are not a guarantee of future performance. Actual results may differ materially from those anticipated in forward-looking or past performance statements. IC Markets makes no representation or warranty and assumes no liability as to the accuracy or completeness of the information provided, nor any loss arising from any investment based on a recommendation, forecast or any information supplied by any third-party.
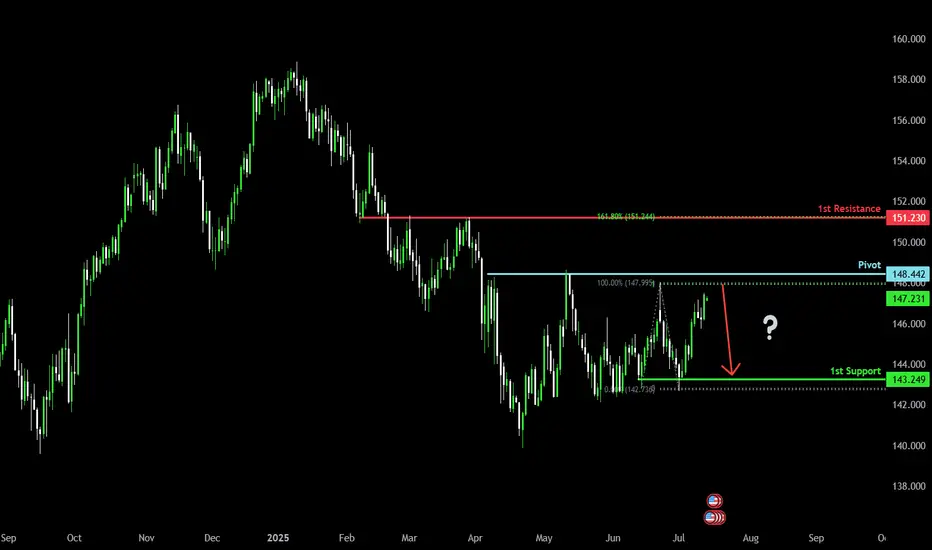
Heading into pullback resistance?The USD/JPY is rising towards the pivot, which is a pullback resistance and could reverse to the 1st support.
Pivot: 148.44
1st Support: 143.24
1st Resistance: 151.23
Risk Warning:
Trading Forex and CFDs carries a high level of risk to your capital and you should only trade with money you can afford to lose. Trading Forex and CFDs may not be suitable for all investors, so please ensure that you fully understand the risks involved and seek independent advice if necessary.
Disclaimer:
The above opinions given constitute general market commentary, and do not constitute the opinion or advice of IC Markets or any form of personal or investment advice.
Any opinions, news, research, analyses, prices, other information, or links to third-party sites contained on this website are provided on an "as-is" basis, are intended only to be informative, is not an advice nor a recommendation, nor research, or a record of our trading prices, or an offer of, or solicitation for a transaction in any financial instrument and thus should not be treated as such. The information provided does not involve any specific investment objectives, financial situation and needs of any specific person who may receive it. Please be aware, that past performance is not a reliable indicator of future performance and/or results. Past Performance or Forward-looking scenarios based upon the reasonable beliefs of the third-party provider are not a guarantee of future performance. Actual results may differ materially from those anticipated in forward-looking or past performance statements. IC Markets makes no representation or warranty and assumes no liability as to the accuracy or completeness of the information provided, nor any loss arising from any investment based on a recommendation, forecast or any information supplied by any third-party.
Bullish bounce off overlap support?The Cable (GBP/USD) is falling towards the pivot and could bounce to the 1st resistance which acts as a pullback resistance.
Pivot: 1.3375
1st Support: 1.3126
1st Resistance: 1.3758
Risk Warning:
Trading Forex and CFDs carries a high level of risk to your capital and you should only trade with money you can afford to lose. Trading Forex and CFDs may not be suitable for all investors, so please ensure that you fully understand the risks involved and seek independent advice if necessary.
Disclaimer:
The above opinions given constitute general market commentary, and do not constitute the opinion or advice of IC Markets or any form of personal or investment advice.
Any opinions, news, research, analyses, prices, other information, or links to third-party sites contained on this website are provided on an "as-is" basis, are intended only to be informative, is not an advice nor a recommendation, nor research, or a record of our trading prices, or an offer of, or solicitation for a transaction in any financial instrument and thus should not be treated as such. The information provided does not involve any specific investment objectives, financial situation and needs of any specific person who may receive it. Please be aware, that past performance is not a reliable indicator of future performance and/or results. Past Performance or Forward-looking scenarios based upon the reasonable beliefs of the third-party provider are not a guarantee of future performance. Actual results may differ materially from those anticipated in forward-looking or past performance statements. IC Markets makes no representation or warranty and assumes no liability as to the accuracy or completeness of the information provided, nor any loss arising from any investment based on a recommendation, forecast or any information supplied by any third-party.

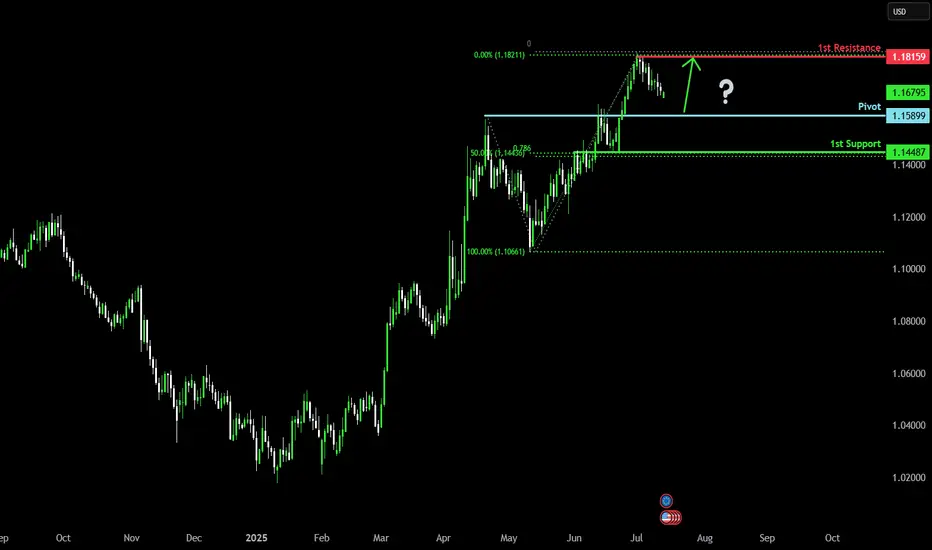
Bullish continuation?The Fiber (EUR/USD) is falling towards the pivot, which has been identified as a pullback support and could bounce to the 1st resistance.
Pivot: 1.1589
1st Support: 1.1448
1st Resistance: 1.1815
Risk Warning:
Trading Forex and CFDs carries a high level of risk to your capital and you should only trade with money you can afford to lose. Trading Forex and CFDs may not be suitable for all investors, so please ensure that you fully understand the risks involved and seek independent advice if necessary.
Disclaimer:
The above opinions given constitute general market commentary, and do not constitute the opinion or advice of IC Markets or any form of personal or investment advice.
Any opinions, news, research, analyses, prices, other information, or links to third-party sites contained on this website are provided on an "as-is" basis, are intended only to be informative, is not an advice nor a recommendation, nor research, or a record of our trading prices, or an offer of, or solicitation for a transaction in any financial instrument and thus should not be treated as such. The information provided does not involve any specific investment objectives, financial situation and needs of any specific person who may receive it. Please be aware, that past performance is not a reliable indicator of future performance and/or results. Past Performance or Forward-looking scenarios based upon the reasonable beliefs of the third-party provider are not a guarantee of future performance. Actual results may differ materially from those anticipated in forward-looking or past performance statements. IC Markets makes no representation or warranty and assumes no liability as to the accuracy or completeness of the information provided, nor any loss arising from any investment based on a recommendation, forecast or any information supplied by any third-party.
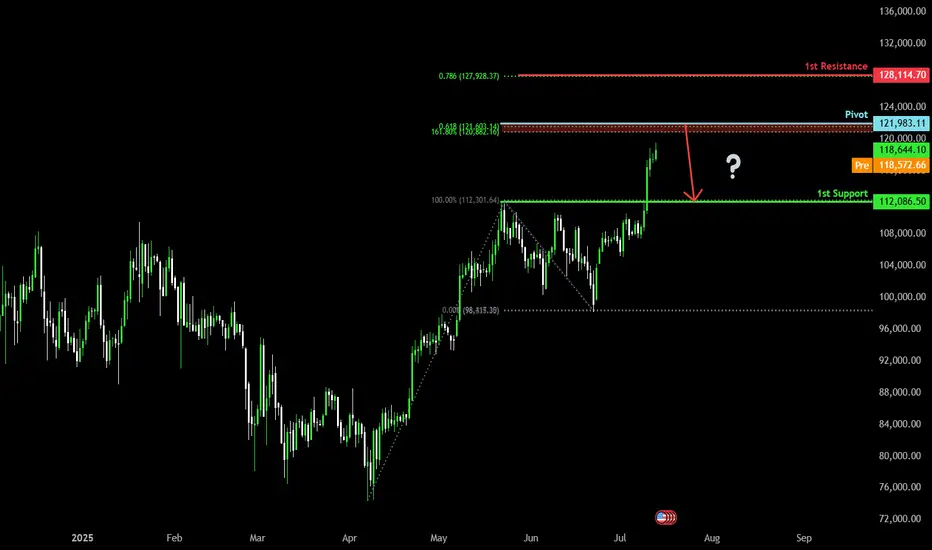
Bearish reversal off Fibonacci confluence?The Bitcoin (BTC/USD) is rising towards the pivot and could reverse to the 1st support which is a pullback support.
Pivot: 121,983.11
1st Support: 112,086.50
1st Resistance: 128,114.70
Risk Warning:
Trading Forex and CFDs carries a high level of risk to your capital and you should only trade with money you can afford to lose. Trading Forex and CFDs may not be suitable for all investors, so please ensure that you fully understand the risks involved and seek independent advice if necessary.
Disclaimer:
The above opinions given constitute general market commentary, and do not constitute the opinion or advice of IC Markets or any form of personal or investment advice.
Any opinions, news, research, analyses, prices, other information, or links to third-party sites contained on this website are provided on an "as-is" basis, are intended only to be informative, is not an advice nor a recommendation, nor research, or a record of our trading prices, or an offer of, or solicitation for a transaction in any financial instrument and thus should not be treated as such. The information provided does not involve any specific investment objectives, financial situation and needs of any specific person who may receive it. Please be aware, that past performance is not a reliable indicator of future performance and/or results. Past Performance or Forward-looking scenarios based upon the reasonable beliefs of the third-party provider are not a guarantee of future performance. Actual results may differ materially from those anticipated in forward-looking or past performance statements. IC Markets makes no representation or warranty and assumes no liability as to the accuracy or completeness of the information provided, nor any loss arising from any investment based on a recommendation, forecast or any information supplied by any third-party.
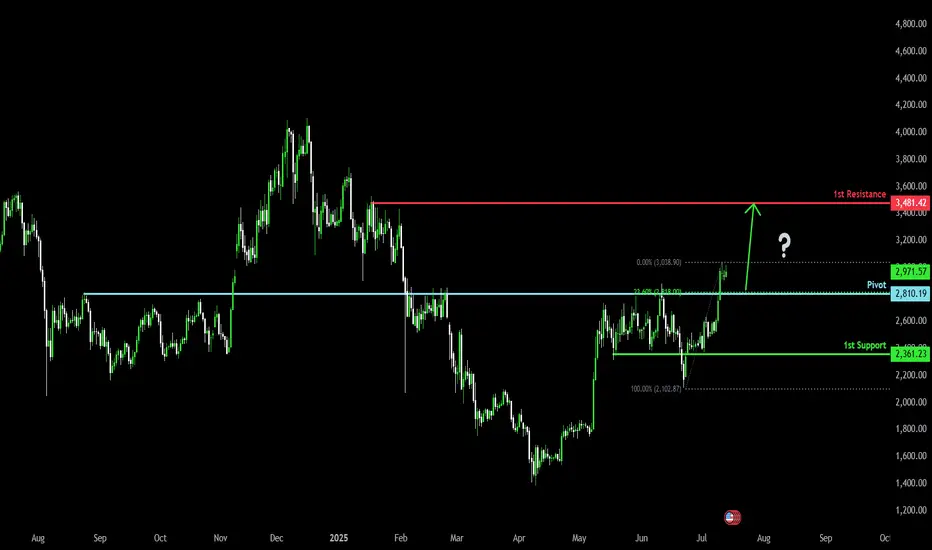
Bullish bounce?Ethereum (ETH/USD) is falling towards the pivot and could bounce to the 1st resistance.
Pivot: 2,810.19
1st Support: 2,361.23
1st Resistance: 3,481.42
Risk Warning:
Trading Forex and CFDs carries a high level of risk to your capital and you should only trade with money you can afford to lose. Trading Forex and CFDs may not be suitable for all investors, so please ensure that you fully understand the risks involved and seek independent advice if necessary.
Disclaimer:
The above opinions given constitute general market commentary, and do not constitute the opinion or advice of IC Markets or any form of personal or investment advice.
Any opinions, news, research, analyses, prices, other information, or links to third-party sites contained on this website are provided on an "as-is" basis, are intended only to be informative, is not an advice nor a recommendation, nor research, or a record of our trading prices, or an offer of, or solicitation for a transaction in any financial instrument and thus should not be treated as such. The information provided does not involve any specific investment objectives, financial situation and needs of any specific person who may receive it. Please be aware, that past performance is not a reliable indicator of future performance and/or results. Past Performance or Forward-looking scenarios based upon the reasonable beliefs of the third-party provider are not a guarantee of future performance. Actual results may differ materially from those anticipated in forward-looking or past performance statements. IC Markets makes no representation or warranty and assumes no liability as to the accuracy or completeness of the information provided, nor any loss arising from any investment based on a recommendation, forecast or any information supplied by any third-party.
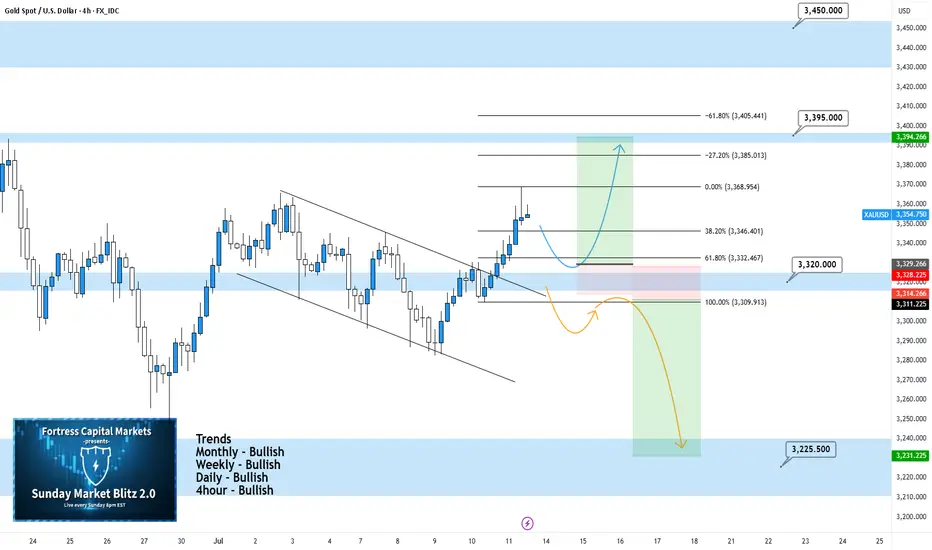
XAUUSD 4Hour TF - July 13th, 2025XAUUSD 7/13/2025
XAUUSD 4 hour Long Idea
Monthly - Bullish
Weekly - Bullish
Daily - Bullish
4hour - Bullish
Gold is looking pretty bullish this week as we saw a significant push above our 3,320.000 resistance zone. Looking to ride that same trend through this next week.
Bullish continuation - After a nice rally last week gold looks primed for another long setup. Ideally, price action goes for the retest of 3,320.000 and forms a higher low. This would confirm bullish structure and we can begin targeting higher toward major levels of resistance.
Bearish Reversal - For us to consider bearish setups we would first need to see a break back below 3,320.000 followed by a confirmed lower high. If this happens we can consider short positions and look to target lower toward major levels of support.
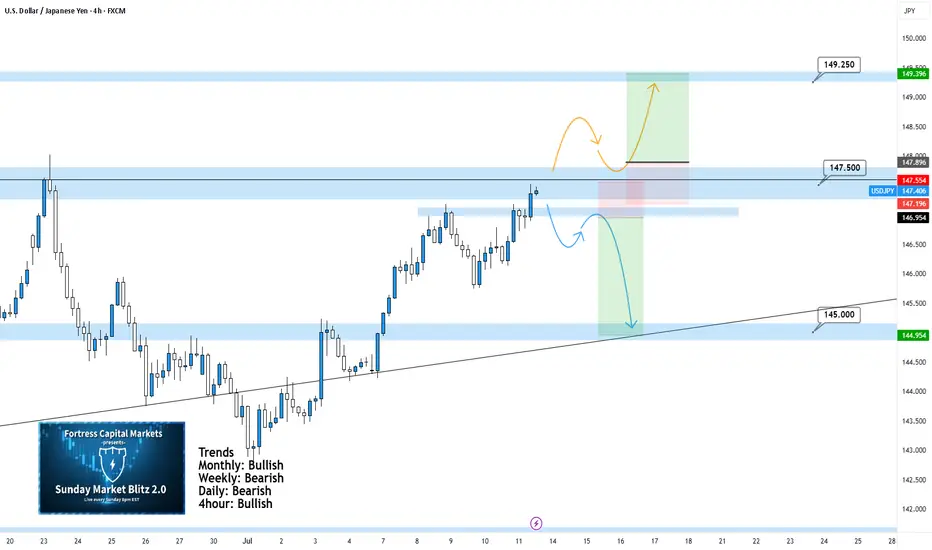
USDJPY 4Hour TF - July 13th, 2025USDJPY 7/13/2025
USDJPY 4Hour Neutral Idea
Monthly - Bullish
Weekly - Bearish
Daily - Bearish
4Hour - Bullish
Finally UJ is looking more clear. We’re now able to drop to the 4Hour instead of the Daily TF due to price action reaching a major zone of anticipated reactions.
As always we’re looking at two trade scenarios going into the week ahead:
Bullish Continuation - UJ is currently sitting at 147.500 resistance and closed there last week. Going into this week we could see the bullish trend continue but we would need to see a clear break of 147.500 resistance to gain confidence. Look for a higher low confirmed above 147.500 followed by strong bullish setups to enter long on. Look to target higher toward major resistance levels like 149.250 area.
Bearish Reversal: Despite the strong bullish momentum we saw from last week, a reversal is still possible as price action is near our 147.250 zone. In order to consider bearish setups we would need to see strong rejection from the current level of resistance. Look to target lower toward 145.000 support.
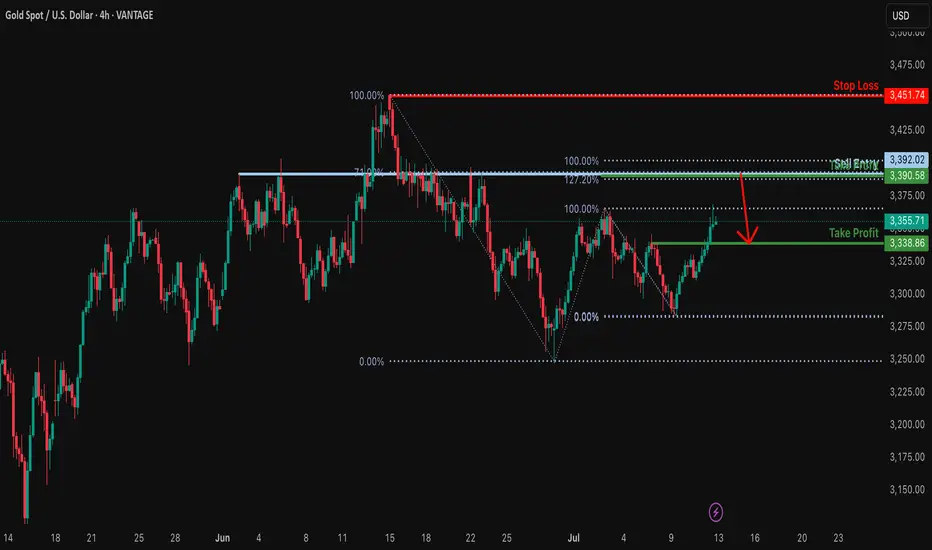
Heading into Fibonacci confluence?XAU/USD is rising towards the resistance level, which is a pullback resistance aligning with the 127.2% Fibonacci extension, the 71% Fibonacci retracement, and the 100% Fibonacci projection. A reversal from this level could lead to our take profit
Entry: 3,392.02
Why we like it:
There is a pullback resistance that lines up with the 127.2% Fibonacci extension, the 71% Fibonacci retracement and the 100% Fibonacci projection.
Stop loss: 3,451.74
Why we like it:
There is a pullback resistance.
Take profit: 3,338.86
Why we like it:
There is a pullback support.
Enjoying your TradingView experience? Review us!
Please be advised that the information presented on TradingView is provided to Vantage (‘Vantage Global Limited’, ‘we’) by a third-party provider (‘Everest Fortune Group’). Please be reminded that you are solely responsible for the trading decisions on your account. There is a very high degree of risk involved in trading. Any information and/or content is intended entirely for research, educational and informational purposes only and does not constitute investment or consultation advice or investment strategy. The information is not tailored to the investment needs of any specific person and therefore does not involve a consideration of any of the investment objectives, financial situation or needs of any viewer that may receive it. Kindly also note that past performance is not a reliable indicator of future results. Actual results may differ materially from those anticipated in forward-looking or past performance statements. We assume no liability as to the accuracy or completeness of any of the information and/or content provided herein and the Company cannot be held responsible for any omission, mistake nor for any loss or damage including without limitation to any loss of profit which may arise from reliance on any information supplied by Everest Fortune Group.
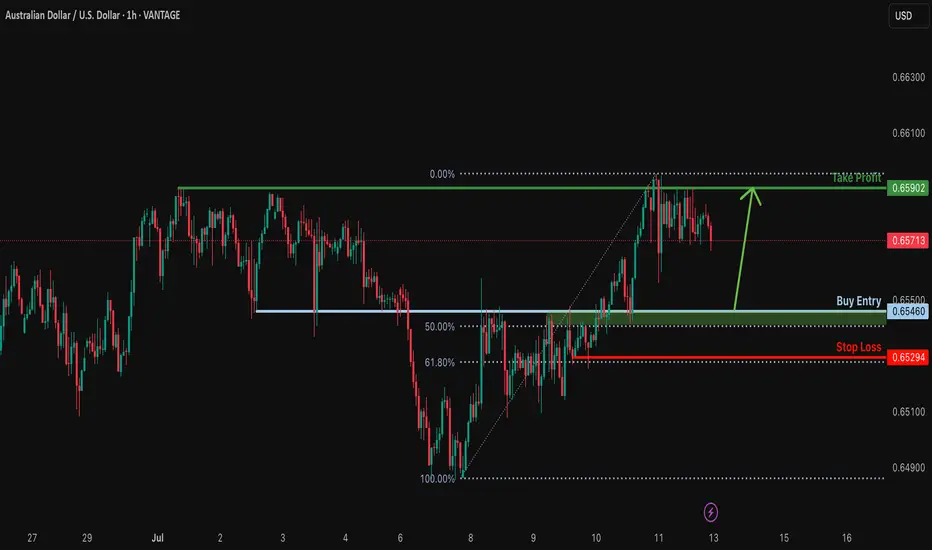
Bullish bounce off overlap support?AUD/USD is falling towards the support level which is an overlap support that is slightly above the 50% Fibonacci retracement and could bounce from this level too ur take profit.
Entry: 0.6546
Why we like it:
There is an overlap support that is slightly above the 50% Fibonacci retracement.
Stop loss: 0.6529
Why we like it:
There is a pullback support that aligns with the 61.8% Fibonacci retracement.
Take profit: 0.6590
Why we like it:
There is a pullback support.
Enjoying your TradingView experience? Review us!
Please be advised that the information presented on TradingView is provided to Vantage (‘Vantage Global Limited’, ‘we’) by a third-party provider (‘Everest Fortune Group’). Please be reminded that you are solely responsible for the trading decisions on your account. There is a very high degree of risk involved in trading. Any information and/or content is intended entirely for research, educational and informational purposes only and does not constitute investment or consultation advice or investment strategy. The information is not tailored to the investment needs of any specific person and therefore does not involve a consideration of any of the investment objectives, financial situation or needs of any viewer that may receive it. Kindly also note that past performance is not a reliable indicator of future results. Actual results may differ materially from those anticipated in forward-looking or past performance statements. We assume no liability as to the accuracy or completeness of any of the information and/or content provided herein and the Company cannot be held responsible for any omission, mistake nor for any loss or damage including without limitation to any loss of profit which may arise from reliance on any information supplied by Everest Fortune Group.
Falling towards major support?The Cable (GBP/USD) is falling towards the support which is an overlap support that lines up with the 78.6% Fibonacci projection and could bounce from this level to our take profit.
Entry: 1.3396
Why we like it:
There is an overlap support that lines up with the 78.6% Fibonacci projection.
Stop loss: 1.3318
Why we like it:
There is a pullback support.
Take profit: 1.3503
Why we like it:
There is a pullback support.
Enjoying your TradingView experience? Review us!
Please be advised that the information presented on TradingView is provided to Vantage (‘Vantage Global Limited’, ‘we’) by a third-party provider (‘Everest Fortune Group’). Please be reminded that you are solely responsible for the trading decisions on your account. There is a very high degree of risk involved in trading. Any information and/or content is intended entirely for research, educational and informational purposes only and does not constitute investment or consultation advice or investment strategy. The information is not tailored to the investment needs of any specific person and therefore does not involve a consideration of any of the investment objectives, financial situation or needs of any viewer that may receive it. Kindly also note that past performance is not a reliable indicator of future results. Actual results may differ materially from those anticipated in forward-looking or past performance statements. We assume no liability as to the accuracy or completeness of any of the information and/or content provided herein and the Company cannot be held responsible for any omission, mistake nor for any loss or damage including without limitation to any loss of profit which may arise from reliance on any information supplied by Everest Fortune Group.

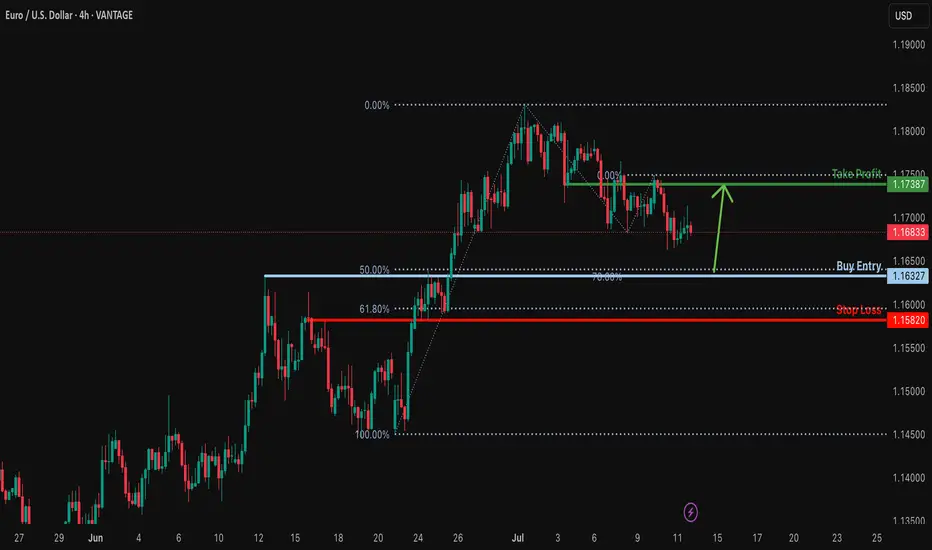
Bullish bounce off 50% Fibonacci support?EUR/USD is falling towards the support level which is a pullback support that lines up with the 50% Fibonacci support and could bounce from this level to our take profit.
Entry: 1.1632
Why we like it:
There is a pullback support that lines up with the 50% Fibonacci retracement.
Stop loss: 1.1582
Why we like it:
There is an overlap support that is slightly below the 61.8% Fibonacci retracement.
Take profit: 1.1738
Why we like it:
There is an overlap resistance.
Enjoying your TradingView experience? Review us!
Please be advised that the information presented on TradingView is provided to Vantage (‘Vantage Global Limited’, ‘we’) by a third-party provider (‘Everest Fortune Group’). Please be reminded that you are solely responsible for the trading decisions on your account. There is a very high degree of risk involved in trading. Any information and/or content is intended entirely for research, educational and informational purposes only and does not constitute investment or consultation advice or investment strategy. The information is not tailored to the investment needs of any specific person and therefore does not involve a consideration of any of the investment objectives, financial situation or needs of any viewer that may receive it. Kindly also note that past performance is not a reliable indicator of future results. Actual results may differ materially from those anticipated in forward-looking or past performance statements. We assume no liability as to the accuracy or completeness of any of the information and/or content provided herein and the Company cannot be held responsible for any omission, mistake nor for any loss or damage including without limitation to any loss of profit which may arise from reliance on any information supplied by Everest Fortune Group.
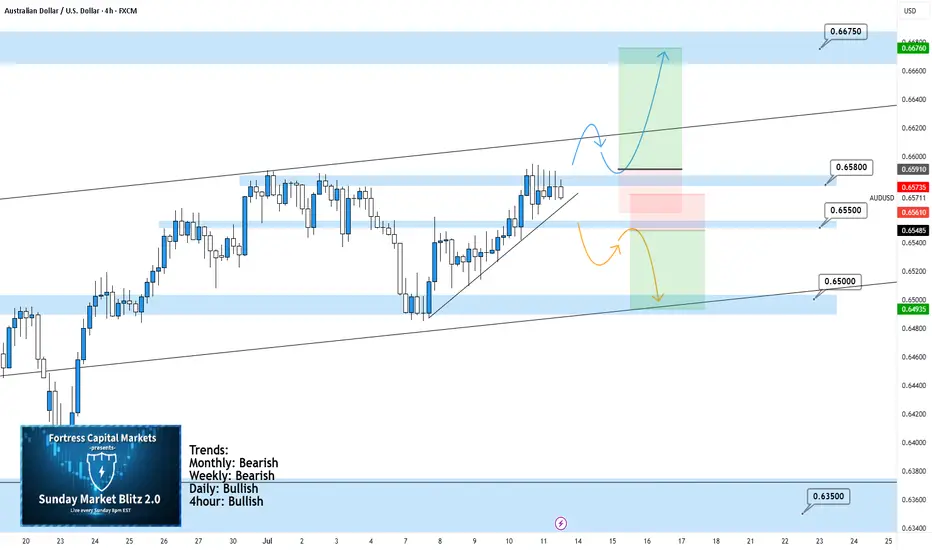
AUDUSD 4Hour TF - July 13th,2025AUDUSD 7/13/2025
AUDUSD 4hour Bullish idea
Monthly - Bearish
Weekly - Bearish
Dailly - Bullish
4hour - Bullish
We’re looking like we’re back to bullish after last week. The 4Hour timeframe has been moving up nicely and as of last week we’re sitting just below 0.65800. Going into this week we’re looking mainly bullish but we are still going to mark up two potential scenarios:
Bullish Continuation - This is looking like the most likely scenario. Ideally, price action pushes above 0.65800 then retests as support and confirms the next higher low. I’d be interested in positions as the higher low is forming and as I can spot bullish conviction to enter long on.
Bearish Reversal - Even though it’s likely we will continue bullish, a reversal is still possible as nothing is definite. For us to consider bearish setups we would need to see a break below 0.65500 with a retest of that zone as new resistance. Look for a lower high to short on below 0.65500.
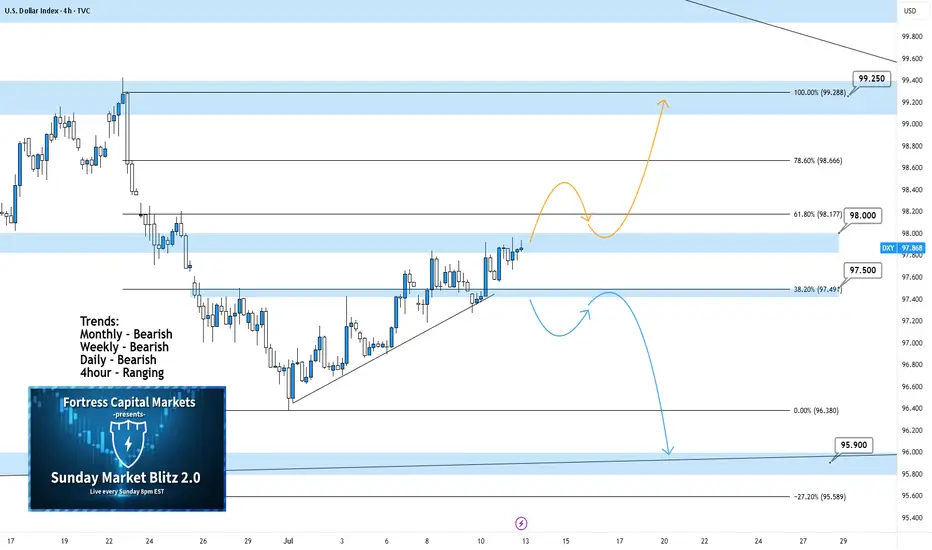
DXY 4Hour TF - July 13th, 2025DXY 7/13/2025
DXY 4hour Neutral Idea
Monthly - Bearish
Weekly - Bearish
Dailly - Bearish
4hour - Ranging
Keep in mind, we analyze and follow DXY more so as an indicator. The USD makes up for a large portion of trade so it makes sense to analyze it.
Going into this week we can see DXY made an attempt to push higher. Where it closed on Friday is a major zone around 98.000. We’re still majorly bearish on higher time frames so we will keep that in mind throughout this week.
As always, we will mark up two potential paths for this week, they are as follows:
Bullish Breakout - The two main zones we want to bring out attention to are 98.000 resistance and 97.500 support. We will have to wait until price action leaves this area to spot a high quality setup. Look for a convincing push above 98.000 resistance followed by a retest of 98.000 but as support. Look for a higher low to form with bullish confirmation to long on.
Bearish Continuation- Going bearish is still very possible we just need to clear 97.500 support first. Look for a break below 97.500 with a confirmed lower high and convincing bearish setups to short on.
#AN020: US Tariffs, Euro Weakness, USD Strength, Forex at Risk?
1. New US Tariff Threats Against the EU and Canada
Over the weekend, President Trump announced the sending of formal letters introducing new tariffs: 35% on Canadian goods and potential tariffs for the EU as well (15-20%).
Context: The return of protectionism fuels uncertainty.
Market Impact: Shift to safe-haven currencies — the US dollar gains ground, while EUR/USD and USD/CAD remain under pressure.
2. EUR/USD Below 1.1700
The EUR/USD pair closed the week below 1.1700, failing to recover.
3. GBP/USD Loses Ground
The GBP/USD pair fell below 1.3500, hitting a three-week low.
Factors: Disappointing UK GDP data + stronger USD.
Impact: Pressure on the pound, possible continuation of the downtrend to 1.3420 unless better data emerges.
4. USD/JPY near 147.50
The dollar reached new two-week highs against the yen, hitting 147.50.
Causes: Risk flight and reduced expectations for BoJ intervention.
Outlook: If global sentiment remains adverse, USD/JPY could head towards 148.00.
5. Gold and safe-haven assets recover
Trade uncertainty is supporting gold, which has risen to near $3,360/ounce.
Outlook: Volatility and preference for the USD and JPY are increasing; gold will act as a sentinel of fear in the markets.
🔍 Summary of Impacts on Forex Markets
EUR/USD Weaker: Push toward 1.1600 due to trade concerns and USD strength
GBP/USD Down: UK data pressured + risk aversion
USD/JPY Rising: USD refuge and possible break above 148
USD/CAD Volatile: Canadian tariffs penalize CAD, but oil prices and BoC reactions to monitor
Gold & XM Gold strengthens, signaling risk, USD support; JPY and USD benefit

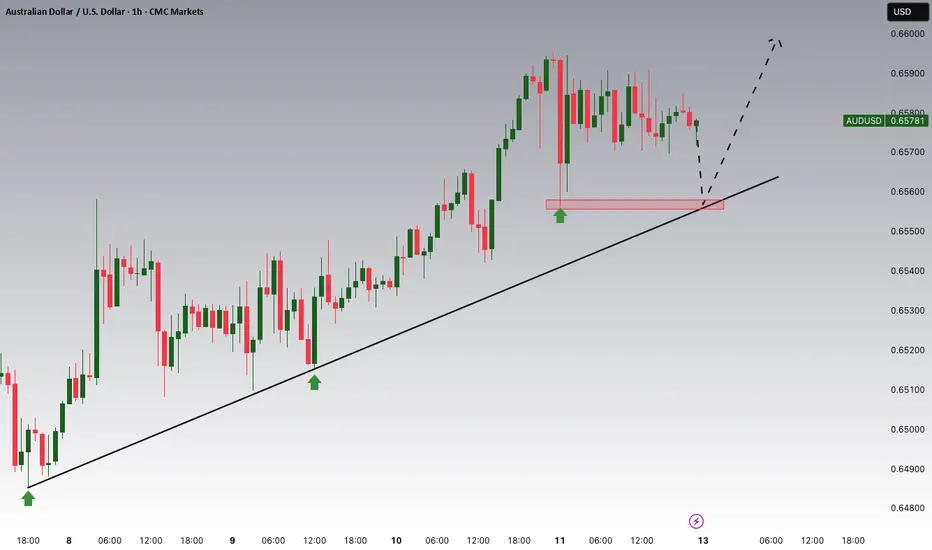
AUDUSD Potential UpsidesHey Traders, in today's trading session we are monitoring AUDUSD for a buying opportunity around 0.65550 zone, AUDUSD is trading in an uptrend and currently is in a correction phase in which it is approaching the trend at 0.65550 support and resistance area.
Trade safe, Joe.
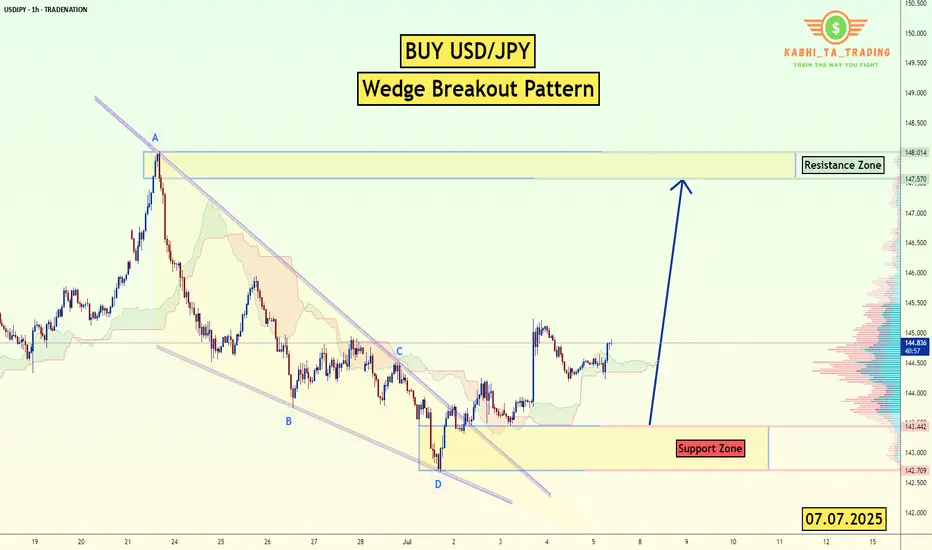
USD/JPY - H1- Wedge Breakout (07.07.2025)The USD/JPY pair on the H1 timeframe presents a Potential Buying Opportunity due to a recent Formation of a Wedge Breakout Pattern. This suggests a shift in momentum towards the upside and a higher likelihood of further advances in the coming hours.
Possible Long Trade:
Entry: Consider Entering A Long Position around Trendline Of The Pattern.
Target Levels:
1st Resistance – 148.00
🎁 Please hit the like button and
🎁 Leave a comment to support for My Post !
Your likes and comments are incredibly motivating and will encourage me to share more analysis with you.
Best Regards, KABHI_TA_TRADING
Thank you.
Disclosure: I am part of Trade Nation's Influencer program and receive a monthly fee for using their TradingView charts in my analysis.
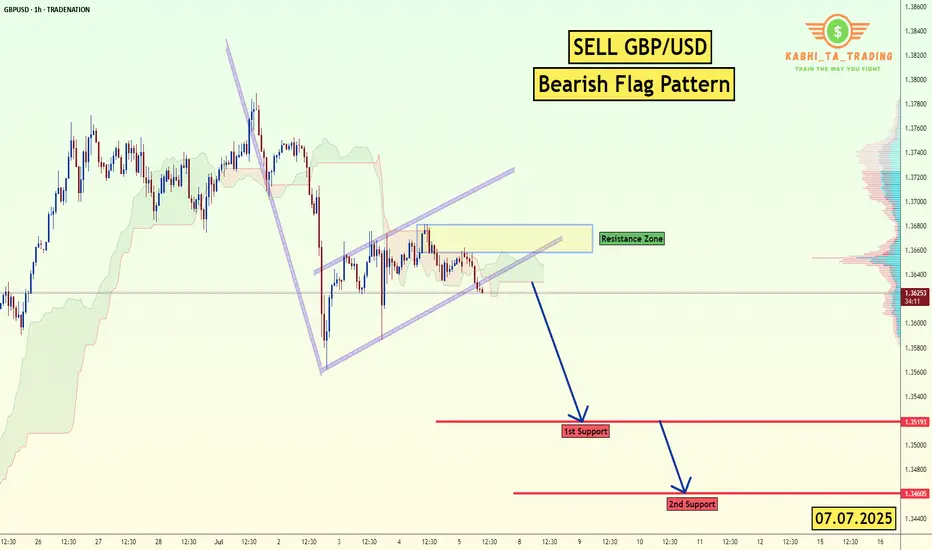
GBP/USD - H1- Bearish Flag (07.07.2025)The GBP/USD Pair on the M30 timeframe presents a Potential Selling Opportunity due to a recent Formation of a Bearish Flag Pattern. This suggests a shift in momentum towards the downside in the coming hours.
Possible Short Trade:
Entry: Consider Entering A Short Position around Trendline Of The Pattern.
Target Levels:
1st Support – 1.3520
2nd Support – 1.3460
🎁 Please hit the like button and
🎁 Leave a comment to support for My Post !
Your likes and comments are incredibly motivating and will encourage me to share more analysis with you.
Best Regards, KABHI_TA_TRADING
Thank you.
Disclosure: I am part of Trade Nation's Influencer program and receive a monthly fee for using their TradingView charts in my analysis.
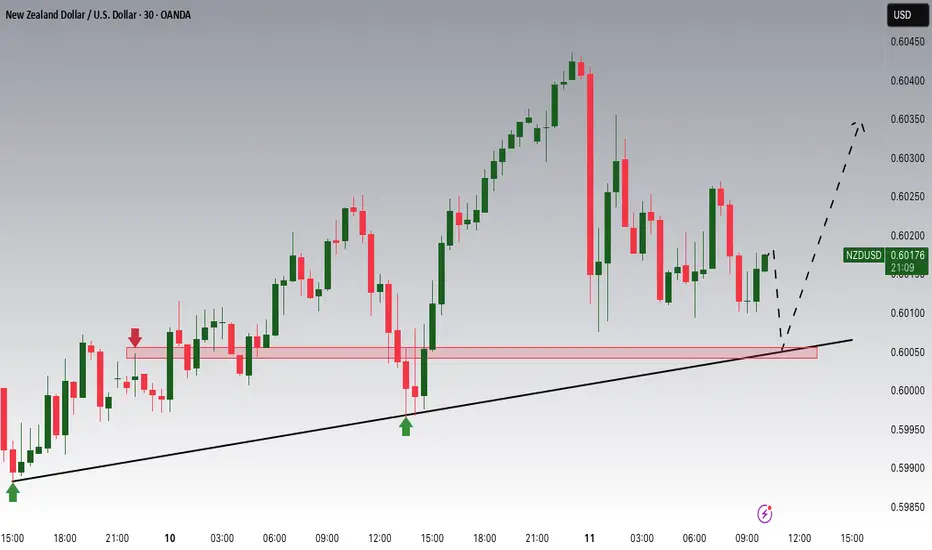
NZDUSD Potential UpsidesHey Traders, in today's trading session we are monitoring NZDUSD for a buying opportunity around 0.60000 zone, NZDUSD is trading in an uptrend and currently is in a correction phase in which it is approaching the trend at 0.60000 support and resistance area.
Trade safe, Joe.
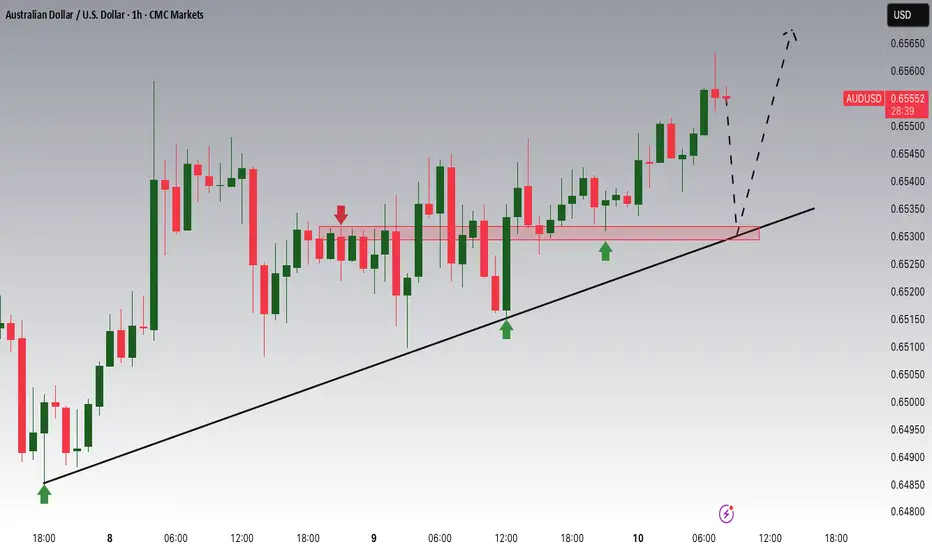
AUDUSD Potential UpsidesHey Traders, in today's trading session we are monitoring AUDUSD for a buying opportunity around 0.65300 zone, AUDUSD is trading in an uptrend and currently is in a correction phase in which it is approaching the trend at 0.65300 support and resistance area.
Trade safe, Joe.