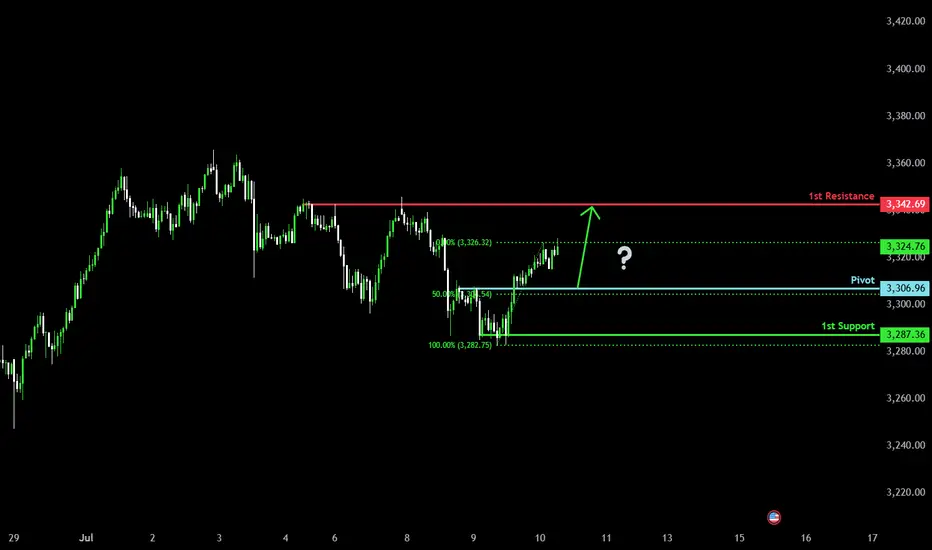
Falling towards 50% Fibonacci supprt?The Gold (XAU/USD) is falling towards the pivot and could bounce to the 1st resistance which is a pullback resistance.
Pivot: 3,306.96
1st Support: 3,287.36
1st Resistance: 3,342.69
Risk Warning:
Trading Forex and CFDs carries a high level of risk to your capital and you should only trade with money you can afford to lose. Trading Forex and CFDs may not be suitable for all investors, so please ensure that you fully understand the risks involved and seek independent advice if necessary.
Disclaimer:
The above opinions given constitute general market commentary, and do not constitute the opinion or advice of IC Markets or any form of personal or investment advice.
Any opinions, news, research, analyses, prices, other information, or links to third-party sites contained on this website are provided on an "as-is" basis, are intended only to be informative, is not an advice nor a recommendation, nor research, or a record of our trading prices, or an offer of, or solicitation for a transaction in any financial instrument and thus should not be treated as such. The information provided does not involve any specific investment objectives, financial situation and needs of any specific person who may receive it. Please be aware, that past performance is not a reliable indicator of future performance and/or results. Past Performance or Forward-looking scenarios based upon the reasonable beliefs of the third-party provider are not a guarantee of future performance. Actual results may differ materially from those anticipated in forward-looking or past performance statements. IC Markets makes no representation or warranty and assumes no liability as to the accuracy or completeness of the information provided, nor any loss arising from any investment based on a recommendation, forecast or any information supplied by any third-party.
J-USD
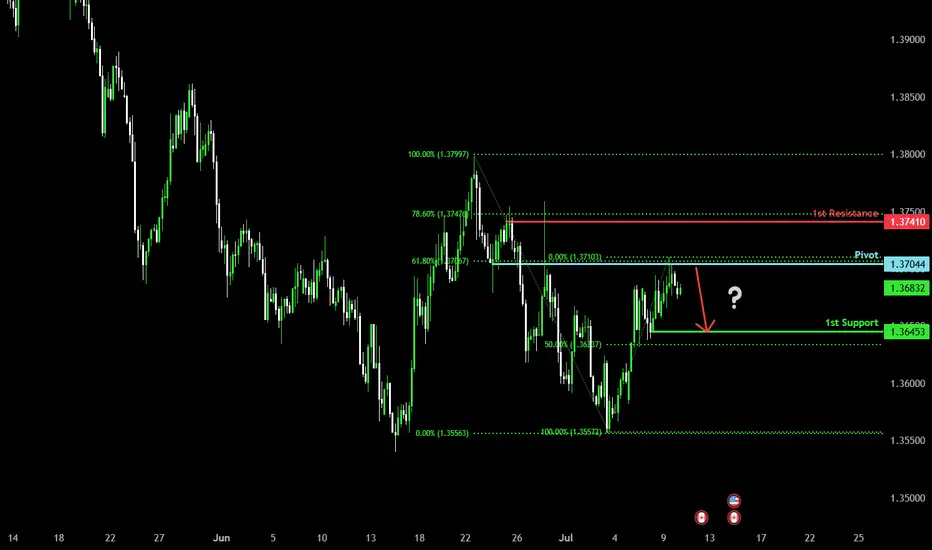
Bearish reversal off overlap resistance?The Loonie (USD/CAD) has rejected off the pivot which has been identified as an overlap resistance and could drop to the 1st support which acts as a pullback support.
Pivot: 1.3704
1st Support: 1.3645
1st Resistance: 1.3741
Risk Warning:
Trading Forex and CFDs carries a high level of risk to your capital and you should only trade with money you can afford to lose. Trading Forex and CFDs may not be suitable for all investors, so please ensure that you fully understand the risks involved and seek independent advice if necessary.
Disclaimer:
The above opinions given constitute general market commentary, and do not constitute the opinion or advice of IC Markets or any form of personal or investment advice.
Any opinions, news, research, analyses, prices, other information, or links to third-party sites contained on this website are provided on an "as-is" basis, are intended only to be informative, is not an advice nor a recommendation, nor research, or a record of our trading prices, or an offer of, or solicitation for a transaction in any financial instrument and thus should not be treated as such. The information provided does not involve any specific investment objectives, financial situation and needs of any specific person who may receive it. Please be aware, that past performance is not a reliable indicator of future performance and/or results. Past Performance or Forward-looking scenarios based upon the reasonable beliefs of the third-party provider are not a guarantee of future performance. Actual results may differ materially from those anticipated in forward-looking or past performance statements. IC Markets makes no representation or warranty and assumes no liability as to the accuracy or completeness of the information provided, nor any loss arising from any investment based on a recommendation, forecast or any information supplied by any third-party.
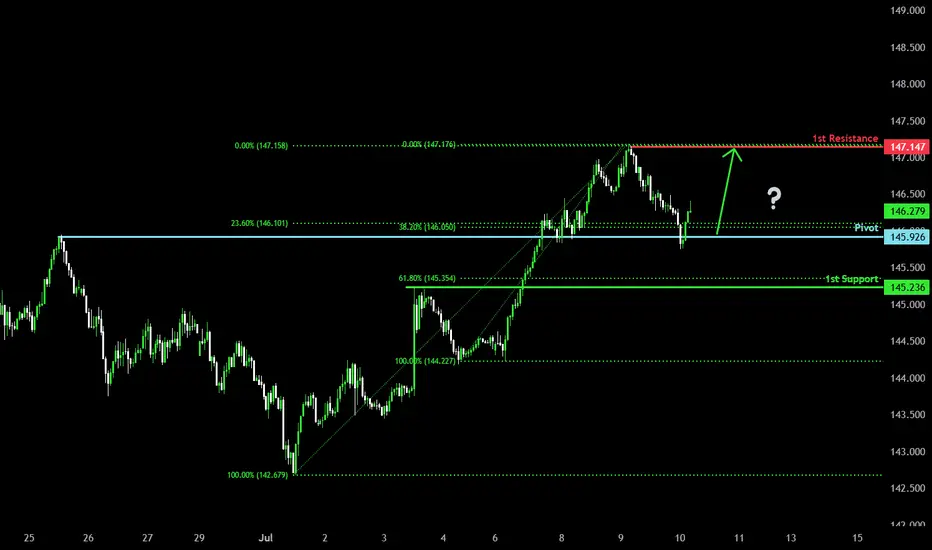
Bullish bounce off major support?USD/JPY has bounced off the pivot and could rise to the pullback resistance.
Pivot: 145.92
1st Support: 145.23
1st Resistance: 147.14
Risk Warning:
Trading Forex and CFDs carries a high level of risk to your capital and you should only trade with money you can afford to lose. Trading Forex and CFDs may not be suitable for all investors, so please ensure that you fully understand the risks involved and seek independent advice if necessary.
Disclaimer:
The above opinions given constitute general market commentary, and do not constitute the opinion or advice of IC Markets or any form of personal or investment advice.
Any opinions, news, research, analyses, prices, other information, or links to third-party sites contained on this website are provided on an "as-is" basis, are intended only to be informative, is not an advice nor a recommendation, nor research, or a record of our trading prices, or an offer of, or solicitation for a transaction in any financial instrument and thus should not be treated as such. The information provided does not involve any specific investment objectives, financial situation and needs of any specific person who may receive it. Please be aware, that past performance is not a reliable indicator of future performance and/or results. Past Performance or Forward-looking scenarios based upon the reasonable beliefs of the third-party provider are not a guarantee of future performance. Actual results may differ materially from those anticipated in forward-looking or past performance statements. IC Markets makes no representation or warranty and assumes no liability as to the accuracy or completeness of the information provided, nor any loss arising from any investment based on a recommendation, forecast or any information supplied by any third-party.
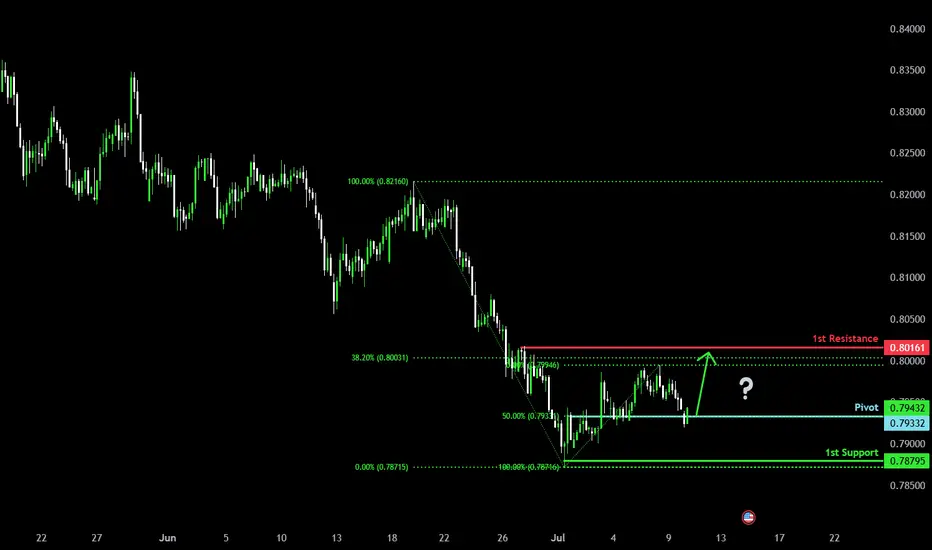
Could the Swissie bounce from here?The price is reacting off the pivot which acts as an overlap support and could bouncer to the 1st resistance which is slightly above the 37.2% Fibonacci retracement.
Pivot: 0.7933
1st Support: 0.7879
1st Resistance: 0.8016
Risk Warning:
Trading Forex and CFDs carries a high level of risk to your capital and you should only trade with money you can afford to lose. Trading Forex and CFDs may not be suitable for all investors, so please ensure that you fully understand the risks involved and seek independent advice if necessary.
Disclaimer:
The above opinions given constitute general market commentary, and do not constitute the opinion or advice of IC Markets or any form of personal or investment advice.
Any opinions, news, research, analyses, prices, other information, or links to third-party sites contained on this website are provided on an "as-is" basis, are intended only to be informative, is not an advice nor a recommendation, nor research, or a record of our trading prices, or an offer of, or solicitation for a transaction in any financial instrument and thus should not be treated as such. The information provided does not involve any specific investment objectives, financial situation and needs of any specific person who may receive it. Please be aware, that past performance is not a reliable indicator of future performance and/or results. Past Performance or Forward-looking scenarios based upon the reasonable beliefs of the third-party provider are not a guarantee of future performance. Actual results may differ materially from those anticipated in forward-looking or past performance statements. IC Markets makes no representation or warranty and assumes no liability as to the accuracy or completeness of the information provided, nor any loss arising from any investment based on a recommendation, forecast or any information supplied by any third-party.
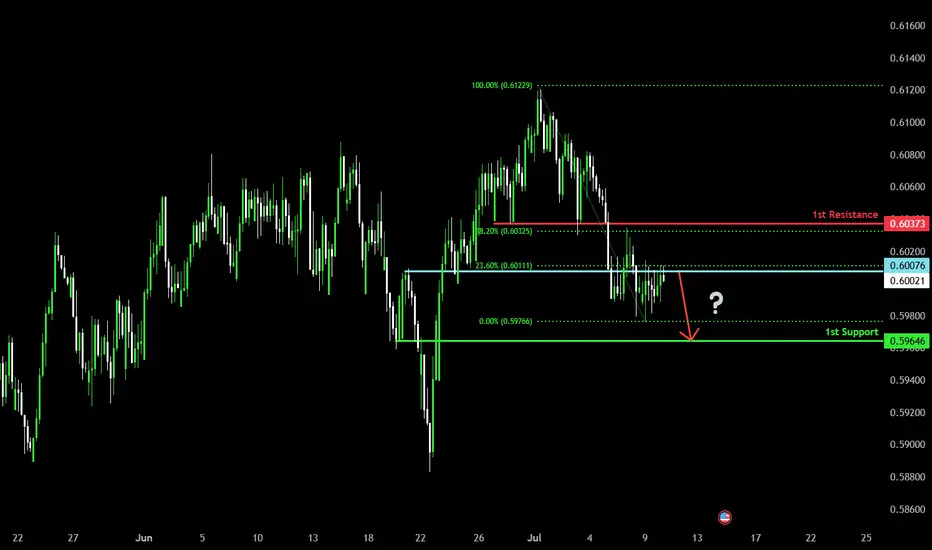
Bearish drop?The Kiwi (NZD/USD) is reacting off the pivot and could drop to the 1st support which is a pullback support.
Pivot: 0.6007
1st Support: 0.5946
1st Resistance: 0.6037
Risk Warning:
Trading Forex and CFDs carries a high level of risk to your capital and you should only trade with money you can afford to lose. Trading Forex and CFDs may not be suitable for all investors, so please ensure that you fully understand the risks involved and seek independent advice if necessary.
Disclaimer:
The above opinions given constitute general market commentary, and do not constitute the opinion or advice of IC Markets or any form of personal or investment advice.
Any opinions, news, research, analyses, prices, other information, or links to third-party sites contained on this website are provided on an "as-is" basis, are intended only to be informative, is not an advice nor a recommendation, nor research, or a record of our trading prices, or an offer of, or solicitation for a transaction in any financial instrument and thus should not be treated as such. The information provided does not involve any specific investment objectives, financial situation and needs of any specific person who may receive it. Please be aware, that past performance is not a reliable indicator of future performance and/or results. Past Performance or Forward-looking scenarios based upon the reasonable beliefs of the third-party provider are not a guarantee of future performance. Actual results may differ materially from those anticipated in forward-looking or past performance statements. IC Markets makes no representation or warranty and assumes no liability as to the accuracy or completeness of the information provided, nor any loss arising from any investment based on a recommendation, forecast or any information supplied by any third-party.
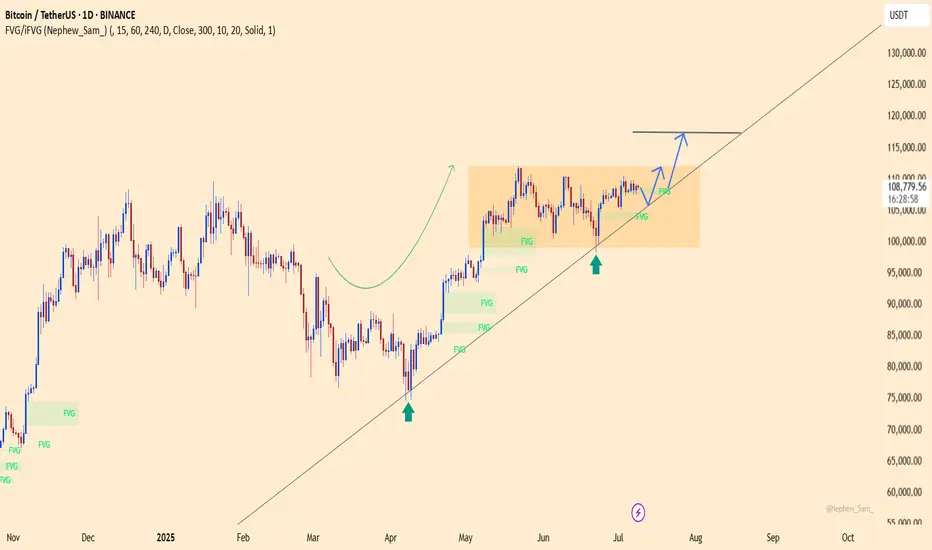
BTCUSDT – Calm Before the BreakoutBitcoin is holding firmly above the ascending trendline, consolidating within the accumulation range of $98,000 to $117,000. The current structure suggests that buyers remain in control, especially after a strong rebound from the $98,450 support zone.
In terms of news, BTC has been slightly affected by market concerns over new U.S. tariffs. However, on-chain data still shows strong accumulation around the $108,000 level. If this base holds, BTCUSDT could break out toward the $117,424 target in the near term. Conversely, if the trendline fails, the $98,000 level will be the final stronghold for the bulls.
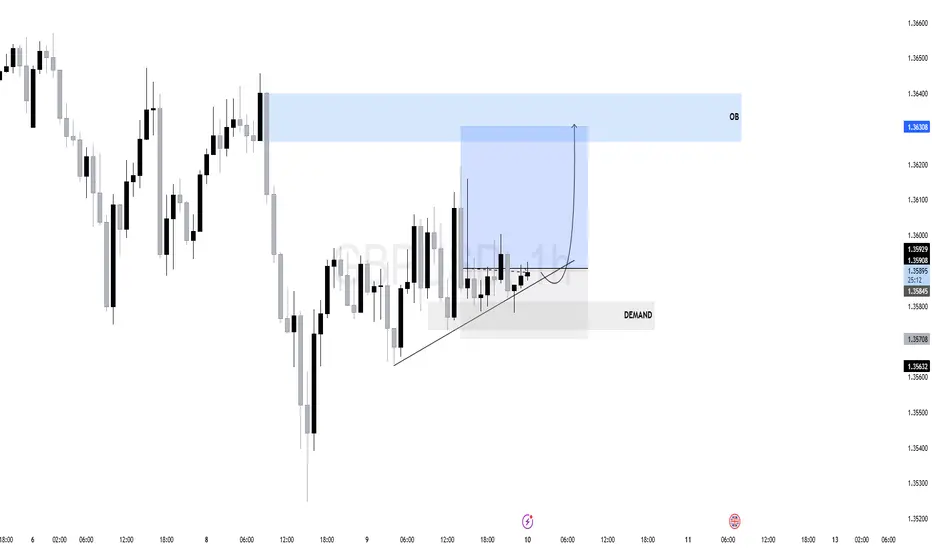
$GU (GBPUSD) 1HPrice has been consolidating after a previous sell-off and is now showing signs of accumulation above a defined demand zone (1.35600–1.35800).
The price has respected the ascending internal trendline, forming higher lows — an early sign of bullish intent.
Strong bullish rejection from this area confirms interest from smart money. Price tested it and immediately rebounded, signaling absorption of sell-side liquidity.
The internal ascending trendline continues to act as dynamic support. As long as price respects this trendline, bullish bias remains intact.
Multiple highs around 1.36300 remain untouched — a magnet for price.That area overlaps with an Order Block (OB), making it a high-probability target for institutional interest.
The tight consolidation before the expansion (highlighted in blue) suggests price is loading for a sharp move.
As long as price remains above the demand zone and trendline A bullish expansion toward the OB zone (1.36300–1.36400) Or A potential liquidity sweep above the highs, aligning with external liquidity targets.
USDCAD Potential DownsidesHey Traders, in today's trading session we are monitoring USDCAD for a selling opportunity around 1.36900 zone, USDCAD is trading in a downtrend and currently is in a correction phase in which it is approaching the trend at 1.36900 support and resistance area.
Trade safe, Joe.
Bearish drop for the Cable?The price is rising towards the pivot and could drop to the 1st support which is a pullback support.
Pivot: 1.3632
1st Support: 1.3503
1st Resistance: 1.3693
Risk Warning:
Trading Forex and CFDs carries a high level of risk to your capital and you should only trade with money you can afford to lose. Trading Forex and CFDs may not be suitable for all investors, so please ensure that you fully understand the risks involved and seek independent advice if necessary.
Disclaimer:
The above opinions given constitute general market commentary, and do not constitute the opinion or advice of IC Markets or any form of personal or investment advice.
Any opinions, news, research, analyses, prices, other information, or links to third-party sites contained on this website are provided on an "as-is" basis, are intended only to be informative, is not an advice nor a recommendation, nor research, or a record of our trading prices, or an offer of, or solicitation for a transaction in any financial instrument and thus should not be treated as such. The information provided does not involve any specific investment objectives, financial situation and needs of any specific person who may receive it. Please be aware, that past performance is not a reliable indicator of future performance and/or results. Past Performance or Forward-looking scenarios based upon the reasonable beliefs of the third-party provider are not a guarantee of future performance. Actual results may differ materially from those anticipated in forward-looking or past performance statements. IC Markets makes no representation or warranty and assumes no liability as to the accuracy or completeness of the information provided, nor any loss arising from any investment based on a recommendation, forecast or any information supplied by any third-party.

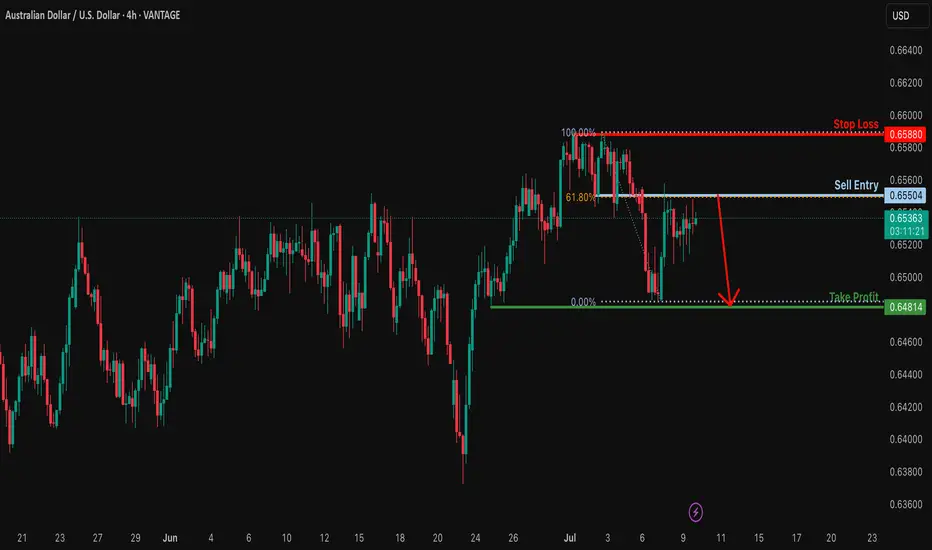
Could the Aussie reverse from here?The price is rising towards the resistance level which is a pullback resistance that lines up with the 61.8% Fibonacci retracement and could drop from this level to our take profit.
Entry: 0.6650
Why we like it:
There is a pullback resistance that lines up with the 61.8% Fibonacci retracement.
Stop loss: 0.6588
Why we like it:
There is a pullback resistance.
Take profit: 0.6481
Why we like it:
There is a pullback support.
Enjoying your TradingView experience? Review us!
Please be advised that the information presented on TradingView is provided to Vantage (‘Vantage Global Limited’, ‘we’) by a third-party provider (‘Everest Fortune Group’). Please be reminded that you are solely responsible for the trading decisions on your account. There is a very high degree of risk involved in trading. Any information and/or content is intended entirely for research, educational and informational purposes only and does not constitute investment or consultation advice or investment strategy. The information is not tailored to the investment needs of any specific person and therefore does not involve a consideration of any of the investment objectives, financial situation or needs of any viewer that may receive it. Kindly also note that past performance is not a reliable indicator of future results. Actual results may differ materially from those anticipated in forward-looking or past performance statements. We assume no liability as to the accuracy or completeness of any of the information and/or content provided herein and the Company cannot be held responsible for any omission, mistake nor for any loss or damage including without limitation to any loss of profit which may arise from reliance on any information supplied by Everest Fortune Group.
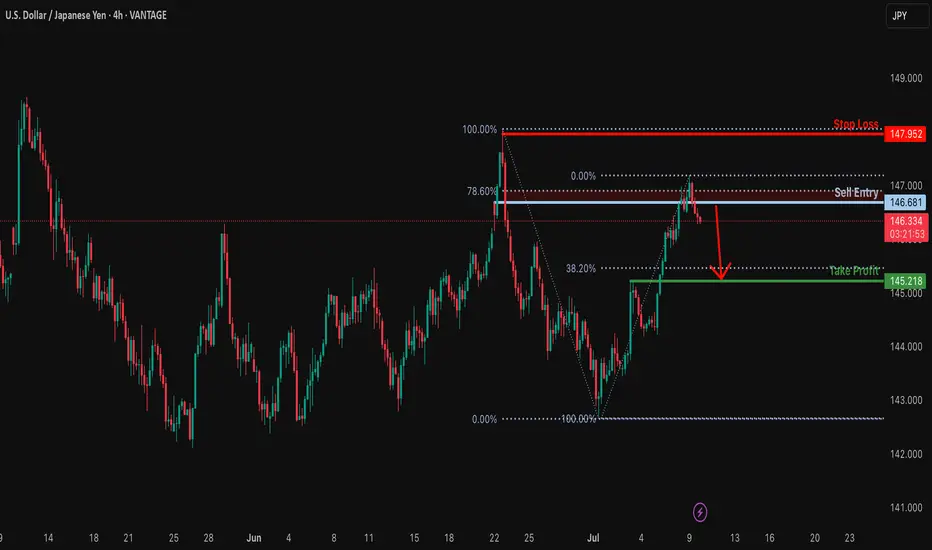
Bearish reversal off 78.6% Fibonacci resistance?USD/JPY has rejected off the resistance level that is slightly below the 78.6% Fibonacci retracement and could drop from this level to our take profit.
Entry: 146.60
Why we like it:
There is a resistance level that is slightly below the 78.6% Fibonacci retracement.
Stop loss: 147.95
Why we like it:
There is a pullback resistance level.
Take profit: 145.21
Why we like it:
There is a pullback support that is slightly below the 38.2% Fibonacci retracement.
Enjoying your TradingView experience? Review us!
Please be advised that the information presented on TradingView is provided to Vantage (‘Vantage Global Limited’, ‘we’) by a third-party provider (‘Everest Fortune Group’). Please be reminded that you are solely responsible for the trading decisions on your account. There is a very high degree of risk involved in trading. Any information and/or content is intended entirely for research, educational and informational purposes only and does not constitute investment or consultation advice or investment strategy. The information is not tailored to the investment needs of any specific person and therefore does not involve a consideration of any of the investment objectives, financial situation or needs of any viewer that may receive it. Kindly also note that past performance is not a reliable indicator of future results. Actual results may differ materially from those anticipated in forward-looking or past performance statements. We assume no liability as to the accuracy or completeness of any of the information and/or content provided herein and the Company cannot be held responsible for any omission, mistake nor for any loss or damage including without limitation to any loss of profit which may arise from reliance on any information supplied by Everest Fortune Group.
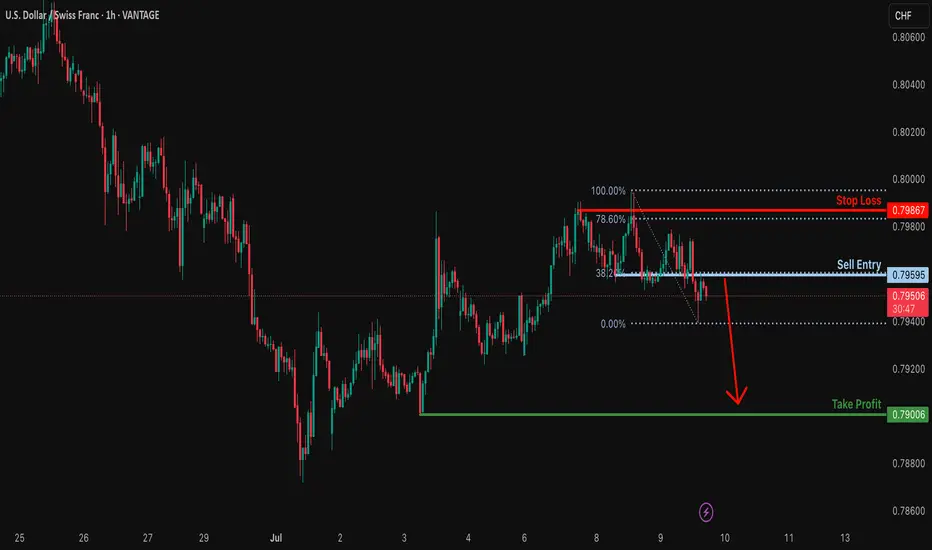
Bearish drop off pullback resistance?USD/CHF is reacting off the resistance level which is a pullback resistance that lines up with the 38.2% Fibonacci retracement and could drop from this level to our take profit.
Entry: 0.7959
Why we like it:
There is a pullback resistance level that lines up with the 38.2% Fibonacci retracement.
Stop loss: 0.7986
Why we like it:
There is a pullback resistance that is slightly above the 78.6% Fibonacci retracement.
Take profit: 0.7900
Why we like it:
There is a pullback support.
Enjoying your TradingView experience? Review us!
Please be advised that the information presented on TradingView is provided to Vantage (‘Vantage Global Limited’, ‘we’) by a third-party provider (‘Everest Fortune Group’). Please be reminded that you are solely responsible for the trading decisions on your account. There is a very high degree of risk involved in trading. Any information and/or content is intended entirely for research, educational and informational purposes only and does not constitute investment or consultation advice or investment strategy. The information is not tailored to the investment needs of any specific person and therefore does not involve a consideration of any of the investment objectives, financial situation or needs of any viewer that may receive it. Kindly also note that past performance is not a reliable indicator of future results. Actual results may differ materially from those anticipated in forward-looking or past performance statements. We assume no liability as to the accuracy or completeness of any of the information and/or content provided herein and the Company cannot be held responsible for any omission, mistake nor for any loss or damage including without limitation to any loss of profit which may arise from reliance on any information supplied by Everest Fortune Group.
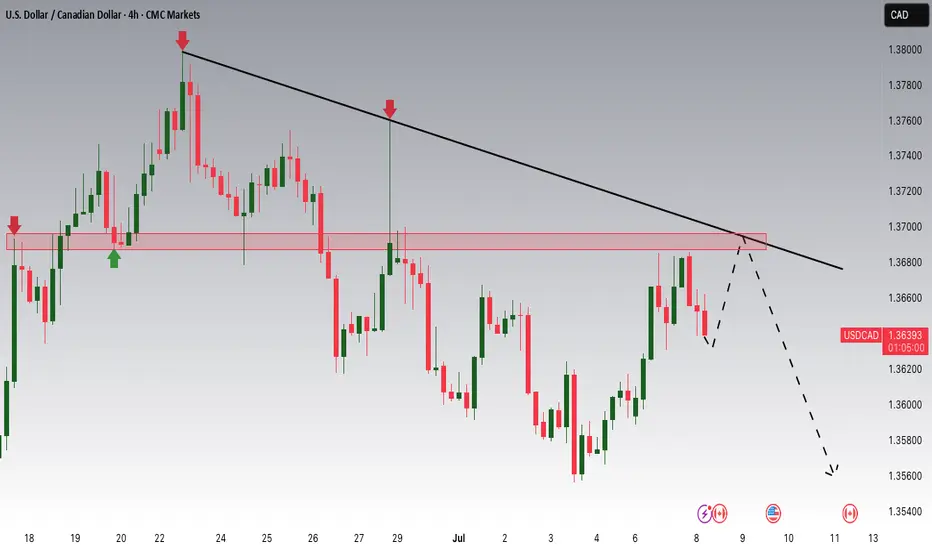
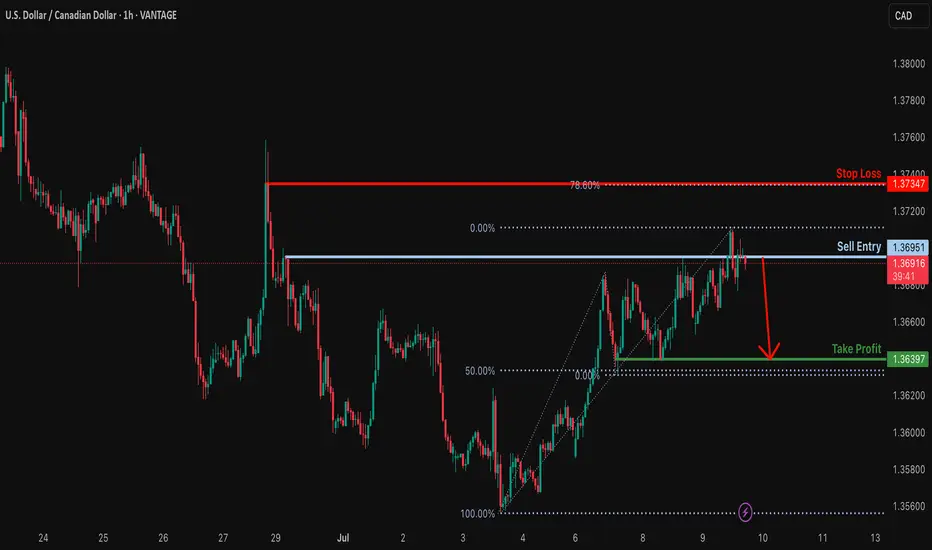
Bearish reversal?USD/CAD is reacting off the resistance level which is a pullback resistance and could drop from this level to our take profit.
Entry: 1.3695
Why we like it:
There is a pullback resistance.
Stop loss: 1.3734
Why we like it:
There is a pullback resistance level that aligns with the 78.6% Fibonacci projection.
Take profit: 1.3639
Why we like it:
There is a pullback support that is slightly above the 50% Fibonacci retracement.
Enjoying your TradingView experience? Review us!
Please be advised that the information presented on TradingView is provided to Vantage (‘Vantage Global Limited’, ‘we’) by a third-party provider (‘Everest Fortune Group’). Please be reminded that you are solely responsible for the trading decisions on your account. There is a very high degree of risk involved in trading. Any information and/or content is intended entirely for research, educational and informational purposes only and does not constitute investment or consultation advice or investment strategy. The information is not tailored to the investment needs of any specific person and therefore does not involve a consideration of any of the investment objectives, financial situation or needs of any viewer that may receive it. Kindly also note that past performance is not a reliable indicator of future results. Actual results may differ materially from those anticipated in forward-looking or past performance statements. We assume no liability as to the accuracy or completeness of any of the information and/or content provided herein and the Company cannot be held responsible for any omission, mistake nor for any loss or damage including without limitation to any loss of profit which may arise from reliance on any information supplied by Everest Fortune Group.
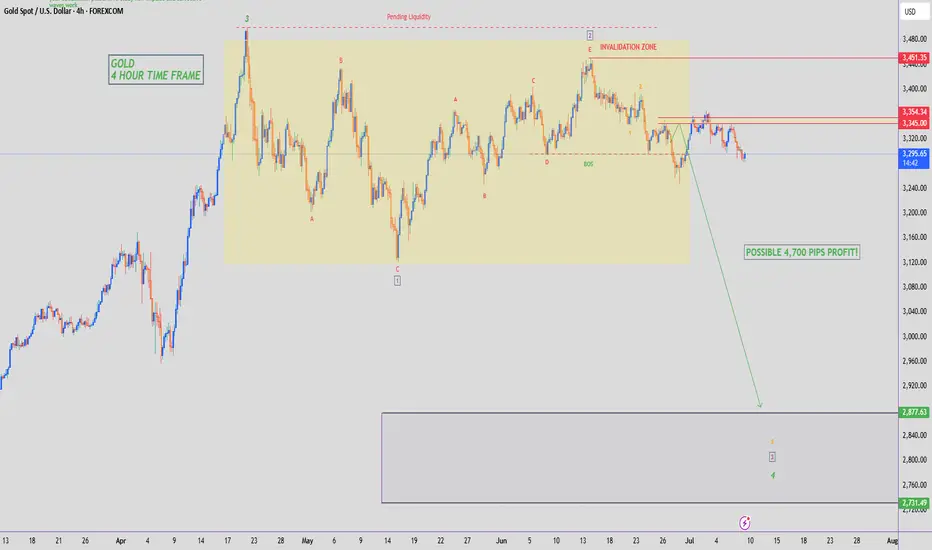
GOLD - SHORT TO $2,800 (UPDATE)Gold has dropped even lower overnight during the Asian market session. We're now running 500 PIPS in profit & hopefully this is only the BEGINNING of this huge move.
Being extremely careful here, as Gold is currently at a make or break sort of area.
Bears On The Prowl, Key Supports In FocusAnalysis
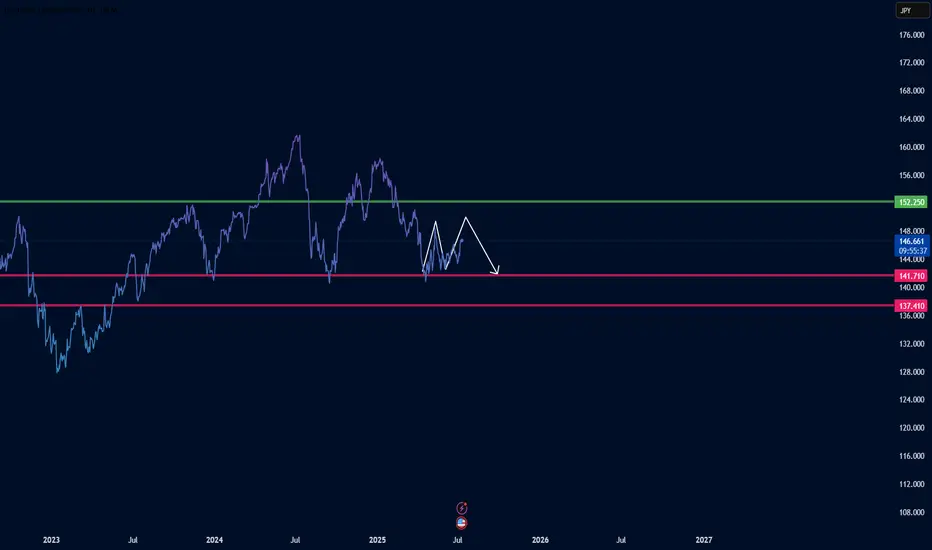
USDJPY has faced downward pressure recently and is currently trading below a key resistance level around 152.250. This level acts as a significant barrier to upward movements, and the inability to decisively break above it reinforces our bearish outlook.
Key Observations
🔹 Dominant Bearish Pressure: Despite fluctuations, bulls (buyers) seem to be struggling to maintain higher levels, while bears (sellers) are asserting pressure.
🔹 Key Resistance: The 152.250 level serves as a strong resistance. As long as the price remains below this level, the bearish view will prevail.
🔹 Crucial Supports: The levels of 141.710 and 137.410 are acting as critical support zones for this pair. A break below either of these levels could pave the way for further declines.
🔹 Momentum Indicators: (Here, you can add details about specific indicators that confirm your bearish view. For example: "The RSI is moving towards oversold territory, suggesting continued downside momentum," or "The MACD is showing a bearish crossover, indicating potential for further weakness.")
Potential Scenarios
🔴 Primary Scenario (Bearish): As long as USDJPY remains below the 152.250 resistance, we anticipate continued downward pressure. The bears' initial target will be to test and break the 141.710 support.
🔻 Break of First Support: If the 141.710 support is broken decisively (with strong candles and significant volume), this would be a strong bearish signal. In this scenario, the next target for the price would be to test the lower support at 137.410. A break below this level could lead to even deeper declines.
🟢 Alternative Scenario (Bullish): Should USDJPY manage to decisively break above the 152.250 resistance and sustain itself above it, our bearish view would be temporarily invalidated, and we might see a corrective upward movement. However, until this occurs, the focus remains on the bearish scenario.
Fundamental Considerations
🔘 US-Japan Interest Rate Differential: The significant interest rate differential between the US Federal Reserve and the Bank of Japan continues to be a major factor. Any shift in market expectations regarding the monetary policies of these two central banks could impact USDJPY.
🔘 Bank of Japan (BoJ) Policy: Any signs of a change in the BoJ's ultra-loose monetary policy (e.g., an interest rate hike or a reduction in asset purchases) could strengthen the JPY and put downward pressure on USDJPY.
🔘 US Economic Data: Upcoming US economic data, particularly inflation figures and statements from Federal Reserve officials, could influence the dollar's value and, consequently, USDJPY.
🍀HAVE PROFITABLE TRADES🍻
GBPUSD - Macro Trend Continues!Hello TradingView Family / Fellow Traders. This is Richard, also known as theSignalyst.
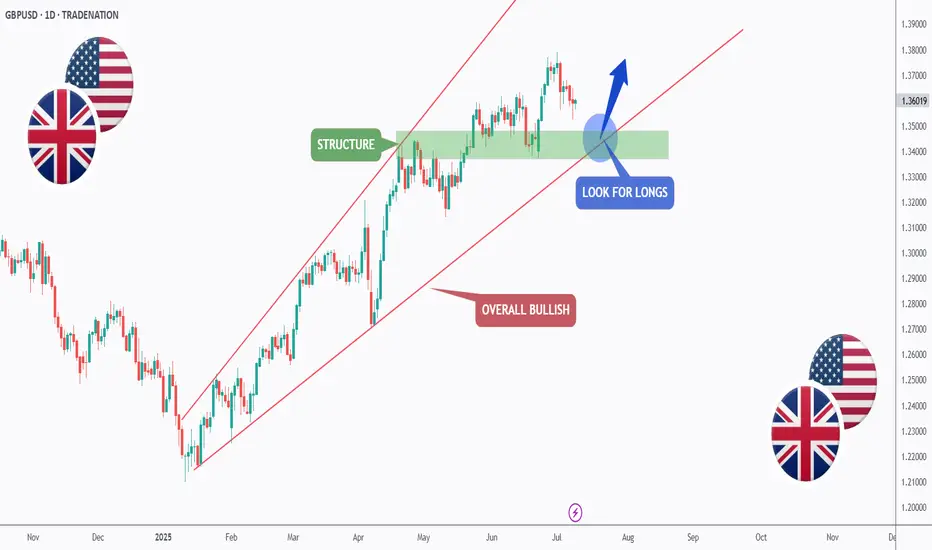
📈GBPUSD has been overall bullish trading within the rising channel marked in red. And it is currently retesting the lower bound of the channel.
Moreover, the green zone is a strong structure.
🏹 Thus, the highlighted blue circle is a strong area to look for buy setups as it is the intersection of the lower red trendline and structure.
📚 As per my trading style:
As #GBPUSD approaches the blue circle zone, I will be looking for bullish reversal setups (like a double bottom pattern, trendline break , and so on...)
📚 Always follow your trading plan regarding entry, risk management, and trade management.
Good luck!
All Strategies Are Good; If Managed Properly!
~Rich
Disclosure: I am part of Trade Nation's Influencer program and receive a monthly fee for using their TradingView charts in my analysis.
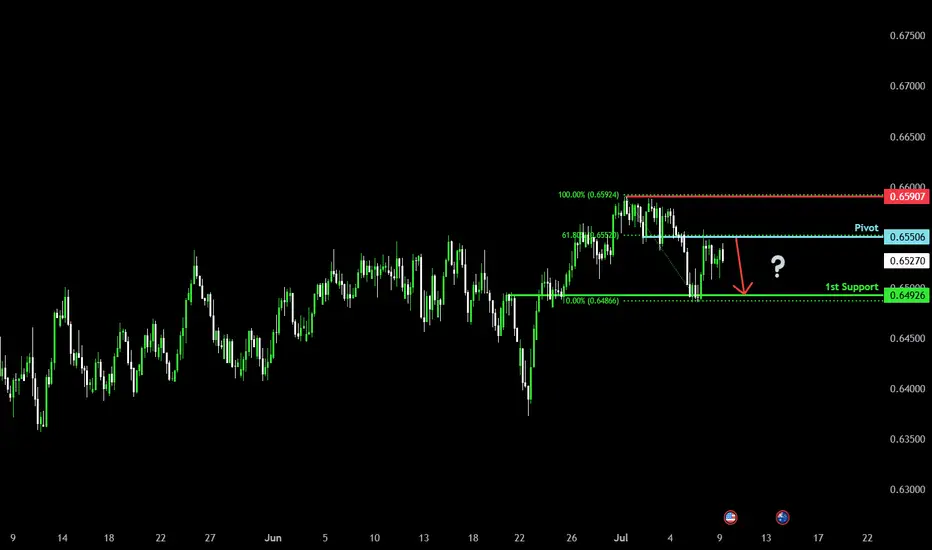
Bearish drop off 61.8% Fibonacci resistance?The Aussie (AUD/USD) has rejected off the pivot, which acts as a pullback resistance, and could drop to the 1st support, which has been identified as an overlap support.
Pivot: 0.6550
1st Support: 0.6492
1st Resistance: 0.6590
Risk Warning:
Trading Forex and CFDs carries a high level of risk to your capital and you should only trade with money you can afford to lose. Trading Forex and CFDs may not be suitable for all investors, so please ensure that you fully understand the risks involved and seek independent advice if necessary.
Disclaimer:
The above opinions given constitute general market commentary, and do not constitute the opinion or advice of IC Markets or any form of personal or investment advice.
Any opinions, news, research, analyses, prices, other information, or links to third-party sites contained on this website are provided on an "as-is" basis, are intended only to be informative, is not an advice nor a recommendation, nor research, or a record of our trading prices, or an offer of, or solicitation for a transaction in any financial instrument and thus should not be treated as such. The information provided does not involve any specific investment objectives, financial situation and needs of any specific person who may receive it. Please be aware, that past performance is not a reliable indicator of future performance and/or results. Past Performance or Forward-looking scenarios based upon the reasonable beliefs of the third-party provider are not a guarantee of future performance. Actual results may differ materially from those anticipated in forward-looking or past performance statements. IC Markets makes no representation or warranty and assumes no liability as to the accuracy or completeness of the information provided, nor any loss arising from any investment based on a recommendation, forecast or any information supplied by any third-party.
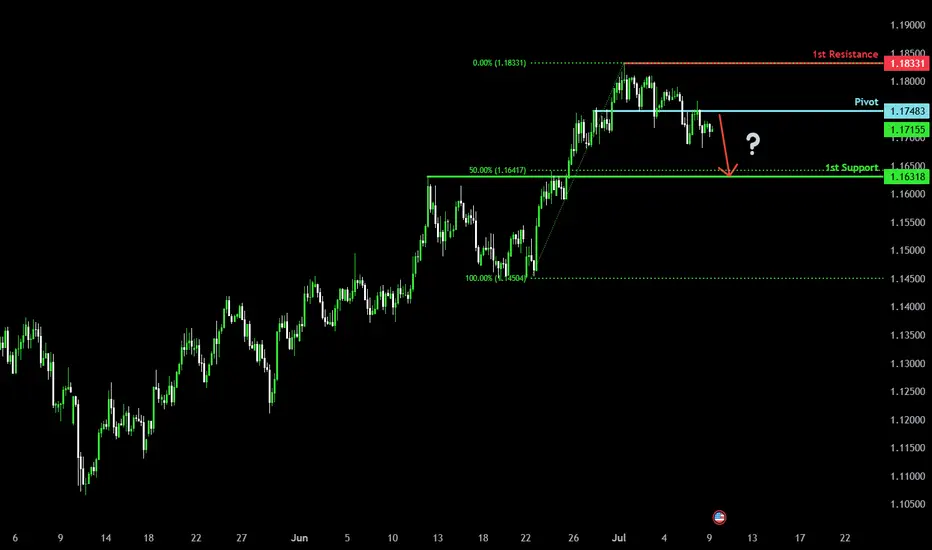
Bearish drop for the Fiber?The price has rejected off the pivot and could drop to the 50% Fibonacci support.
Pivot: 1.1748
1st Support: 1.1631
1st Resistance: 1.1833
Risk Warning:
Trading Forex and CFDs carries a high level of risk to your capital and you should only trade with money you can afford to lose. Trading Forex and CFDs may not be suitable for all investors, so please ensure that you fully understand the risks involved and seek independent advice if necessary.
Disclaimer:
The above opinions given constitute general market commentary, and do not constitute the opinion or advice of IC Markets or any form of personal or investment advice.
Any opinions, news, research, analyses, prices, other information, or links to third-party sites contained on this website are provided on an "as-is" basis, are intended only to be informative, is not an advice nor a recommendation, nor research, or a record of our trading prices, or an offer of, or solicitation for a transaction in any financial instrument and thus should not be treated as such. The information provided does not involve any specific investment objectives, financial situation and needs of any specific person who may receive it. Please be aware, that past performance is not a reliable indicator of future performance and/or results. Past Performance or Forward-looking scenarios based upon the reasonable beliefs of the third-party provider are not a guarantee of future performance. Actual results may differ materially from those anticipated in forward-looking or past performance statements. IC Markets makes no representation or warranty and assumes no liability as to the accuracy or completeness of the information provided, nor any loss arising from any investment based on a recommendation, forecast or any information supplied by any third-party.
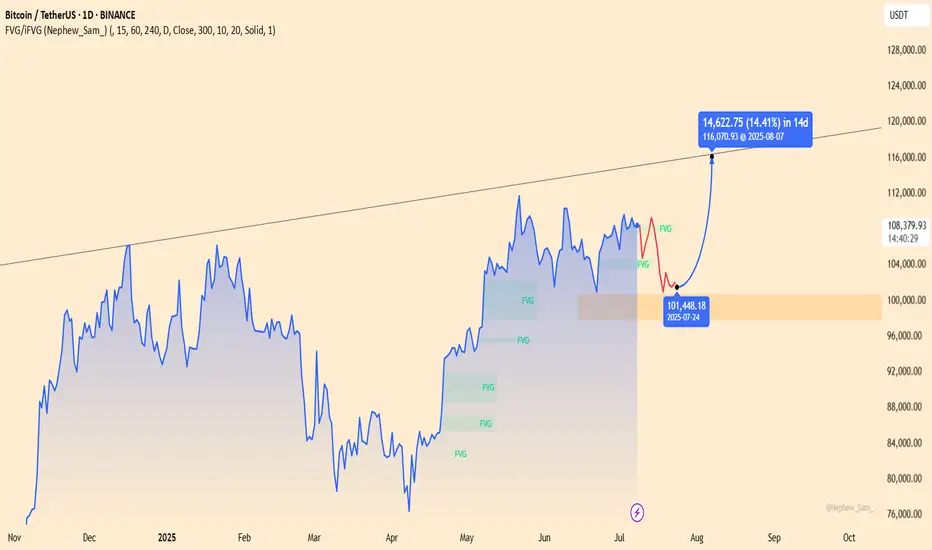
BTCUSDT – Ready to Launch from Accumulation Zone?BTCUSDT is consolidating around the $101,000 FVG zone – a previously strong launchpad. Price structure remains bullish, forming higher lows and showing a healthy throwback pattern.
If the $101,448 level holds, the next target could be $116,000 – a potential 14% rally in two weeks.
Fundamentals support the upside: expectations of Fed rate cuts and renewed ETF inflows are fueling fresh momentum for Bitcoin.
Still, watch for price action confirmation – and always manage your risk!
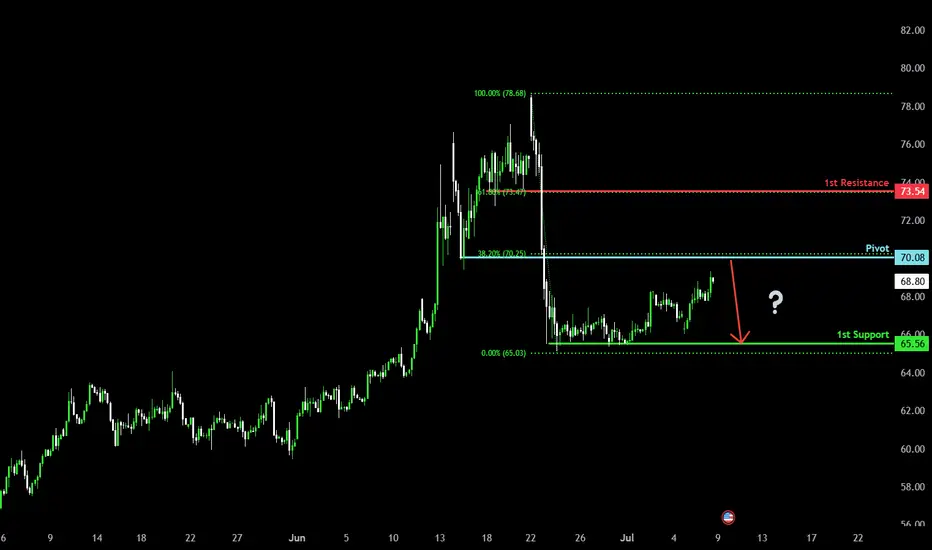
Bearish reversal off 38.2% Fibonacci resistance?WTI Oil (XTI/USD) is rising towards the pivot and could reverse to the 1st support which is a pullback support.
Pivot: 70.08
1st Support: 65.56
1st Resistance: 73.54
Risk Warning:
Trading Forex and CFDs carries a high level of risk to your capital and you should only trade with money you can afford to lose. Trading Forex and CFDs may not be suitable for all investors, so please ensure that you fully understand the risks involved and seek independent advice if necessary.
Disclaimer:
The above opinions given constitute general market commentary, and do not constitute the opinion or advice of IC Markets or any form of personal or investment advice.
Any opinions, news, research, analyses, prices, other information, or links to third-party sites contained on this website are provided on an "as-is" basis, are intended only to be informative, is not an advice nor a recommendation, nor research, or a record of our trading prices, or an offer of, or solicitation for a transaction in any financial instrument and thus should not be treated as such. The information provided does not involve any specific investment objectives, financial situation and needs of any specific person who may receive it. Please be aware, that past performance is not a reliable indicator of future performance and/or results. Past Performance or Forward-looking scenarios based upon the reasonable beliefs of the third-party provider are not a guarantee of future performance. Actual results may differ materially from those anticipated in forward-looking or past performance statements. IC Markets makes no representation or warranty and assumes no liability as to the accuracy or completeness of the information provided, nor any loss arising from any investment based on a recommendation, forecast or any information supplied by any third-party.
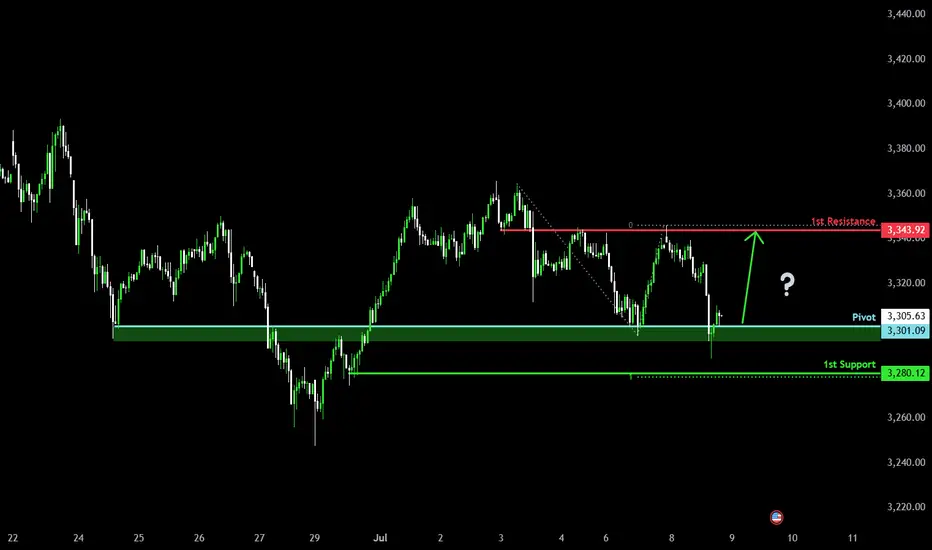
Bullish reversal off major support?The Gold (XAU/USD) has bounced off the pivot and could rise to the 1st resistance which is an overlap resistance.
Pivot: 3,301.09
1st Support: 3,280.12
1st Resistance: 3,343.92
Risk Warning:
Trading Forex and CFDs carries a high level of risk to your capital and you should only trade with money you can afford to lose. Trading Forex and CFDs may not be suitable for all investors, so please ensure that you fully understand the risks involved and seek independent advice if necessary.
Disclaimer:
The above opinions given constitute general market commentary, and do not constitute the opinion or advice of IC Markets or any form of personal or investment advice.
Any opinions, news, research, analyses, prices, other information, or links to third-party sites contained on this website are provided on an "as-is" basis, are intended only to be informative, is not an advice nor a recommendation, nor research, or a record of our trading prices, or an offer of, or solicitation for a transaction in any financial instrument and thus should not be treated as such. The information provided does not involve any specific investment objectives, financial situation and needs of any specific person who may receive it. Please be aware, that past performance is not a reliable indicator of future performance and/or results. Past Performance or Forward-looking scenarios based upon the reasonable beliefs of the third-party provider are not a guarantee of future performance. Actual results may differ materially from those anticipated in forward-looking or past performance statements. IC Markets makes no representation or warranty and assumes no liability as to the accuracy or completeness of the information provided, nor any loss arising from any investment based on a recommendation, forecast or any information supplied by any third-party.
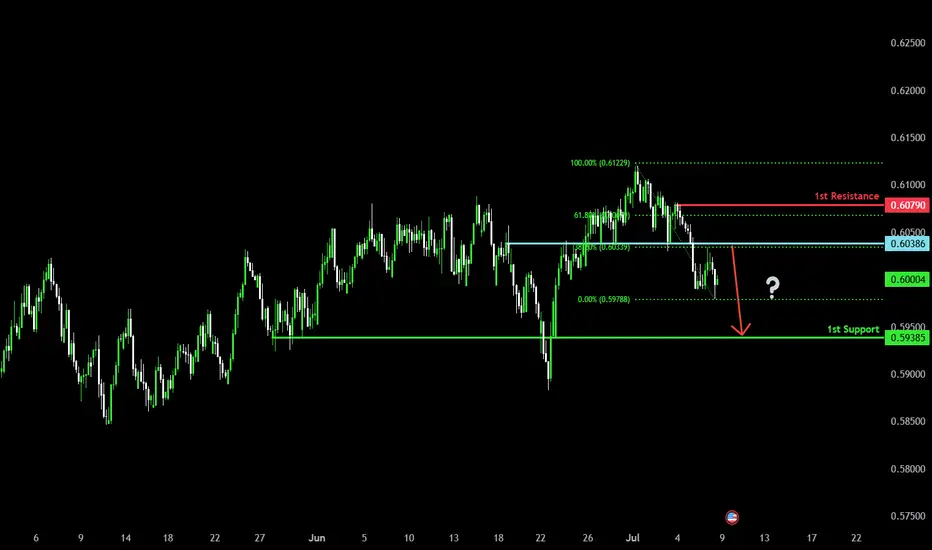
Bearish drop?The Kiwi (NZD/USD) has rejected off the pivot and could drop to the 1st support.
Pivot: 0.6038
1st Support: 0.5938
1st Resistance: 0.6079
Risk Warning:
Trading Forex and CFDs carries a high level of risk to your capital and you should only trade with money you can afford to lose. Trading Forex and CFDs may not be suitable for all investors, so please ensure that you fully understand the risks involved and seek independent advice if necessary.
Disclaimer:
The above opinions given constitute general market commentary, and do not constitute the opinion or advice of IC Markets or any form of personal or investment advice.
Any opinions, news, research, analyses, prices, other information, or links to third-party sites contained on this website are provided on an "as-is" basis, are intended only to be informative, is not an advice nor a recommendation, nor research, or a record of our trading prices, or an offer of, or solicitation for a transaction in any financial instrument and thus should not be treated as such. The information provided does not involve any specific investment objectives, financial situation and needs of any specific person who may receive it. Please be aware, that past performance is not a reliable indicator of future performance and/or results. Past Performance or Forward-looking scenarios based upon the reasonable beliefs of the third-party provider are not a guarantee of future performance. Actual results may differ materially from those anticipated in forward-looking or past performance statements. IC Markets makes no representation or warranty and assumes no liability as to the accuracy or completeness of the information provided, nor any loss arising from any investment based on a recommendation, forecast or any information supplied by any third-party.
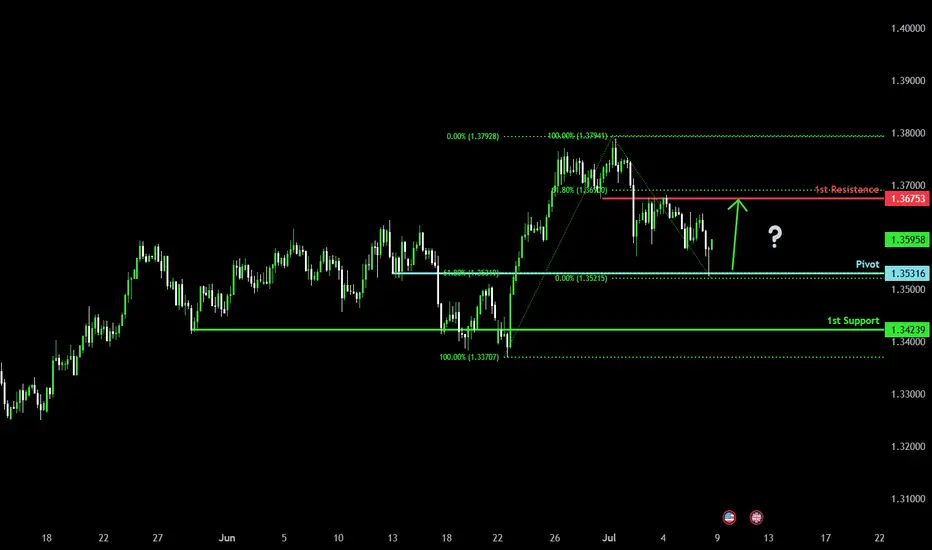
Bullish bounce?The Cable (GBP/USD) has bounced off the pivot and oculd rise to the 1st resistance which is a an overlap resistance.
Pivot: 1.3531
1st Support: 1.3423
1st Resistance: 1.3675
Risk Warning:
Trading Forex and CFDs carries a high level of risk to your capital and you should only trade with money you can afford to lose. Trading Forex and CFDs may not be suitable for all investors, so please ensure that you fully understand the risks involved and seek independent advice if necessary.
Disclaimer:
The above opinions given constitute general market commentary, and do not constitute the opinion or advice of IC Markets or any form of personal or investment advice.
Any opinions, news, research, analyses, prices, other information, or links to third-party sites contained on this website are provided on an "as-is" basis, are intended only to be informative, is not an advice nor a recommendation, nor research, or a record of our trading prices, or an offer of, or solicitation for a transaction in any financial instrument and thus should not be treated as such. The information provided does not involve any specific investment objectives, financial situation and needs of any specific person who may receive it. Please be aware, that past performance is not a reliable indicator of future performance and/or results. Past Performance or Forward-looking scenarios based upon the reasonable beliefs of the third-party provider are not a guarantee of future performance. Actual results may differ materially from those anticipated in forward-looking or past performance statements. IC Markets makes no representation or warranty and assumes no liability as to the accuracy or completeness of the information provided, nor any loss arising from any investment based on a recommendation, forecast or any information supplied by any third-party.