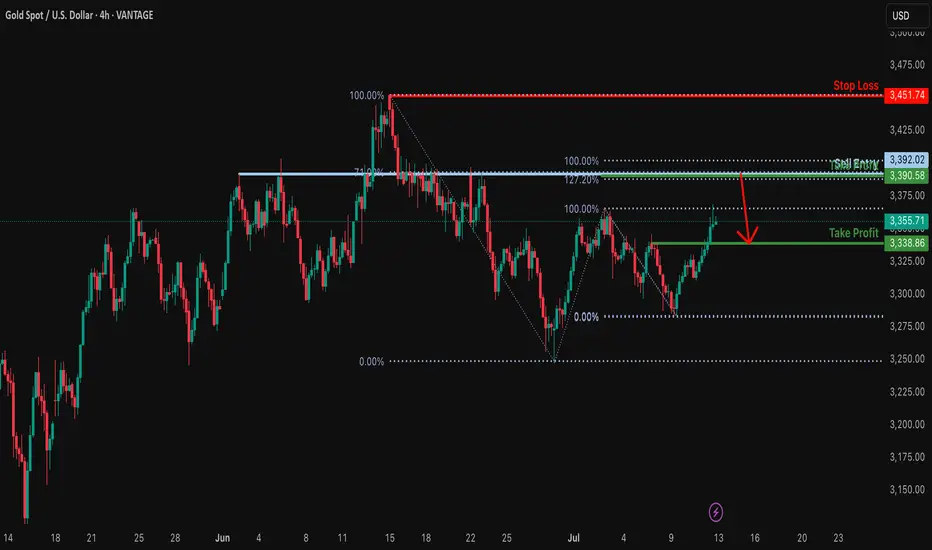
Heading into Fibonacci confluence?XAU/USD is rising towards the resistance level, which is a pullback resistance aligning with the 127.2% Fibonacci extension, the 71% Fibonacci retracement, and the 100% Fibonacci projection. A reversal from this level could lead to our take profit
Entry: 3,392.02
Why we like it:
There is a pullback resistance that lines up with the 127.2% Fibonacci extension, the 71% Fibonacci retracement and the 100% Fibonacci projection.
Stop loss: 3,451.74
Why we like it:
There is a pullback resistance.
Take profit: 3,338.86
Why we like it:
There is a pullback support.
Enjoying your TradingView experience? Review us!
Please be advised that the information presented on TradingView is provided to Vantage (‘Vantage Global Limited’, ‘we’) by a third-party provider (‘Everest Fortune Group’). Please be reminded that you are solely responsible for the trading decisions on your account. There is a very high degree of risk involved in trading. Any information and/or content is intended entirely for research, educational and informational purposes only and does not constitute investment or consultation advice or investment strategy. The information is not tailored to the investment needs of any specific person and therefore does not involve a consideration of any of the investment objectives, financial situation or needs of any viewer that may receive it. Kindly also note that past performance is not a reliable indicator of future results. Actual results may differ materially from those anticipated in forward-looking or past performance statements. We assume no liability as to the accuracy or completeness of any of the information and/or content provided herein and the Company cannot be held responsible for any omission, mistake nor for any loss or damage including without limitation to any loss of profit which may arise from reliance on any information supplied by Everest Fortune Group.
J-XAU
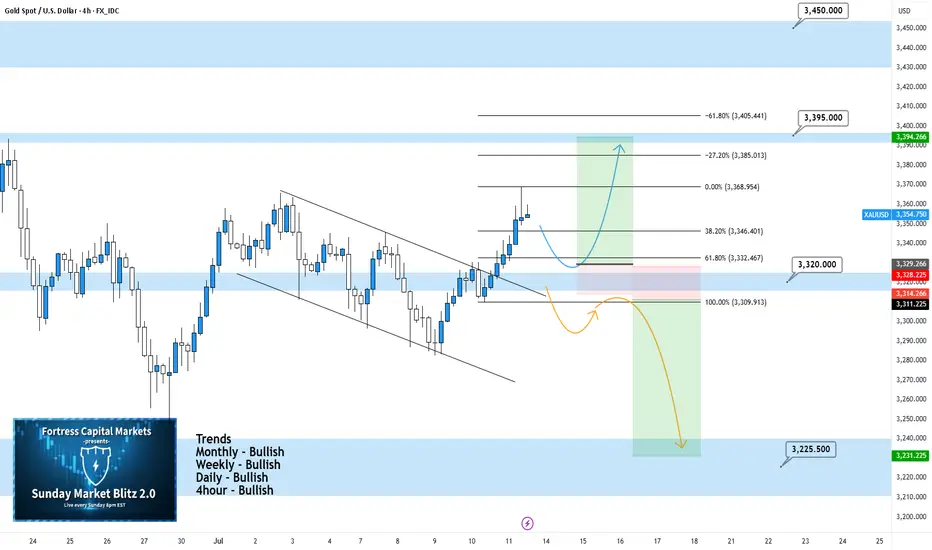
XAUUSD 4Hour TF - July 13th, 2025XAUUSD 7/13/2025
XAUUSD 4 hour Long Idea
Monthly - Bullish
Weekly - Bullish
Daily - Bullish
4hour - Bullish
Gold is looking pretty bullish this week as we saw a significant push above our 3,320.000 resistance zone. Looking to ride that same trend through this next week.
Bullish continuation - After a nice rally last week gold looks primed for another long setup. Ideally, price action goes for the retest of 3,320.000 and forms a higher low. This would confirm bullish structure and we can begin targeting higher toward major levels of resistance.
Bearish Reversal - For us to consider bearish setups we would first need to see a break back below 3,320.000 followed by a confirmed lower high. If this happens we can consider short positions and look to target lower toward major levels of support.
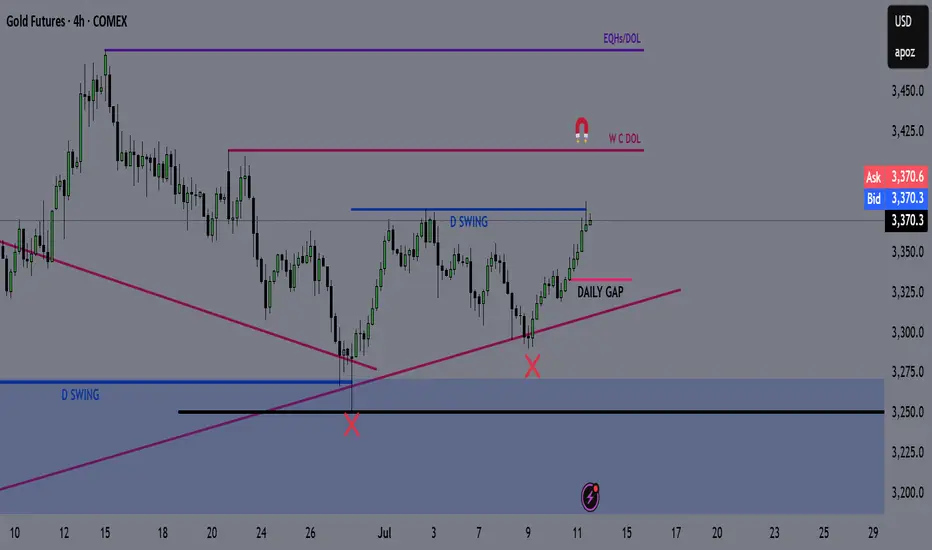
GOLD - GC | Weekly Recap & Plan 13.07.2025🟡 GOLD (GC) Weekly Recap & Outlook
Symbol: GC1!
Date: Week of July 8–12, 2025
Timeframes Used: 4H, Daily, Weekly, HTF structure
🔍 What Happened Last Week?
Gold saw a strong rejection from a confluence of two HTF trendlines, signaling resistance.
But that move was absorbed by:
🟦 Daily Demand (blue zone)
🔵 Daily Swing Liquidity (blue line)
This builds a bullish structure on the daily chart.
🧭 Scenarios I'm Watching
Scenario 1 — Minor Pullback:
🔹 Price may revisit the Daily Gap (pink line) and find support for continuation.
Scenario 2 — Deeper Pullback:
🟣 Price could retrace into the HTF bullish trendline (purple) before resuming upside.
🗞️ Bonus Macro Scenario: Powell Resignation?
There are growing rumors that Fed Chair Powell might resign this week.
📈 If that happens, I expect strong bullish momentum in Gold —
→ very limited retracement, and
→ potential straight breakout into new highs.
🎯 Targets for the Week:
✅ 1st Target:
W C DOL (purple line) → acts as a primary take profit area.
✅ 2nd Target (Expansion):
EQHs / DOL (extended purple levels)
Game Plan:
Watch for LTF confirmation on both retracement zones.
Maintain bullish bias unless Daily Demand fails.
If Powell resigns, be ready for breakout setups.
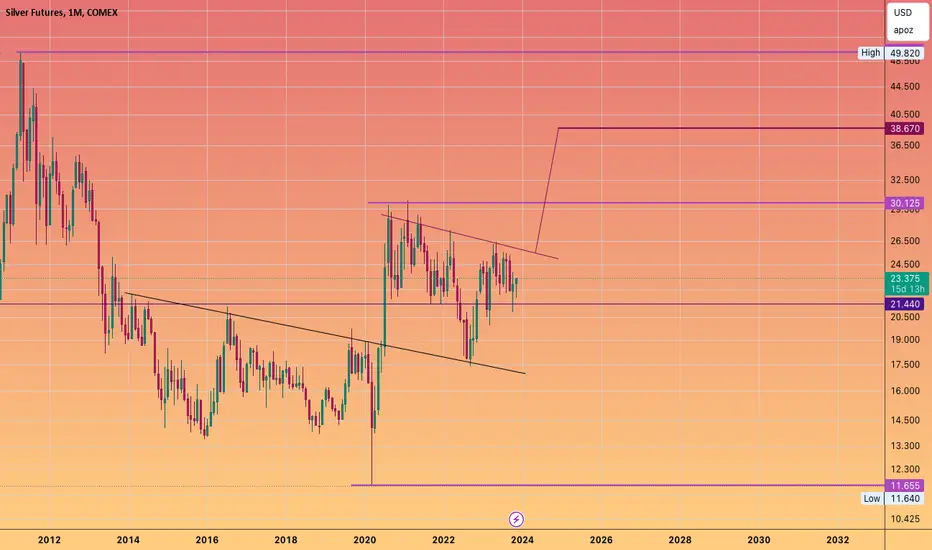
Silver to $38The move from March 2020 to August 2020
Was a measured move that played out to the Tee.
We have a similar structure building that projects to the High 30's
Suggesting #Gold move beyond ATH's and #Silver the beta play to move faster in an attempt to catch up, and move towards it's high's again.
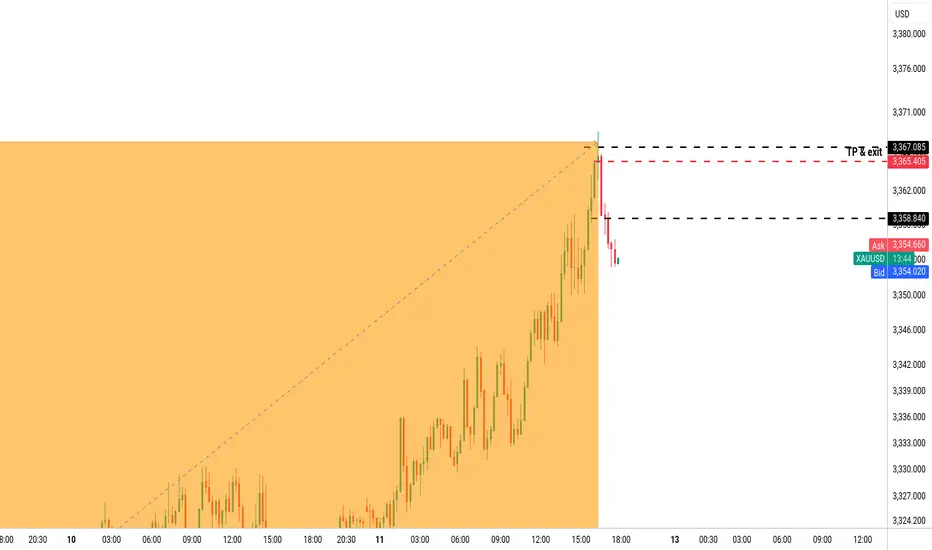
Update on: "XAU USD a little & nice BUY set up" 11-07-2025Quick update : I did "collect" a bit earlier (Unlucky I haven't got possibility to monitor trade all the way down today ), TP @ 3365.405.... Like I said earlier, a little & nice trade!
Also, did hit TP around - 3367.188 as promised ! AAA+ trade !
All analysis is based on technical analysis only...
Short & clear without any "BS"...
I do not believe in fundamental analysis (& if you are desperate for it, then... gold is never going to get cheaper in a very long term & it is a good investment for the next 50-100+ years, if you are happy with "preserving" your wealth, but if you are looking get paid this or next week, then...trading is a way. )
All of you have a lovely weekend ( with a nice profit in the pocket ! )
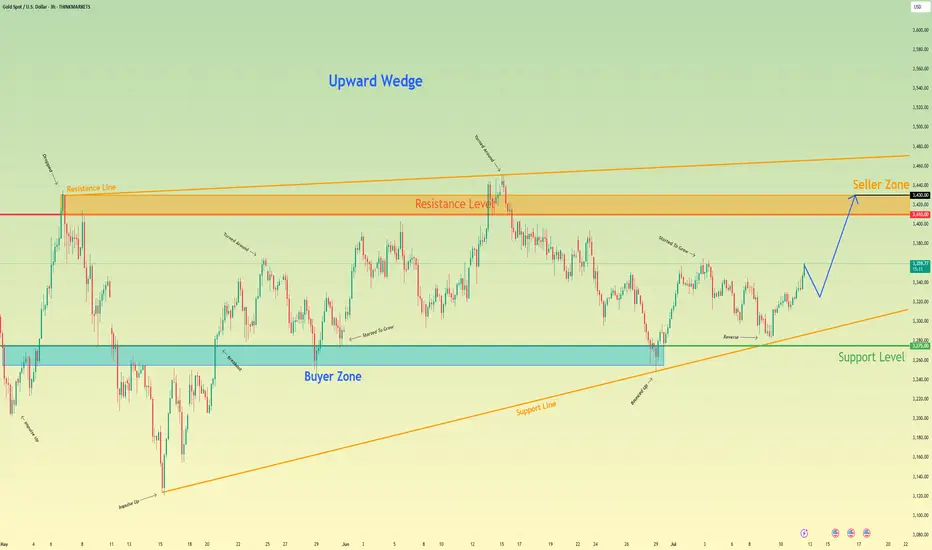
Gold can reach resistance level, break it and continue to riseHello traders, I want share with you my opinion about Gold. Recently, price formed a clean upward wedge pattern and is showing strong bullish behaviour. After bouncing off the support level at 3275, the price entered the buyer zone (3255 - 3275) and reversed with a confident impulse up, signalling renewed interest from buyers. From there, price has consistently respected the support line, printing higher lows and slowly climbing back toward the resistance level at 3410. This level has acted as a significant rejection area before, but this time, the structure looks stronger. Each pull-back has been shallow, and buyers are stepping in faster. The momentum is slowly building. Now the price is trading just below resistance and moving with a bullish trajectory. I expect Gold to continue its climb, first reaching the Resistance Level, and then targeting the seller zone (3410 - 3430). That’s why I’ve set my TP at 3430 points - right inside this upper area where I anticipate profit-taking and potential reversal. Given the bullish pattern structure, the wedge formation, and the strength of recent impulses, I stay bullish and expect further growth in the coming sessions. Please share this idea with your friends and click Boost 🚀
Disclaimer: As part of ThinkMarkets’ Influencer Program, I am sponsored to share and publish their charts in my analysis.
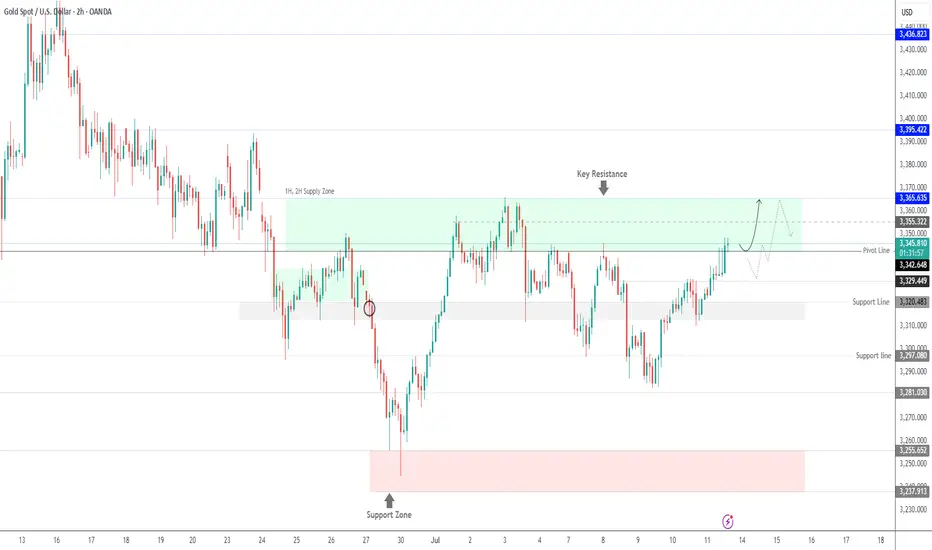
Gold Bullish Above 3342 – Watching 3365 BreakoutGold Futures Rise on Trade & Geopolitical Tensions
Gold continues to gain as renewed tariff threats from the U.S. and rising geopolitical risks weigh on market sentiment.
While markets have become somewhat desensitized to Trump’s recurring trade rhetoric, concerns remain that resolutions may be delayed.
Technical Outlook:
As long as the price holds above 3342, the bullish trend is likely to continue toward 3355 and 3365.
A stable close above 3365 would open the way to 3395.
However, a 1H close below 3342 may trigger a pullback to 3329.
Pivot: 3342
Resistance: 3355, 3365, 3395
Support: 3329, 3319, 3309
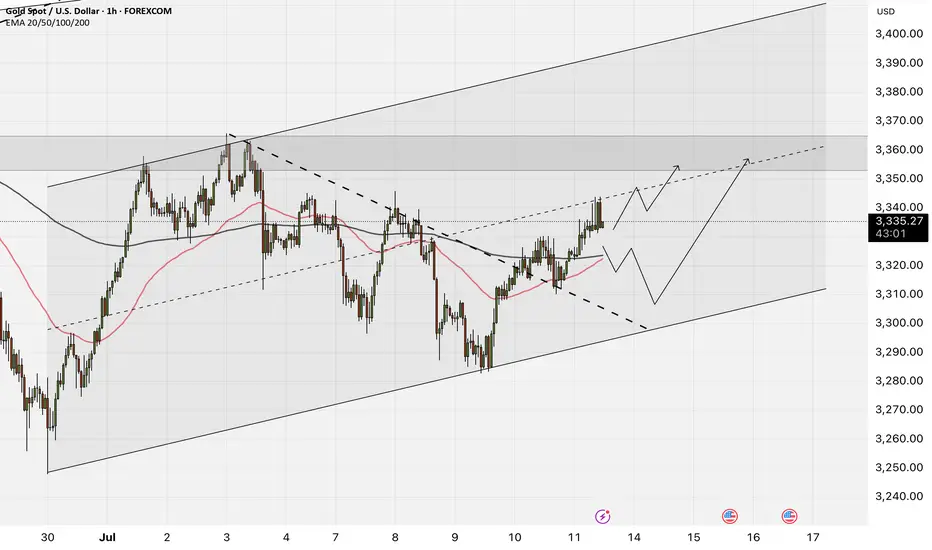
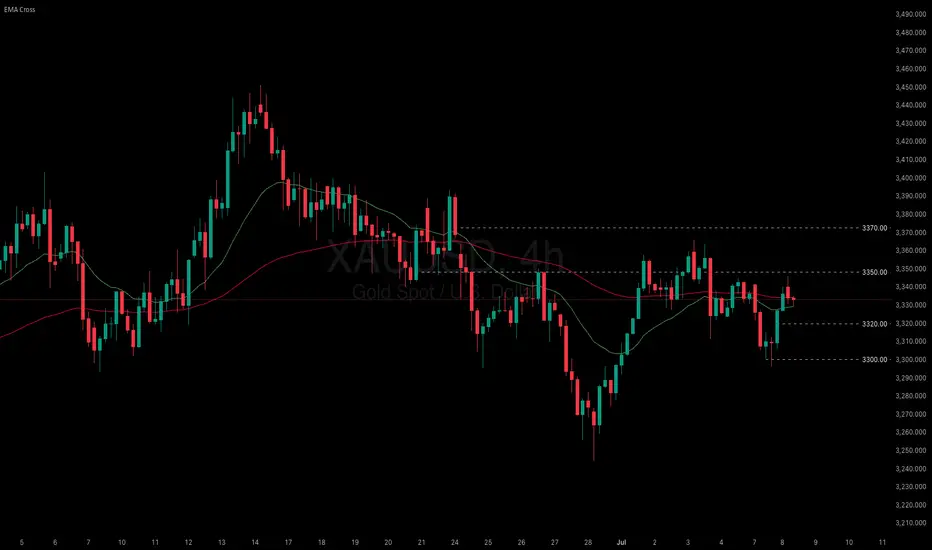
XAUUSD - Will Gold Continue Its Rise?!Gold is trading above the EMA200 and EMA50 on the hourly chart and is trading in its ascending channel. We still have a bullish view on this commodity and we can expect to see $3,350. A correction towards the bottom of the ascending channel will also provide us with a better risk-reward buying opportunity.
According to the World Gold Council, physically backed gold ETFs attracted around $38 billion in investments during the first half of 2025. This marks the largest semi-annual inflow since the beginning of 2020. The remarkable surge is primarily attributed to heightened investor demand for safe-haven assets amid escalating economic and trade tensions triggered by President Trump’s tariff policies.
During this period, the total gold holdings of these funds grew by 397.1 tonnes, bringing their global assets to 3,615.9 tonnes by the end of June—the highest level since August 2022, although still below the all-time high of 3,915 tonnes recorded in October 2020.
U.S.-based funds led the inflows with an addition of 206.8 tonnes, while Asian funds—despite accounting for only 9% of total assets—captured 28% of global inflows, highlighting a significant rise in interest among Asian investors in gold.
This positive trend emerged after three consecutive years of outflows between 2021 and 2023, followed by modest inflows in 2024. Concurrently, gold prices have surged by 26%, reaching a record high of $3,500 per ounce in April.
The World Gold Council, established in 1987 and headquartered in London, is funded by major gold mining companies. Its main objectives include boosting global demand for gold, enhancing market accessibility, and promoting innovation within the gold industry. The council plays a crucial role in shaping global perceptions of gold as a financial asset.
However, some analysts argue that the council essentially functions as a powerful lobbying group for mining corporations, often releasing reports designed to bolster demand and foster a positive market sentiment toward gold.
On the other hand, Bank of America (BofA), in its latest report using a global trading time framework, analyzed the outlook for the U.S. dollar in the second half of 2025. Despite the dollar having its worst start to a year since 1973, the report suggests that selling pressures on the currency may ease going forward, particularly during U.S. trading hours.
U.S. Trading Hours and Federal Reserve Policy
The dollar’s cumulative performance during U.S. trading hours remains strongly correlated—at 71%—with Federal Reserve interest rate pricing. Given expectations for stable rates throughout the rest of the year, the dollar could find some support during this time frame.
Asia: The Main Driver of Dollar Selling in H1 2025
Asian investors were the largest sellers of the dollar during the first half of 2025. However, after fully unwinding the long positions accumulated over the past two years, dollar performance in Asian trading hours has now turned neutral. Fresh selling may remain limited unless new bearish catalysts emerge.
Europe: Tied to Global Equities’ Performance
Dollar weakness during European trading hours largely depends on the relative strength of global equities versus U.S. stocks. As U.S. equities reclaimed market leadership in the second quarter, European investors may have less incentive to continue selling dollars.
Decline in Currency Hedging Appetite
Following the dollar’s significant drop in the first half of the year, foreign investors are now less inclined to increase currency hedges on their dollar-denominated assets.
According to Bank of America’s trading time framework, the pace of the dollar’s decline is likely to slow in the second half of the year, especially during U.S. trading hours, as stable Federal Reserve policy removes a key bearish factor. Selling pressure from Asia is also expected to ease unless new downside triggers arise. The key variable going forward will be the relative performance of global equities versus U.S. markets.
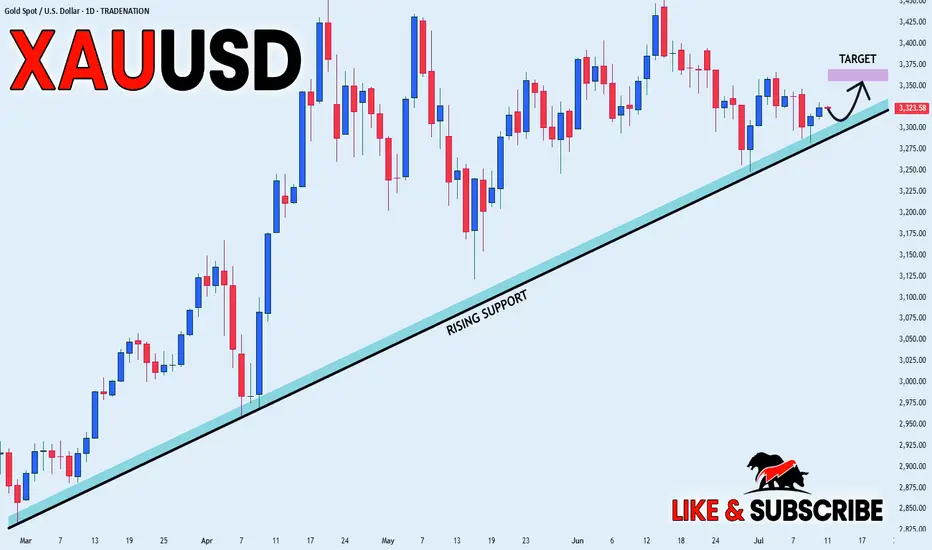
GOLD SWING LONG|
✅GOLD is trading in a strong
Long-term uptrend along the
Rising support line so we are
Bullish biased and after the price
Breakout of the local opening wedge
We we will be expecting a
Further bullish move up
LONG🚀
✅Like and subscribe to never miss a new idea!✅
Disclosure: I am part of Trade Nation's Influencer program and receive a monthly fee for using their TradingView charts in my analysis.
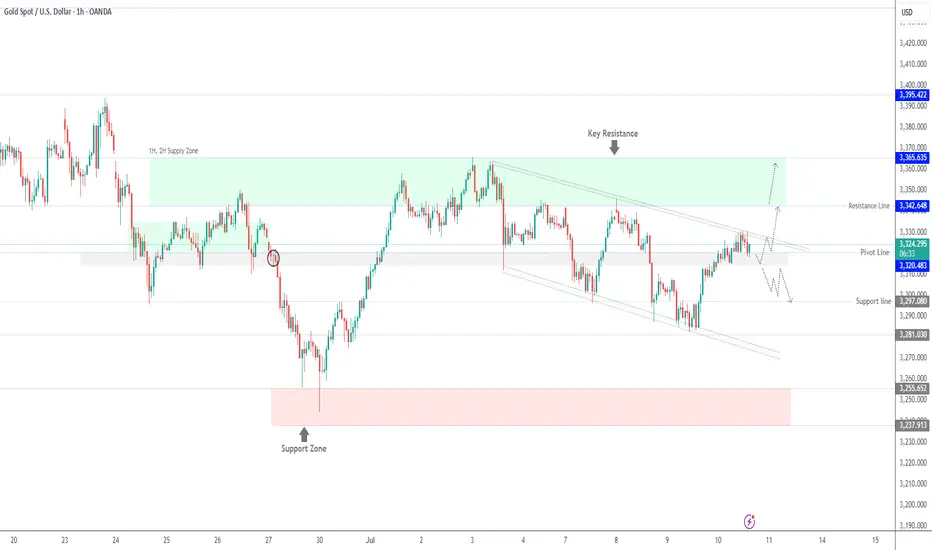
Gold Eyes 3365 as Tariff Tensions Support Bullish MomentumGOLD OVERVIEW
Gold extended gains to around $3,329 amid a weaker dollar and ongoing tariff tensions, with markets reacting to new U.S. trade actions and divided Fed minutes on rate cuts.
Technical Outlook:
Gold remains bullish while above 3320.
A 1H close above 3342 opens the door to 3365.
A 1H close below 3314 will turn sentiment bearish toward 3297 and potentially 3282.
Resistance: 3330, 3342, 3365
Support: 3309, 3297, 3282
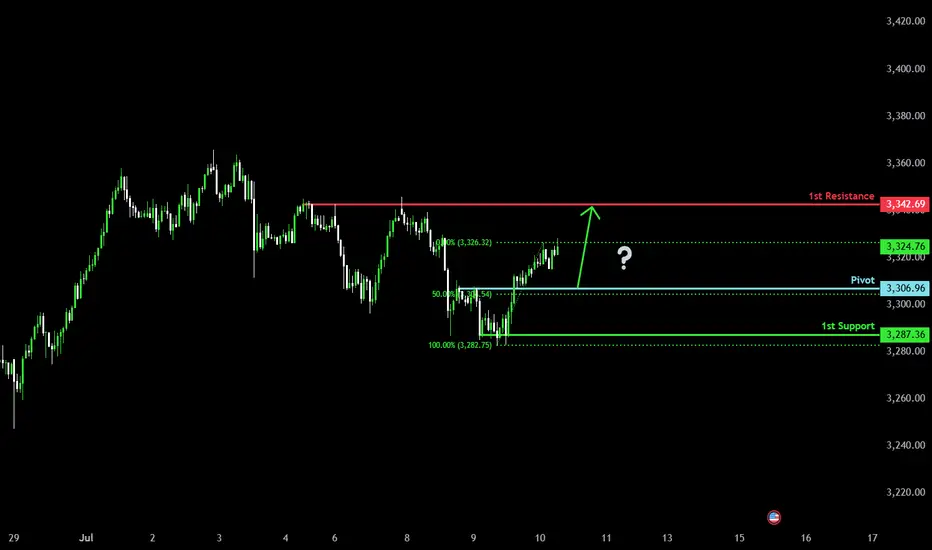
Falling towards 50% Fibonacci supprt?The Gold (XAU/USD) is falling towards the pivot and could bounce to the 1st resistance which is a pullback resistance.
Pivot: 3,306.96
1st Support: 3,287.36
1st Resistance: 3,342.69
Risk Warning:
Trading Forex and CFDs carries a high level of risk to your capital and you should only trade with money you can afford to lose. Trading Forex and CFDs may not be suitable for all investors, so please ensure that you fully understand the risks involved and seek independent advice if necessary.
Disclaimer:
The above opinions given constitute general market commentary, and do not constitute the opinion or advice of IC Markets or any form of personal or investment advice.
Any opinions, news, research, analyses, prices, other information, or links to third-party sites contained on this website are provided on an "as-is" basis, are intended only to be informative, is not an advice nor a recommendation, nor research, or a record of our trading prices, or an offer of, or solicitation for a transaction in any financial instrument and thus should not be treated as such. The information provided does not involve any specific investment objectives, financial situation and needs of any specific person who may receive it. Please be aware, that past performance is not a reliable indicator of future performance and/or results. Past Performance or Forward-looking scenarios based upon the reasonable beliefs of the third-party provider are not a guarantee of future performance. Actual results may differ materially from those anticipated in forward-looking or past performance statements. IC Markets makes no representation or warranty and assumes no liability as to the accuracy or completeness of the information provided, nor any loss arising from any investment based on a recommendation, forecast or any information supplied by any third-party.
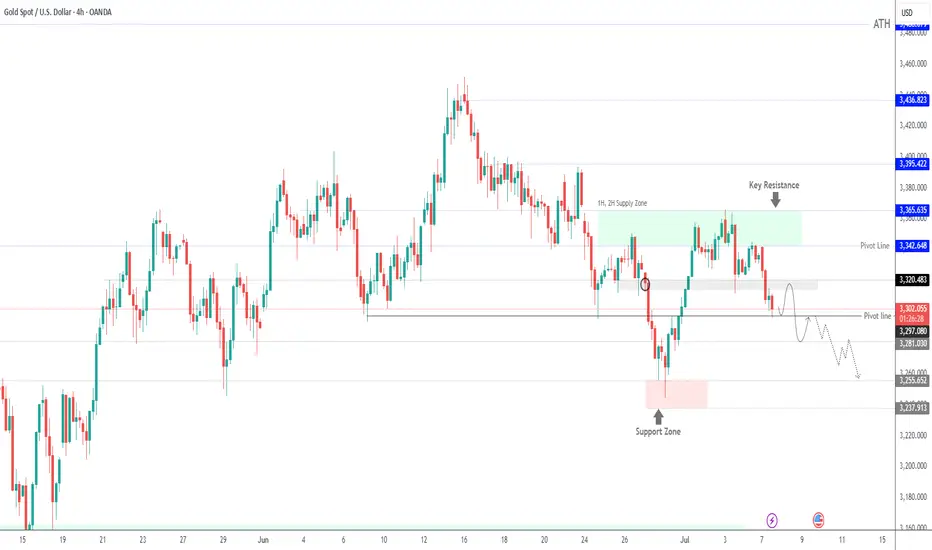
Gold Under Pressure as Dollar Strengthens – Watch Below 3297FX:XAUUSD – Technical & Fundamental Outlook
Gold prices declined on Monday, pressured by a stronger U.S. dollar following President Trump’s announcement of a potential 10% tariff on BRICS-aligned countries. The news supported the dollar and weakened demand for gold as a safe-haven asset.
Although uncertainty remains around U.S. trade negotiations ahead of the July 9 tariff deadline, signals of possible extensions and staggered implementation have further reduced short-term haven flows into gold.
Technical View:
Gold remains under bearish pressure while trading below 3320.
As long as the price stays under this level, we expect sideways consolidation between 3297 and 3320 until a breakout occurs.
A 1H close below 3297 would confirm bearish continuation, targeting 3281 and 3255.
A break above 3320 would invalidate the bearish outlook and shift momentum toward 3342.
Pivot: 3297
Support Levels: 3281 / 3255 / 3239
Resistance Levels: 3314 / 3320 / 3342
Previous idea: Click Here...
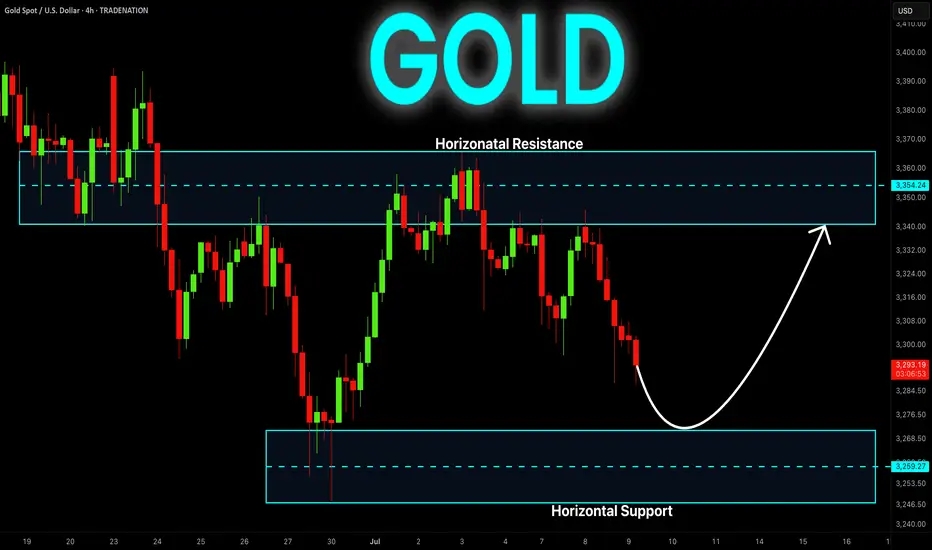
GOLD Long Inside The Range! Buy!
Hello,Traders!
GOLD is stuck in a local
Range while still trading
In a strong long-term uptrend
So we think that this is an
Accumulation before the
Next leg up and as we are
Bullish biased we will be
Expecting a retest and a
Rebound from the horizontal
Support below around 3259$
With the target of retesting
The horizontal resistance
Above around 3354$
Buy!
Comment and subscribe to help us grow!
Check out other forecasts below too!
Disclosure: I am part of Trade Nation's Influencer program and receive a monthly fee for using their TradingView charts in my analysis.
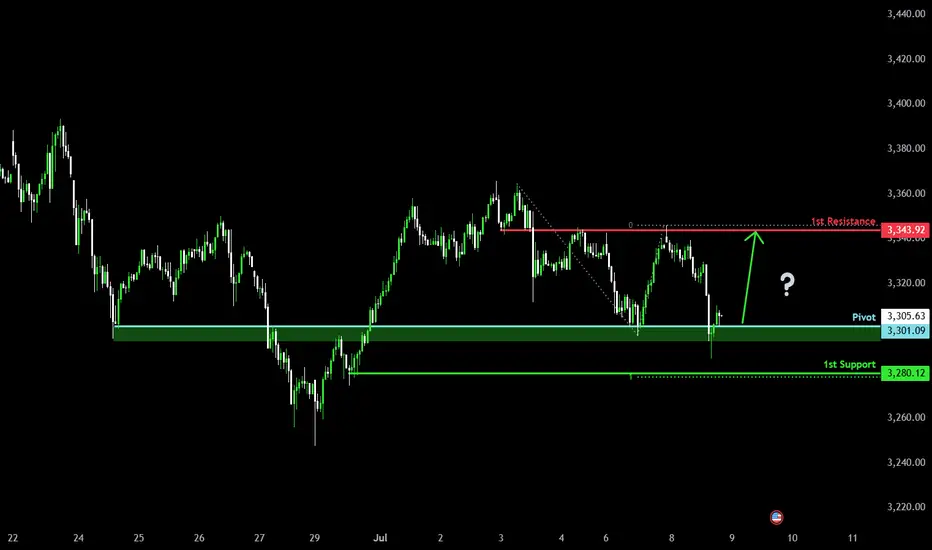
Bullish reversal off major support?The Gold (XAU/USD) has bounced off the pivot and could rise to the 1st resistance which is an overlap resistance.
Pivot: 3,301.09
1st Support: 3,280.12
1st Resistance: 3,343.92
Risk Warning:
Trading Forex and CFDs carries a high level of risk to your capital and you should only trade with money you can afford to lose. Trading Forex and CFDs may not be suitable for all investors, so please ensure that you fully understand the risks involved and seek independent advice if necessary.
Disclaimer:
The above opinions given constitute general market commentary, and do not constitute the opinion or advice of IC Markets or any form of personal or investment advice.
Any opinions, news, research, analyses, prices, other information, or links to third-party sites contained on this website are provided on an "as-is" basis, are intended only to be informative, is not an advice nor a recommendation, nor research, or a record of our trading prices, or an offer of, or solicitation for a transaction in any financial instrument and thus should not be treated as such. The information provided does not involve any specific investment objectives, financial situation and needs of any specific person who may receive it. Please be aware, that past performance is not a reliable indicator of future performance and/or results. Past Performance or Forward-looking scenarios based upon the reasonable beliefs of the third-party provider are not a guarantee of future performance. Actual results may differ materially from those anticipated in forward-looking or past performance statements. IC Markets makes no representation or warranty and assumes no liability as to the accuracy or completeness of the information provided, nor any loss arising from any investment based on a recommendation, forecast or any information supplied by any third-party.
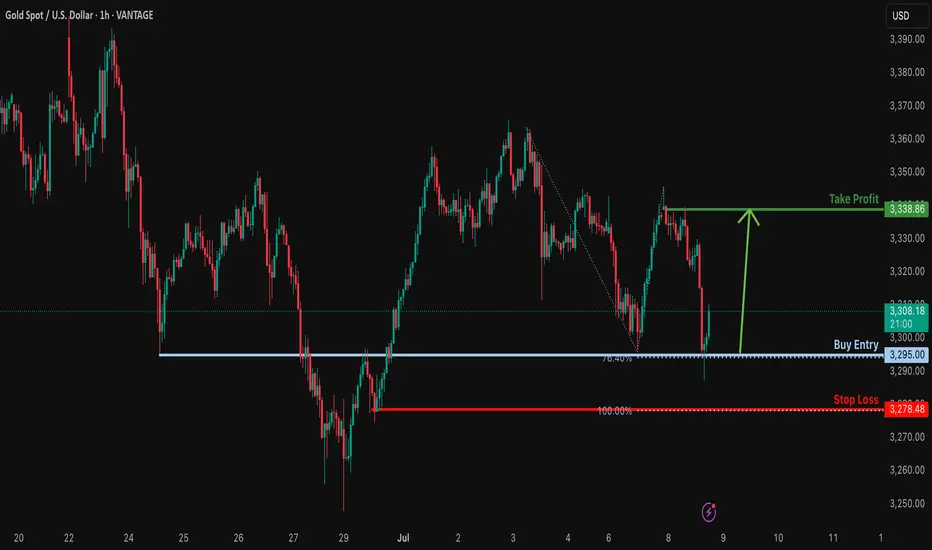
Bullish reversal off major support?XAU/USD has bounced off the support level which is an overlap support that lines up with the 76.4% Fibonacci projection and could rise from this level to our take profit.
Entry: 33,295.00
Why we like it:
There is an overlap support level that lines up with the 76.4% Fibonacci projection.
Stop loss: 3,278.48
Why we like it:
There is a pullback support level that aligns with the 100% Fibonacci projection.
Take profit: 3,338.86
Why we like it:
There is a pullback resistance level.
Enjoying your TradingView experience? Review us!
Please be advised that the information presented on TradingView is provided to Vantage (‘Vantage Global Limited’, ‘we’) by a third-party provider (‘Everest Fortune Group’). Please be reminded that you are solely responsible for the trading decisions on your account. There is a very high degree of risk involved in trading. Any information and/or content is intended entirely for research, educational and informational purposes only and does not constitute investment or consultation advice or investment strategy. The information is not tailored to the investment needs of any specific person and therefore does not involve a consideration of any of the investment objectives, financial situation or needs of any viewer that may receive it. Kindly also note that past performance is not a reliable indicator of future results. Actual results may differ materially from those anticipated in forward-looking or past performance statements. We assume no liability as to the accuracy or completeness of any of the information and/or content provided herein and the Company cannot be held responsible for any omission, mistake nor for any loss or damage including without limitation to any loss of profit which may arise from reliance on any information supplied by Everest Fortune Group.
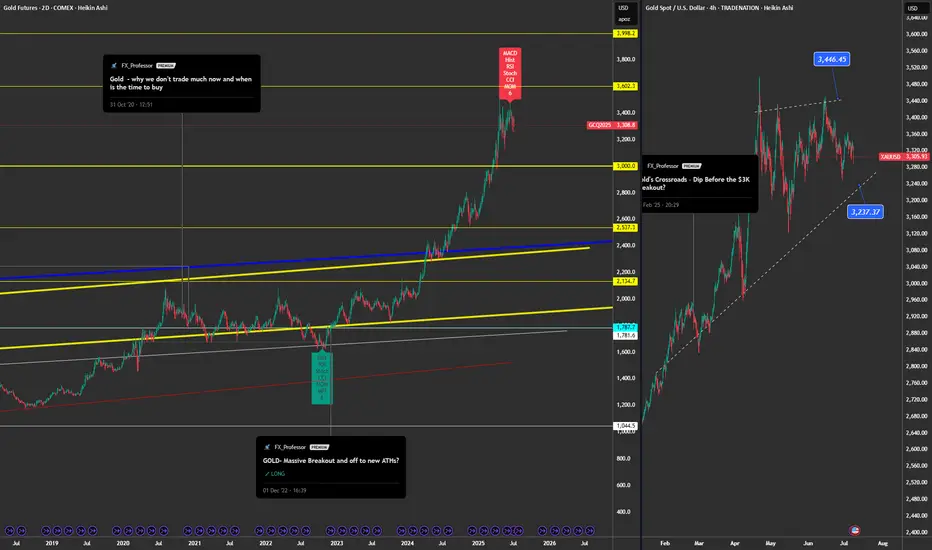
Goldman Says $4K – My Chart Says Sell💥📉 Gold Analysis – Divergences, Resistance, and a Short Bias 🪙⚠️
Hey Traders,
As promised in the latest video, here's the official chart update for Gold – and the message is clear: I'm short.
📊 What I See on the Chart
We're now well below the 3,446 resistance, with early signs of weakness showing up across multiple timeframes. I’ve laid out both the 2-Day and 4H charts in this post, and here’s what I’m tracking:
⚠️ Technical Warning Signs:
🔻 2D chart: Six bearish divergences
– RSI, Stochastic, CCI, OBV, MFI, and MACD all flashing red
📉 1D chart: Same thing — six divergences, telling me momentum is fading
⏳ 4H chart: Price action breaking trendlines, and support at 3,237 looks shaky
🚨 If that breaks, my main support zone is at $3,000 – and that’s where I believe we’re heading.
This is not just a pullback. This is the kind of confluence you can’t ignore if you trade technically.
🔁 Sentiment Shift
Back in December '22 and again earlier this year, I was long Gold – and it was the right call. But now?
📌 This chart has gone from momentum to exhaustion.
📌 I see less demand, softer momentum, and strong bearish divergence stacking across every major timeframe I watch.
🎯 Trade View
✅ I’m short Gold.
🎯 Targeting the $3,000–3,050 zone.
📉 Invalidated if we reclaim and close above $3,446 with strength.
It’s that simple. Nothing personal – just structure, divergence, and flow.
🧠 The Chart vs. The Narrative
Recently, I saw a note from Goldman Sachs forecasting $4,000 Gold. Maybe they’re right.
But I’ll be honest with you – I don’t buy the media hype.
I'm not here for the headlines.
I'm a chart guy. Always have been. Always will be.
The chart is the map to the treasure – and that’s the only thing I follow.
🧠 I cover this and the broader macro setup (Dollar, BTC, DAX, Tech, BTC.D, and more) in the full 20-min video just dropped. If you haven’t watched it yet, go catch up — it explains the logic and why this isn’t just a gold story.
One Love,
The FXPROFESSOR 💙
Disclosure: I am happy to be part of the Trade Nation's Influencer program and receive a monthly fee for using their TradingView charts in my analysis. Awesome broker, where the trader really comes first! 🌟🤝📈
Gold Recovers on Safe-Haven Flows Amid U.S. Trade UncertaintyFX:XAUUSD – Market Overview
Fundamental Outlook:
Gold has recovered from prior losses, stabilizing on the back of renewed safe-haven demand amid escalating global trade tensions.
Analysts point to growing concerns over a broader U.S.-led trade war, which has pushed investors toward gold as a defensive asset. While President Trump has delayed the reimplementation of tariffs until August 1 to allow for negotiation, markets remain cautious, and volatility is expected to persist.
Technical Outlook:
Gold is currently trading above the pivot level at 3320, which has a consolidation within 3320 - 3342 range
Stability above 3342 would likely extend the rally toward 3365, with 3356 as an intermediate resistance.
However, a 1H candle close below 3320 could shift momentum back to bearish, targeting 3297 and 3281.
Support Levels: 3312 / 3297 / 3281
Resistance Levels: 3342 / 3356 / 3365
Is gold set to shine again as an inflation hedge?
Tariff tensions are flaring once more ahead of the scheduled end to mutual tariff suspensions. President Trump has announced that tariff rates on countries such as South Korea and Japan will increase to 25% starting in August.
This renewed threat has stoked concerns about inflation, pushing up Treasury yields. As trade war risks resurface, US Treasury prices have fallen—a move consistent with market expectations of front-loaded inflation driven by higher tariffs.
Adding to the pressure, Trump’s newly signed tax cut bill is expected to widen the fiscal deficit by $3.3 trillion over the next decade, according to the Congressional Budget Office (CBO).
XAUUSD is consolidating within a narrow range of 3320–3350. The price is hovering near both EMAs, awaiting an apparent trigger for a breakout. If XAUUSD breaks below the support at 3320, the price may retreat to 3300. Conversely, if XAUUSD breaches above the resistance at 3350, the price could extend its gains toward 3370.
GOLD RESISTANCE AHEAD|SHORT|
✅GOLD is going up now
But a strong resistance level is ahead at 3360$
Thus I am expecting a pullback
And a move down towards the target of 3325$
SHORT🔥
✅Like and subscribe to never miss a new idea!✅
Disclosure: I am part of Trade Nation's Influencer program and receive a monthly fee for using their TradingView charts in my analysis.
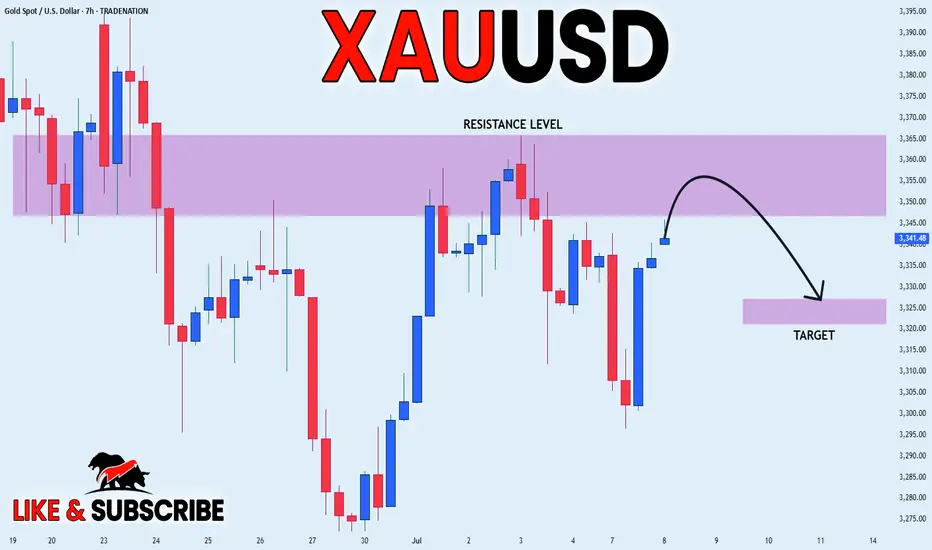
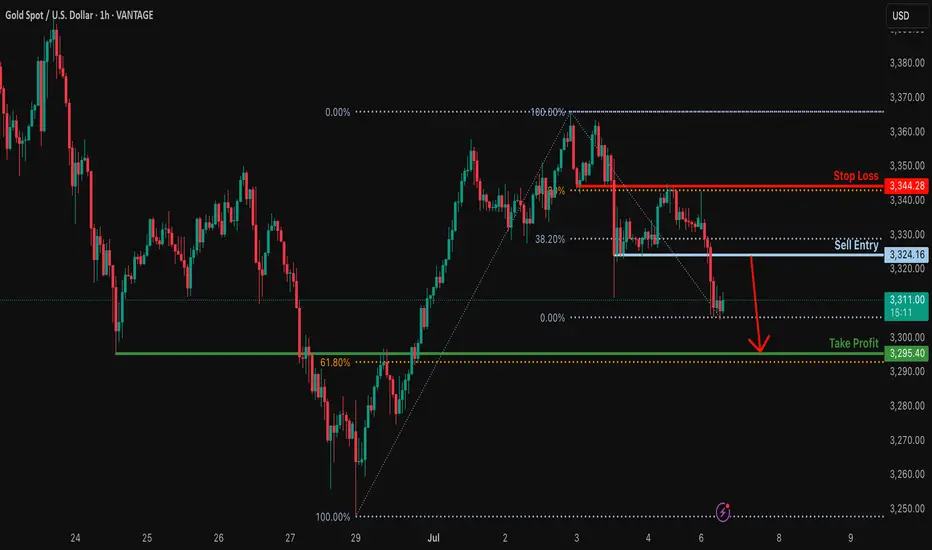
Bearish reversal off pullback resistance?XAU/USD is rising towards the resistance level which is a pullback resistance that is slightly below the 38.2% Fibonacci retracement and could drop from this level too ur take profit.
Entry: 3,324.16
Why we like it:
There is a pullback resistance level that is slightly below the38.2% Fibonacci retracement.
Stop loss: 3,344.28
Why we like it:
There is an overlap resistance level that aligns with the 61.8% Fibonacci retracement.
Takeprofit: 3,295.40
Why we like it:
There is a pullback support level that aligns with the 61.8% Fibonacci retracement.
Enjoying your TradingView experience? Review us!
Please be advised that the information presented on TradingView is provided to Vantage (‘Vantage Global Limited’, ‘we’) by a third-party provider (‘Everest Fortune Group’). Please be reminded that you are solely responsible for the trading decisions on your account. There is a very high degree of risk involved in trading. Any information and/or content is intended entirely for research, educational and informational purposes only and does not constitute investment or consultation advice or investment strategy. The information is not tailored to the investment needs of any specific person and therefore does not involve a consideration of any of the investment objectives, financial situation or needs of any viewer that may receive it. Kindly also note that past performance is not a reliable indicator of future results. Actual results may differ materially from those anticipated in forward-looking or past performance statements. We assume no liability as to the accuracy or completeness of any of the information and/or content provided herein and the Company cannot be held responsible for any omission, mistake nor for any loss or damage including without limitation to any loss of profit which may arise from reliance on any information supplied by Everest Fortune Group.
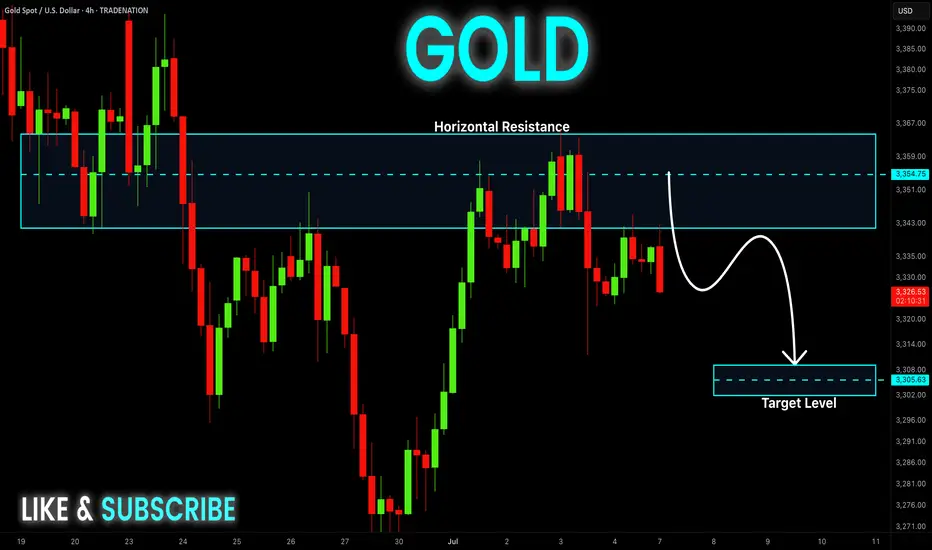
GOLD Short From Resistance! Sell!
Hello,Traders!
GOLD is weaker than we
Expected and failed to break
The key horizontal level
Around 3360$ and we are
Now seeing a bearish rejection
So we are locally bearish biased
And we will be expecting a
Further bearish move down
Sell!
Comment and subscribe to help us grow!
Check out other forecasts below too!
Disclosure: I am part of Trade Nation's Influencer program and receive a monthly fee for using their TradingView charts in my analysis.
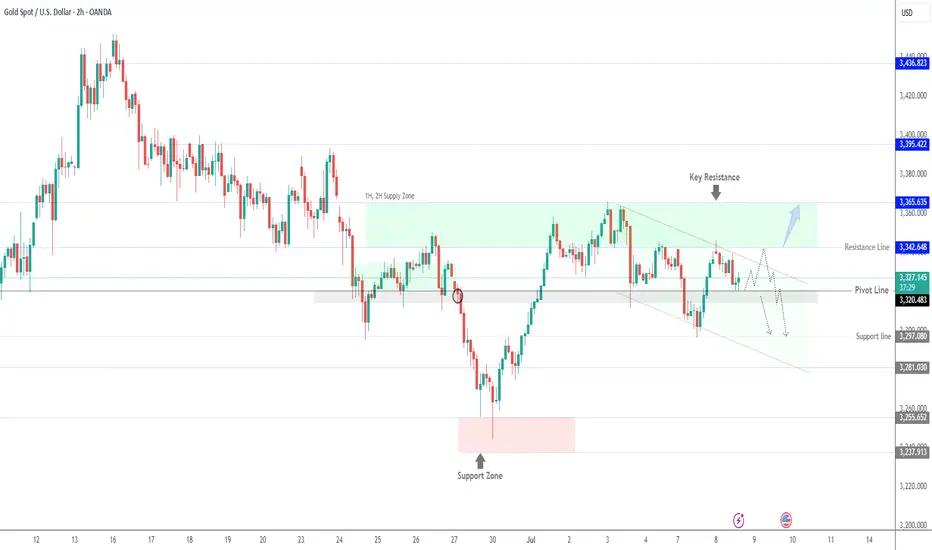
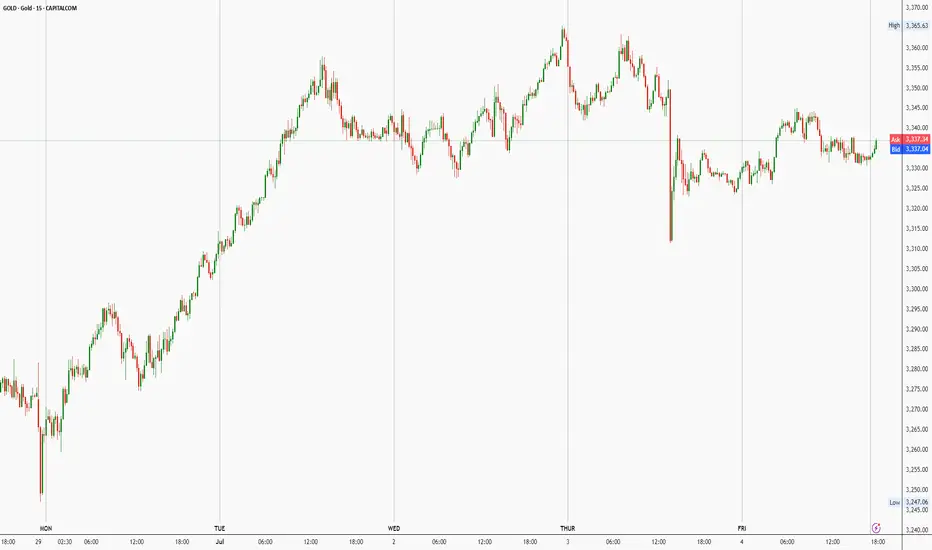
Inside My Gold Mind: Weekend Trade Log📌 Market Context / Bias
The majority of bullish price action on VELOCITY:GOLD occurred early in the week — specifically between Monday and Tuesday. From midweek through Friday, the market entered a period of consolidation, showing signs of compression.
Interestingly, despite positive economic data that favoured the USD, GOLD remained steady and resilient. This suggests underlying bullish pressure and potential accumulation.
My current bias is bullish going into the new week — with expectations of a price expansion to the upside.
🔍 Higher Timeframe Analysis
Weekly Candle: Shows early bullish expansion followed by consolidation — classic sign of absorption or reaccumulation.
Draw on Liquidity: Equal highs remain above, acting as a magnet for price.
FVGs: Price traded into a daily FVG earlier in the week and closed above it.
Order Block: Price respected a previous Bullish Order Block during Thursday’s retracement, reinforcing possible support.
🧩 Lower Timeframe Confluence
1H–4H: Price is forming relatively equal highs above the current range — potential liquidity targets.
Intraday Structure: No major shift to bearish order flow was confirmed; compression suggests a possible continuation move once expansion begins.
🧠 Fundamental Insight
Despite hawkish or strong USD fundamentals, GOLD held its ground. This divergence often precedes a strong move — likely driven by risk sentiment, upcoming Fed commentary, or global macro drivers.
🧠 Trade Plan Preview
Stay tuned for my daily updates where I’ll share:
My bias for the day
Market structure breakdown
Intraday trade plan (entry, targets, and session model)
⚠️ Reminder:
Trade with due diligence. This is not financial advice. Always align entries with your personal model and preferred session.
Thanks for your support!
If you found this idea helpful or insightful, please drop a like 👍 and leave a comment — I’d love to hear your thoughts! 🚀
Follow me for more daily price action insights and trading strategies on XAUUSD and other key markets.
Let’s grow and trade smarter together! 📈
⚠️ Disclaimer
This content is for educational and informational purposes only and does not constitute financial or investment advice.
All trading involves risk. You are solely responsible for your own decisions, so always conduct proper research and due diligence before taking any trades.
Past performance is not indicative of future results. Trade responsibly.
May your final trades of the week be precise and profitable.
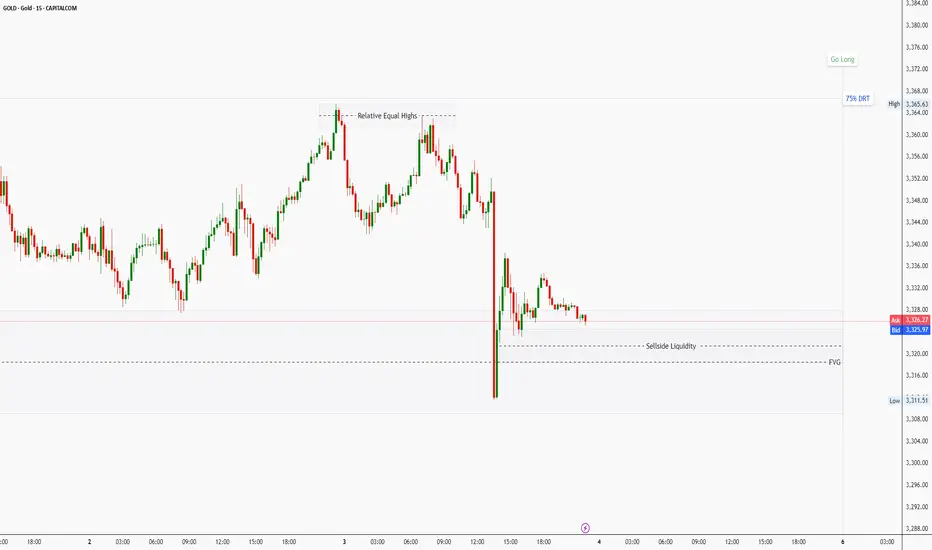
Final Trading Day Outlook for GOLD – Friday Bias and Trade PlanAs we head into the last trading day of the week, here's my outlook for GOLD ( CAPITALCOM:GOLD ):
Bias and Expectation
I was expecting a retracement from the 75% Draw on Liquidity (DRT) level — not just because of the level itself, but also due to its confluence with a Fair Value Gap (FVG) and a Bearish Order Block. And that retracement did occur.
Thursday delivered that deep retracement, courtesy of economic data and news releases. That pullback tapped into a Daily FVG and is now trading above its Consequent Encroachment (CE) at the time of this analysis.
✅ If today’s candle closes above the midpoint of that FVG, it will further confirm my bullish bias.
✅ Even more convincing will be a close above the upper boundary of the FVG, suggesting strength and possible continuation.
Market Structure Across Timeframes
🔸 4H Chart:
Price has raided sell-side liquidity and formed relative equal highs, a sign that the market may seek to attack that zone next — possibly as a liquidity target.
🔸 1H Chart:
The market is currently trading in the premium zone of the FVG, and shows a clear inability to trade lower, further supporting the bullish outlook.
Trade Plan
My trade idea for Friday is as follows:
Wait for a purge (liquidity sweep) on the sell-side, ideally during a Kill Zone (London or NY).
Look for confirmation and confluence based on my model (e.g. displacement, market structure shift).
Enter long positions targeting the next liquidity pool, particularly the equal highs formed on the 4H timeframe.
⚠️ Reminder:
Trade with due diligence. This is not financial advice. Always align entries with your personal model and preferred session.
📌 Final Note
Today may present strong opportunities — but patience, timing, and context are everything. Let the market show its hand, then act.
Thanks for your support!
If you found this idea helpful or insightful, please drop a like 👍 and leave a comment — I’d love to hear your thoughts! 🚀
Follow me for more daily price action insights and trading strategies on XAUUSD and other key markets.
Let’s grow and trade smarter together! 📈
⚠️ Disclaimer
This content is for educational and informational purposes only and does not constitute financial or investment advice.
All trading involves risk. You are solely responsible for your own decisions, so always conduct proper research and due diligence before taking any trades.
Past performance is not indicative of future results. Trade responsibly.
May your final trades of the week be precise and profitable.