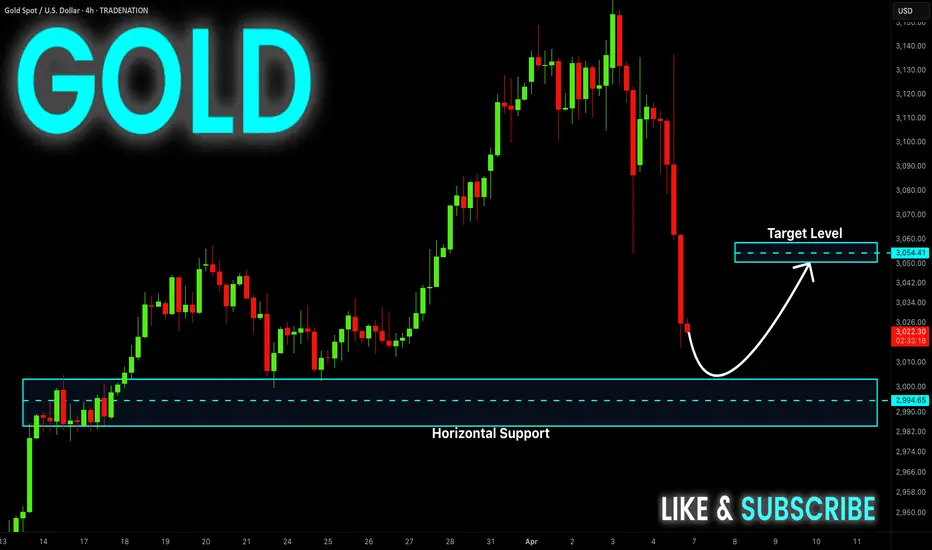
GOLD BULLISH BIAS|LONG|
✅GOLD fell again to retest the support
But it is a strong key level of 3000$
So we are already seeing a rebound
And we will be expecting a
Further bullish move up
LONG🚀
✅Like and subscribe to never miss a new idea!✅
Disclosure: I am part of Trade Nation's Influencer program and receive a monthly fee for using their TradingView charts in my analysis.
J-XAU
Gold: Will Price Rebound from Demand Zone?On this wonderful collapse yesterday we saw that the price reached the demand zone, from which it can finally reach the level of 3200 and go higher. We are buying!

GOLD 3000$ Key Level Ahead! Buy!
Hello,Traders!
GOLD is making a bearish
Correction just as pretty
Much everything else on
The market, but Gold is
Trading in a long-term
Uptrend so after the
Price hits an important
Psychological level
Around 3000$ a local
Bullish trend-following
Rebound is to be expected
Sell!
Comment and subscribe to help us grow!
Check out other forecasts below too!
Disclosure: I am part of Trade Nation's Influencer program and receive a monthly fee for using their TradingView charts in my analysis.
XAU/USD Trendline Breakout (02.04.2025)The XAU/USD Pair on the M30 timeframe presents a Potential Selling Opportunity due to a recent Formation of a Trendline Breakout Pattern. This suggests a shift in momentum towards the downside in the coming hours.
Possible Short Trade:
Entry: Consider Entering A Short Position around Trendline Of The Pattern.
Target Levels:
1st Support – 3077
2nd Support – 3048
🎁 Please hit the like button and
🎁 Leave a comment to support for My Post !
Your likes and comments are incredibly motivating and will encourage me to share more analysis with you.
Best Regards, KABHI_TA_TRADING
Thank you.

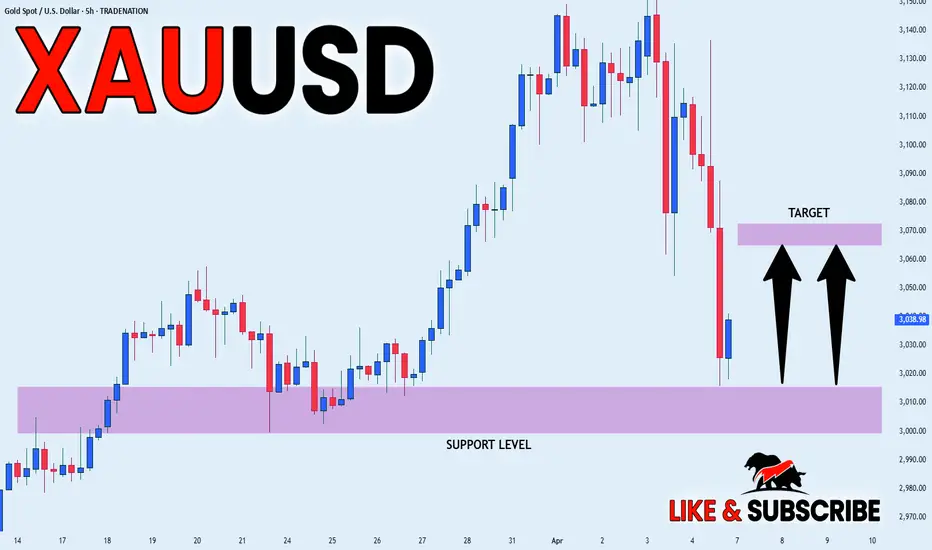
GOLD - Price can decline to support area and then start to growHi guys, this is my overview for XAUUSD, feel free to check it and write your feedback in comments👊
Some time ago price traded inside a flat pattern, where it moved between support and resistance levels.
Then gold made fake breakout to the downside, but soon returned back and started to grow strongly.
It broke the upper line of the flat and entered a rising channel, forming a steady bullish movement.
Later price touched $3160 resistance and bounced down, making correction to $3070 support area.
Now gold trades inside rising channel and near $3070 level, showing signs of slowing the decline.
In my opinion, gold can bounce from support and reach $3160 resistance as the next upward target.
If this post is useful to you, you can support me with like/boost and advice in comments❤️

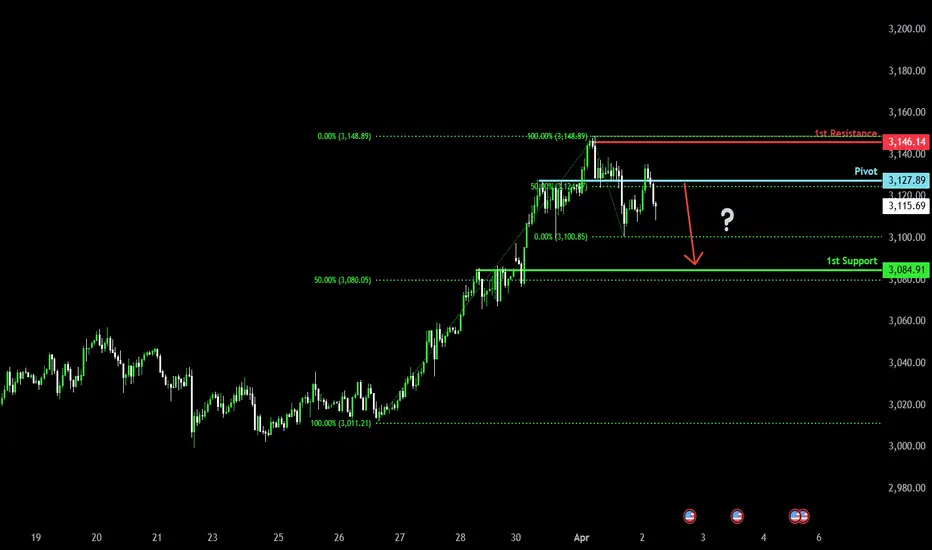
Bearish drop?The Gold (XAU/USD) has rejected off the pivot and could potentially drop to the 1st support that aligns with the 50% Fibonacci retracement.
Pivot: 3,127.89
1st Support: 3,084.91
1st Resistance: 3,146.14
Risk Warning:
Trading Forex and CFDs carries a high level of risk to your capital and you should only trade with money you can afford to lose. Trading Forex and CFDs may not be suitable for all investors, so please ensure that you fully understand the risks involved and seek independent advice if necessary.
Disclaimer:
The above opinions given constitute general market commentary, and do not constitute the opinion or advice of IC Markets or any form of personal or investment advice.
Any opinions, news, research, analyses, prices, other information, or links to third-party sites contained on this website are provided on an "as-is" basis, are intended only to be informative, is not an advice nor a recommendation, nor research, or a record of our trading prices, or an offer of, or solicitation for a transaction in any financial instrument and thus should not be treated as such. The information provided does not involve any specific investment objectives, financial situation and needs of any specific person who may receive it. Please be aware, that past performance is not a reliable indicator of future performance and/or results. Past Performance or Forward-looking scenarios based upon the reasonable beliefs of the third-party provider are not a guarantee of future performance. Actual results may differ materially from those anticipated in forward-looking or past performance statements. IC Markets makes no representation or warranty and assumes no liability as to the accuracy or completeness of the information provided, nor any loss arising from any investment based on a recommendation, forecast or any information supplied by any third-party.
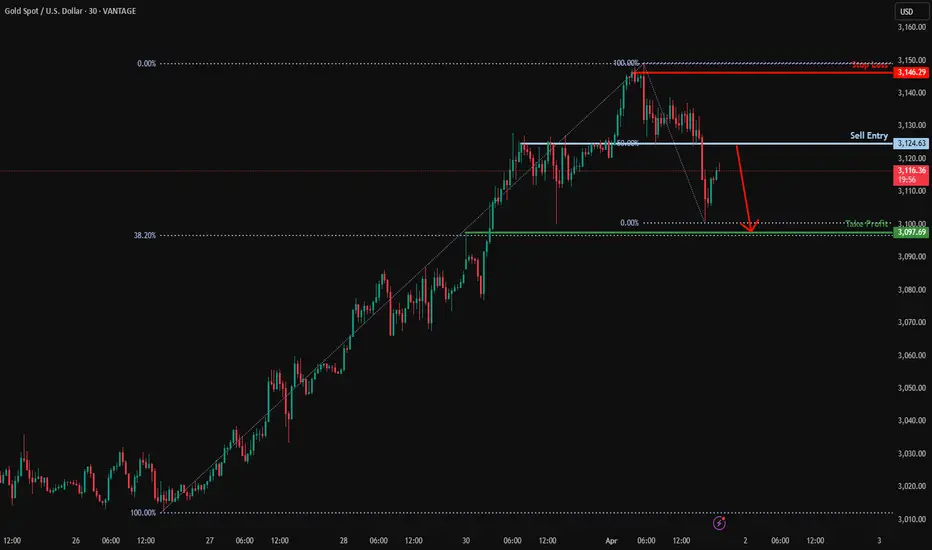
Heading into 50% Fibonacci resistance?XAU/USD is rising towards the resistance level which is an overlap resistance that lie sup with the 50% Fibonacci retracement and could reverse from this level to our take profit.
Entry: 3,124.63
Why we like it:
There is an overlap resistance level that lines up with the 50% Fibonacci retracement.
Stop loss: 3,146.29
Why we like it:
There is a pullback resistance level.
Take profit: 3,097.69
Why we like it:
There is a pullback support level that lines up with the 38.2% Fibonacci retracement.
Enjoying your TradingView experience? Review us!
Please be advised that the information presented on TradingView is provided to Vantage (‘Vantage Global Limited’, ‘we’) by a third-party provider (‘Everest Fortune Group’). Please be reminded that you are solely responsible for the trading decisions on your account. There is a very high degree of risk involved in trading. Any information and/or content is intended entirely for research, educational and informational purposes only and does not constitute investment or consultation advice or investment strategy. The information is not tailored to the investment needs of any specific person and therefore does not involve a consideration of any of the investment objectives, financial situation or needs of any viewer that may receive it. Kindly also note that past performance is not a reliable indicator of future results. Actual results may differ materially from those anticipated in forward-looking or past performance statements. We assume no liability as to the accuracy or completeness of any of the information and/or content provided herein and the Company cannot be held responsible for any omission, mistake nor for any loss or damage including without limitation to any loss of profit which may arise from reliance on any information supplied by Everest Fortune Group.
Gold in coming days ...Gold needs a price correction to $3100 for the continuation of its upward trend.
Give me some energy !!
✨We spend hours finding potential opportunities and writing useful ideas, we would be happy if you support us.
Best regards CobraVanguard.💚
_ _ _ _ __ _ _ _ _ _ _ _ _ _ _ _ _ _ _ _ _ _ _ _ _ _ _ _ _ _ _ _
✅Thank you, and for more ideas, hit ❤️Like❤️ and 🌟Follow🌟!
⚠️Things can change...
The markets are always changing and even with all these signals, the market changes tend to be strong and fast!!
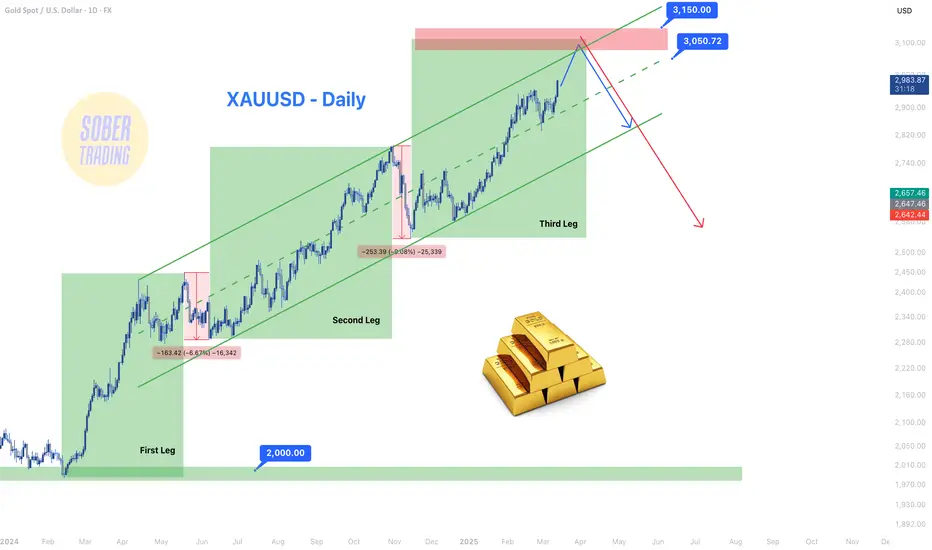
XAUUSD - Daily, Gold’s Next Big Move: Be Ready!XAUUSD - Daily Update 📈
With most analysts focusing on Gold’s bullish momentum, let’s step back and analyze where we are in the bigger picture and where we should secure profits before a potential correction.
Gold has been in a strong uptrend since the $2,000 zone, forming three major bullish legs as highlighted in the chart:
🔹 First leg correction: ~$150 drop
🔹 Second leg correction: ~$250 drop
🔹 Third correction may be deeper, so caution is needed in the target zone.
Key Levels to Watch:
📌 Potential Target Zone: $3,050 - $3,150
✔️ Measured Move: Previous legs suggest an extension into this zone.
✔️ Liquidity Grab: Gold tends to hunt liquidity over round numbers—just as it did at $2,000 → $2,060, it may break $3,050 before reversing.
✔️ Ascending Channel: The price is approaching the top of the channel, where market makers may trigger a fake breakout before a significant pullback.
🚨 Trading Strategy:
Swing traders: Secure profits near $3,050 - $3,150.
Daily traders: Use pullbacks as short-term profit opportunities.
💸 If you missed this rally, stay ahead for reversal signs & upcoming moves! Follow for more insights! 🚀
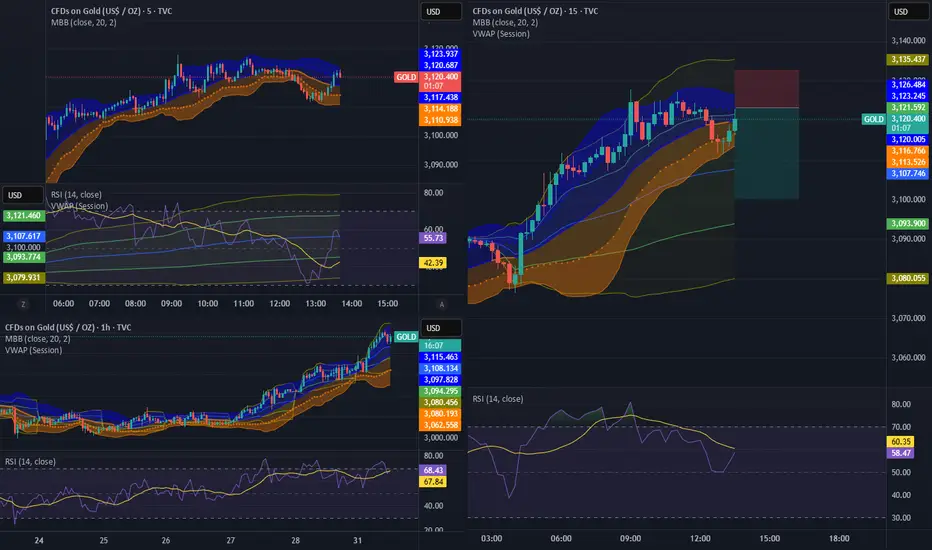
GOLD SHORT SETUP: TARGETING $3,100 FROM OVERBOUGHT CONDITIONSGOLD SHORT SETUP: TARGETING $3,100 FROM OVERBOUGHT CONDITIONS
Looking at the current Gold chart, we're seeing potential exhaustion signs near all-time highs. While the trend remains strongly bullish (all moving averages pointing up), several indicators suggest we may be due for a pullback to the $3,100 level.
Key Observations
Overbought RSI (77.09): The RSI is showing overbought conditions without divergence yet, but at levels where previous corrections have occurred.
Extreme Stochastic (97.99): Nearly maxed out at 98, suggesting limited upside momentum remains.
Williams %R near zero (-2.44): Showing extreme buying pressure that historically doesn't sustain.
CCI above 140: At 146.61, well into overbought territory.
Moving Average Spacing: While all MAs signal "Buy," the distance between recent EMAs (10, 20) and price indicates stretched conditions.
Risk Management
This is a counter-trend trade against strong bullish momentum, so position sizing should be conservative. The R2 pivot at $3,045 and the 10-day SMA at $3,046 should act as initial support levels and could provide clues about whether the pullback thesis is playing out.
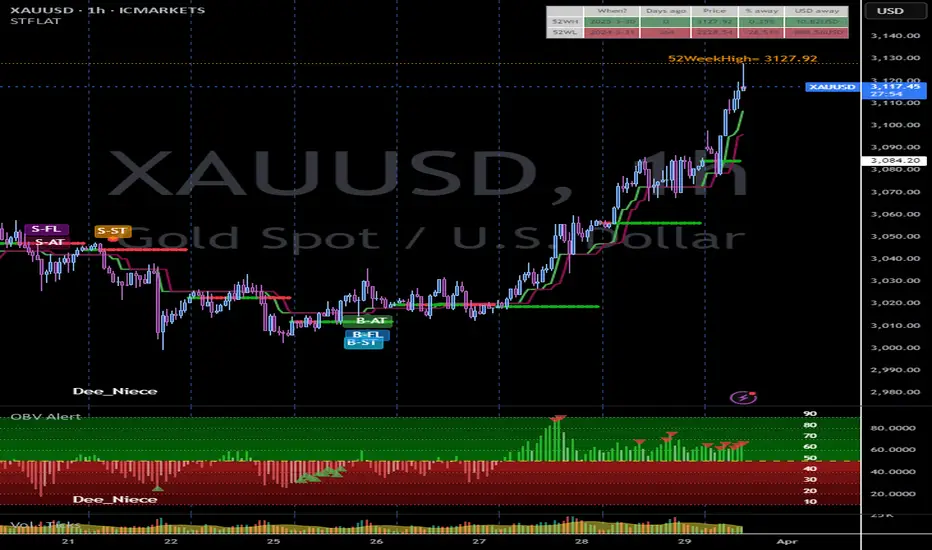
As I always emphasized, when you find the trend - stay :)When you find the trend, follow it and stay on it as long as it is valid. I uses STFLAT and oh boy, happy I did.
ICT Concepts for FX and GOLD traders: 2025 edition🔍 ICT (Inner Circle Trader) is a trading methodology developed by Michael J. Huddleston. It focuses on market structure, smart money concepts (SMC), and how institutions manipulate liquidity to trap retail traders.
📚 It's not about indicators or over-complication — it's about reading the price action like a pro, understanding where liquidity is, and trading with the banks, not against them.
📐 1. Market Structure
Understand Highs & Lows: Identify break of structure (BOS) and change of character (CHOCH)
Follow the macro to micro flow: D1 > H4 > M15 for precision entries
🧱 2. Order Blocks (OBs)
An order block is the last bullish or bearish candle before a major price move.
Banks and institutions place large orders here.
Smart traders look for price to return to these areas (mitigation), then enter with tight stop losses.
👉 Think of OBs as institutional footprints on the chart.
💧 3. Liquidity Zones
Equal highs/lows, trendline touches, support/resistance — these are liquidity traps.
ICT teaches that price often hunts liquidity before reversing. That’s why many retail traders get stopped out.
Learn to trade into liquidity, not off it.
🔄 4. Fair Value Gaps (FVGs)
Also called imbalances — when price moves too fast and leaves gaps.
Price often retraces to "fill the gap" — a key entry point for ICT traders.
🥇 ICT for Gold & Forex in 2025
💰 Why It Works for XAUUSD & Majors:
Gold is a highly manipulated asset, perfect for ICT-style trading.
It responds beautifully to liquidity grabs, order blocks, and Asian–London–New York session transitions.
Forex majors (EUR/USD, GBP/USD, etc.) are also ideal since they’re heavily influenced by institutional flow and news-driven liquidity hunts.
🕐 Timing Is Everything
Trade Killzones:
📍 London Killzone: 2AM–5AM EST
📍 New York Killzone: 7AM–10AM EST
These are high-volume sessions where institutions make their moves.
📈 Typical ICT Setup
▪️Spot liquidity zone above or below recent price
▪️Wait for liquidity sweep (stop hunt)
▪️Identify nearby order block or FVG
▪️Enter on a pullback into OB/FVG
▪️Set tight SL just past the recent swing
Target internal range, opposing OB, or next liquidity level
👨💻 Why FX/GOLD Traders Love ICT
✅ It’s clean, no indicators, and highly logical
✅ Great for part-time trading — 1 or 2 trades a day
✅ Feels like "leveling up" your understanding of the market
✅ Perfect for backtesting and journaling on platforms like TradingView or SmartCharts
✅ Easy to integrate into algo-based systems or EAs for semi-automation
If you’re tired of indicators and guessing, and want to trade like the institutions, ICT is a game changer. In 2025, more prop firms and traders are applying ICT concepts to dominate markets like gold, forex, and even crypto.
🧭 Master the method. Understand the logic. Ride with the smart money.
🔥 Welcome to the next level of trading.

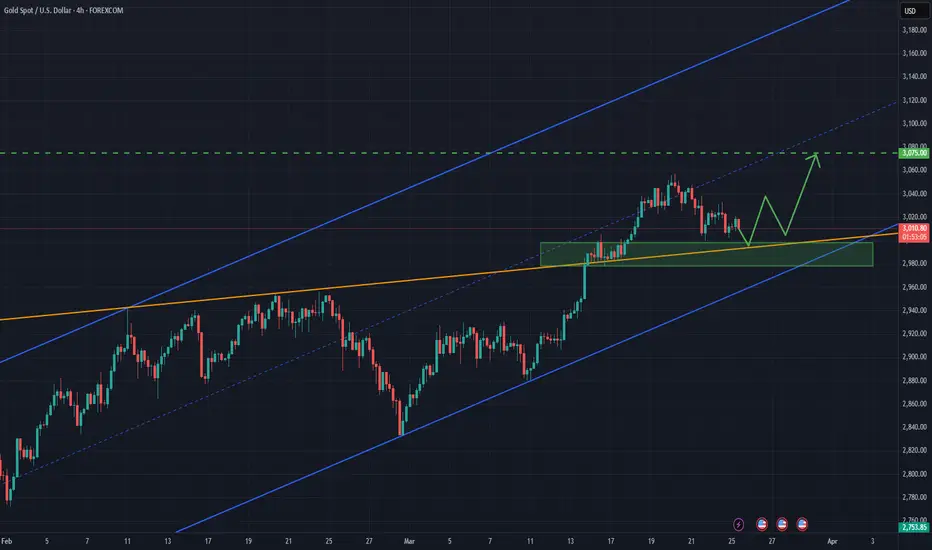
Gold can continue moving up inside the upward channelHello traders, I want share with you my opinion about Gold. At the beginning of the chart, the price started to grow from the buyer zone between 2865–2880 points, entering the first upward channel, where it formed higher highs and higher lows. After multiple rejections from the resistance line, the price made a correction and exited the channel, but the overall bullish impulse remained intact. Following a brief consolidation in the support area between 3000–3015 points, GOLD launched another strong move upward, securing a position above the current support level at 3000. This zone has proven to be strong support and marked the beginning of a new upward channel. Currently, the price is trading confidently inside this second upward channel. After a minor correction to the midline, GOLD continued its upward trajectory. I expect a short-term pullback, but as long as the support holds, the bullish trend is likely to continue. My main scenario assumes that GOLD will stay within the channel and move toward TP1, which is set at 3135 points. Given the bullish structure, solid reaction from support, and clear upward momentum, I remain bullish and anticipate further growth. Please share this idea with your friends and click Boost 🚀

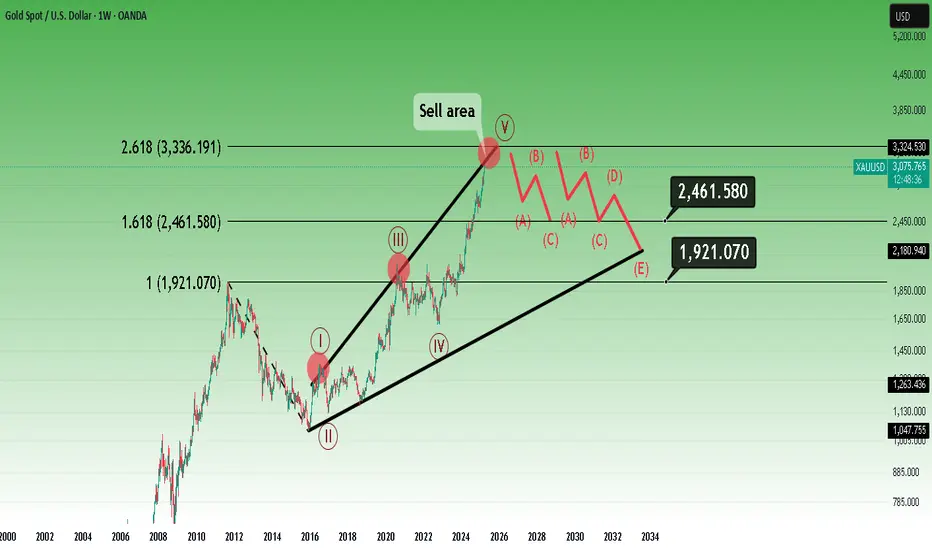
Summer is almost over for gold, winter is coming.To me it's a clear 5-way Elliot cycle.
And as I always say, trends usually target the Fibonacci range between 1.618 and 2.618.
I would never push for more, would be an unnecessary risk.
* What i share here is not an investment advice. Please do your own research before investing in any asset.
* Never take my personal opinions as investment advice, you may lose all your money.
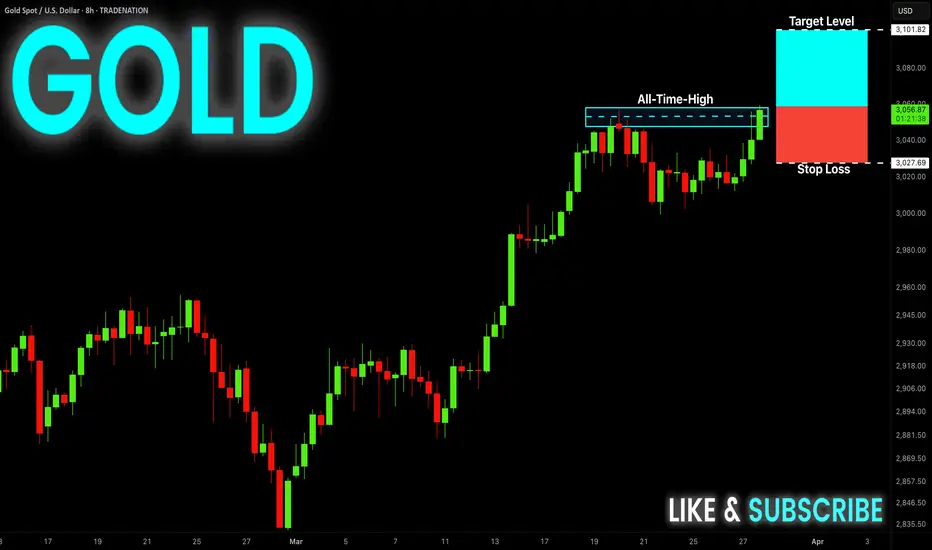
GOLD Free Signal! Buy!
Hello,Traders!
GOLD is trading in an
Uptrend and my bullish
Bias is reinforced by the
Trade war and a possible
Recession fear which comes
As a reaction to the Trump's
Car tariffs. So as the price
Is trying to break the all-time-high
Level of 3058$ we can enter
A long trade with the Take
Profit of 3101$ and
Stop Loss of 3027$
Buy!
Comment and subscribe to help us grow!
Check out other forecasts below too!
Disclosure: I am part of Trade Nation's Influencer program and receive a monthly fee for using their TradingView charts in my analysis.
GOLD XAU Short at All Time High! Silver.too!It seems that Trump taming some market investors,Gold is falling because of lower risk of tariffs on April 2nd 2025
More entry profit target details :Take a look at the chart

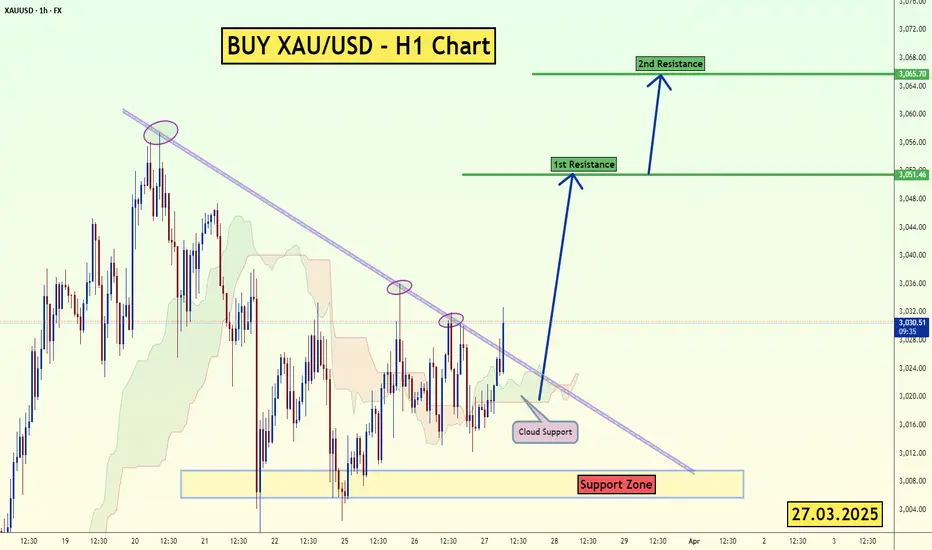
XAU/USD - H1 Chart - Trendline Breakout (27.03.2025)The XAU/USD pair on the H1 timeframe presents a Potential Buying Opportunity due to a recent Formation of a Breakout Pattern. This suggests a shift in momentum towards the upside and a higher likelihood of further advances in the coming hours.
Possible Long Trade:
Entry: Consider Entering A Long Position around Trendline Of The Pattern.
Target Levels:
1st Resistance – 3051
2nd Resistance – 3065
🎁 Please hit the like button and
🎁 Leave a comment to support for My Post !
Your likes and comments are incredibly motivating and will encourage me to share more analysis with you.
Best Regards, KABHI_TA_TRADING
Thank you.
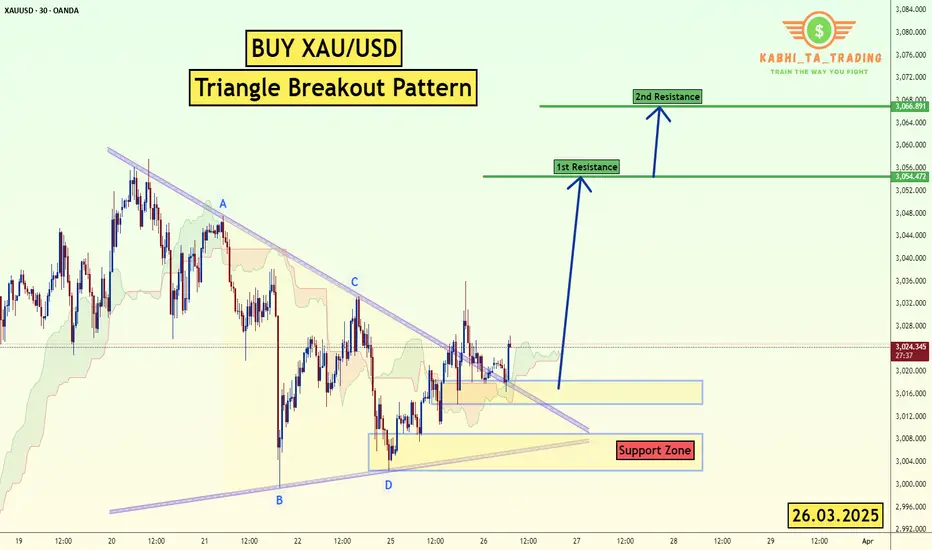
XAU/USD (Gold) Triangle Breakout (26.03.2025)The XAU/USD pair on the M30 timeframe presents a Potential Buying Opportunity due to a recent Formation of a Triangle Breakout Pattern. This suggests a shift in momentum towards the upside and a higher likelihood of further advances in the coming hours.
Possible Long Trade:
Entry: Consider Entering A Long Position around Trendline Of The Pattern.
Target Levels:
1st Resistance – 3054
2nd Resistance – 3066
🎁 Please hit the like button and
🎁 Leave a comment to support for My Post !
Your likes and comments are incredibly motivating and will encourage me to share more analysis with you.
Best Regards, KABHI_TA_TRADING
Thank you.
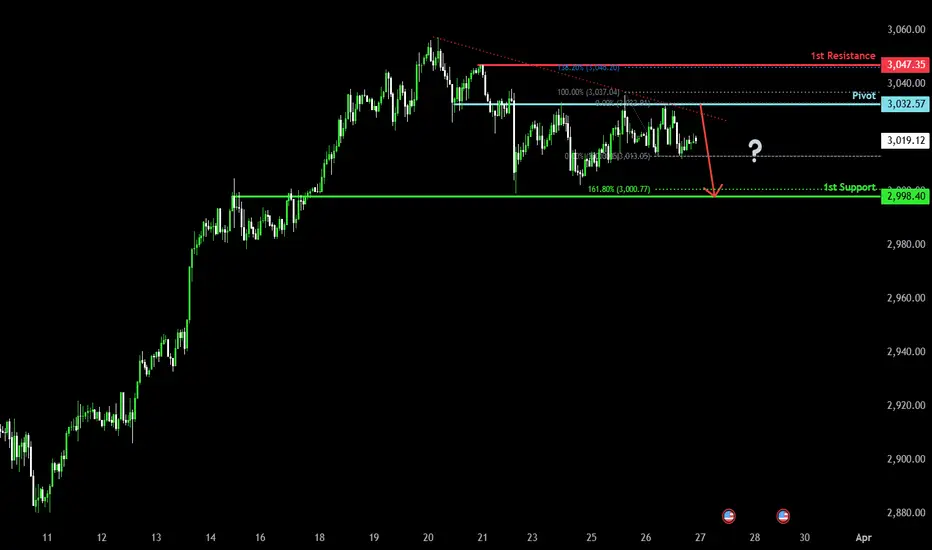
Bearish drop?The Gold (XAU/USD has rejected off the pivot and could drop to the 1st support level.
Pivot: 3,032.57
1st Support: 2,998.40
1st Resistance: 3,047.35
Risk Warning:
Trading Forex and CFDs carries a high level of risk to your capital and you should only trade with money you can afford to lose. Trading Forex and CFDs may not be suitable for all investors, so please ensure that you fully understand the risks involved and seek independent advice if necessary.
Disclaimer:
The above opinions given constitute general market commentary, and do not constitute the opinion or advice of IC Markets or any form of personal or investment advice.
Any opinions, news, research, analyses, prices, other information, or links to third-party sites contained on this website are provided on an "as-is" basis, are intended only to be informative, is not an advice nor a recommendation, nor research, or a record of our trading prices, or an offer of, or solicitation for a transaction in any financial instrument and thus should not be treated as such. The information provided does not involve any specific investment objectives, financial situation and needs of any specific person who may receive it. Please be aware, that past performance is not a reliable indicator of future performance and/or results. Past Performance or Forward-looking scenarios based upon the reasonable beliefs of the third-party provider are not a guarantee of future performance. Actual results may differ materially from those anticipated in forward-looking or past performance statements. IC Markets makes no representation or warranty and assumes no liability as to the accuracy or completeness of the information provided, nor any loss arising from any investment based on a recommendation, forecast or any information supplied by any third-party.
GOLD - Price can correct to support level and continue to growHi guys, this is my overview for BTCUSDT, feel free to check it and write your feedback in comments👊
Some time ago price started to grow inside a rising channel, where it reached the $2880 level and broke it.
Next price bounced from this level and some time rose in the channel, but then it made a correction, exiting from this channel.
After this, price turned around and continue to move up in another rising channel, where later it reached $3000 level.
Then Gold broke this level and made retest, after whcih it rose to resistance line of channel and then fell to support area.
Recently price started to decline, so, I think that Gold can decline to the support level and then bounce up to $3095
If this post is useful to you, you can support me with like/boost and advice in comments❤️

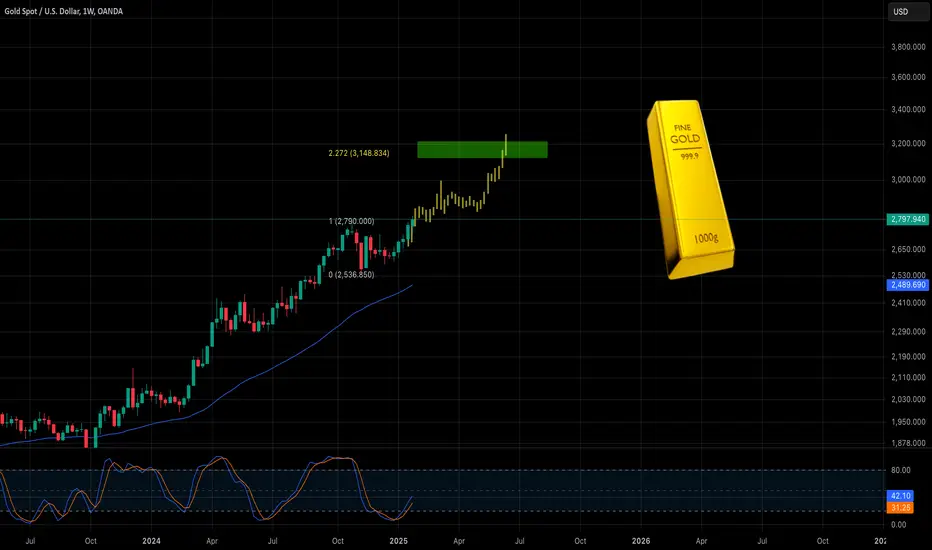
Golden Opportunities: Navigating the New Era of InvestmentFolks, we're witnessing something truly remarkable with XAUUSD. Gold's weekly uptrend is not just a blip on the radar; it's a beacon signaling a return to the fundamentals I've been harping on for ages. Recall my earlier insights? I pegged the long-term trend in Gold, and here we are, watching it soar. Trump's chatter about inflation and rates? It's like watching a chess game where each move by the Fed could be influenced by such rhetoric. The market, my friends, seems to be betting on this narrative, pricing in these potential shifts.
Now, let's not forget the basics. Historically, precious metals dance to the tune of real interest rates - those inflation-adjusted numbers. Sure, during times of market panic or geopolitical tension, Gold might get caught in the crossfire as either a collateral darling or a safe haven. But in these calmer waters, it's the real rates that dictate the dance. So, keep your eyes on the prize. Gold isn't just shining; it's setting the stage for what might be a golden era in investment. Watch, learn, and maybe, just maybe, enjoy the ride as we navigate these waters together. Stay vigilant, and may your investments be as golden as your opportunities.
Horban Brothers,
Alex Kostenich
XAU/USD: Bullish Momentum Holds with Breakout PotentialXAU/USD closed its third straight bullish week, with price testing Tuesday’s low before rebounding and closing near the 50% mark of the weekly range. Despite a brief dip, the candle closed above last week’s high, showing continued strength. A breakout above the 3,000 level raises the potential for further gains, especially if the market opens with a gap up.
On the daily timeframe, Friday's candle recovered after early weakness, resembling a previous pullback seen earlier this month. With a 1.90% retracement, the structure suggests possible upward continuation. The market is currently moving sideways within Friday’s range, hovering around the 3,030 key level.
While high-impact news could cause volatility, any pullback toward the 3,000 support zone—aligned with the trendline and previous week’s high—may offer buying opportunities. A breakout from the inside bar pattern forming on the daily chart could target the 3075 resistance zone