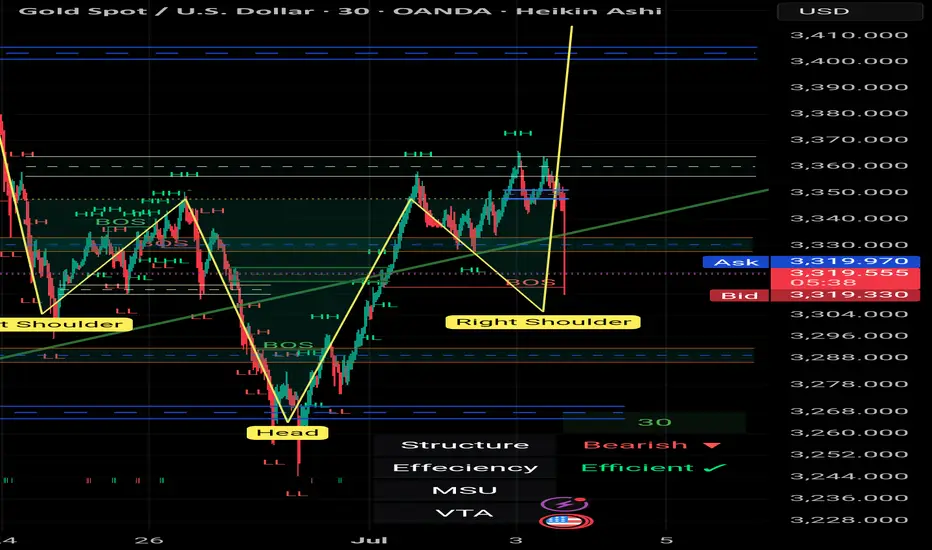
I say nothing , you say me any thing about 📌 **Gold Spot (XAU/USD) – 30m | 2h | Smart Money Perspective**
🔍 After weeks of precision tracking and structural validation, price has now tapped the **Right Shoulder** of a clean *Reverse Head & Shoulders* formation — with absolute respect to structure, liquidity, and OB zones.
💥 This wasn't just a random bounce.
It was:
- A confirmation of **previous BOS & CHoCH**
- A retest of **TLQ/ILQ liquidity zones**
- A reaction from the *Extreme OB* within a compression channel
- And a final push fueled by **inefficiency fills** on the left
🎯 The bullish intent remains strong, and if momentum follows through, we're looking at:
- **TP1** → 3345–3355 (minor OB & void fill)
- **TP2** → 3375–3390 (liquidity sweep target)
- **TP3** → 3420+ (range expansion goal)
🧠 This analysis has not just been correct.
It’s been **respected by the market.**
I take pride in every reaction the chart gives us when we respect the language of price, structure, and timing.
There’s no shortcut here — just observation, logic, and discipline.
We don’t chase the trend. We wait for it to **bow in confirmation**.
Like it just did.
— *Mohsen Mozafari Nejad* 🧭
#SmartMoney #GoldAnalysis #XAUUSD #TradingView #MarketStructure #BOS #OB #MSU #ReverseHeadAndShoulders #Forex #TechnicalAnalysis
J-XAU
BTC/USD Fake out before Pump | Bullish Flag formationBTC/USDT (1D) Market Outlook – July 1, 2025
Introduction
BTC is currently consolidating within a bullish flag pattern after printing a swing high at 108.9K and a recent swing low at 98K. The price sits just below a major supply zone.
Context 1: Key Zones
Supply: 104.6K – 112.1K
Demand: 74.4K – 82.5K
Fair Value Gaps (FVG): 3 zones below price, with one near 88–90K
Context 2: Technical Confluence
Liquidation Zone: 106.2K
Golden Pocket (Fib 0.618): 102.1K
Psychological Levels: 105K and 110K
Context 3: Market Structure
Pattern: Bullish flag
Trend (LTF): Sideways/consolidation
Volume Profile: Heavy activity near 105K–110K
Bullish Scenario
Breaks above 106.2K (liq zone)
Pulls back to 102.1K (golden pocket), forms higher low
Retests resistance for continuation
Alt scenario: clean breakout above resistance → ATH retest
Bearish Scenario
Breaks below 106.2K and flag support
Fills FVG, breaks prior low at 98K
Triggers macro downtrend toward 88–90K zone
Summary
BTC is at a decision point inside a bullish flag, facing supply. A break above 106.2K favors upside continuation, while rejection and a lower low could trigger a deeper retracement. Watch key levels closely.

Gold Holds Above 3342 Ahead of Key U.S Data –Bullish Bias IntactGold Rises as Market Awaits Key U.S. Economic Data
Gold prices are pushing higher as investors position ahead of today’s major U.S. economic releases, including NFP and unemployment figures. Expectations of weaker data are supporting bullish sentiment.
Technical Outlook (XAU/USD):
Gold maintains a bullish structure as long as it trades above 3,342.
→ A push toward 3,365 is likely
→ A 1H close above 3,365 would open the path toward 3,375
However, if price closes below 3,342 on the 1H chart, bearish momentum may build, targeting 3,331 and 3,320
Key Levels:
• Resistance: 3,365 / 3,375 / 3,390
• Support: 3,341 / 3,331 / 3,320
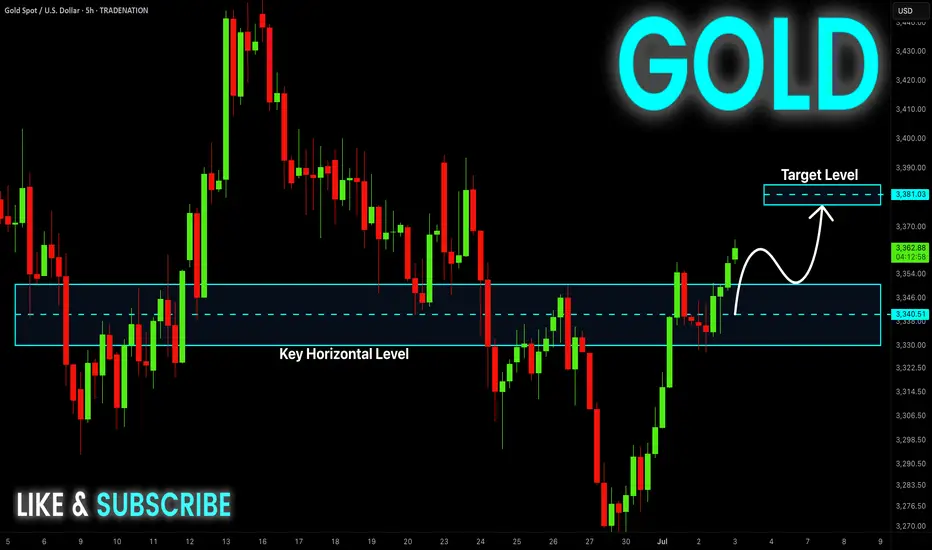
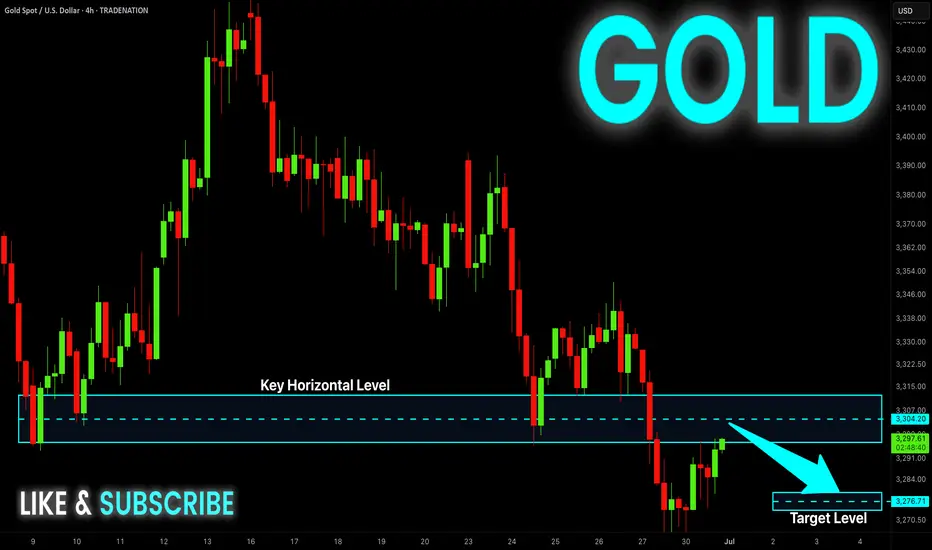
GOLD Bullish Breakout! Buy!
Hello,Traders!
GOLD is going up now
And the price broke the
Key horizontal level
Around 3,346$ and
The breakout is confimred
So we are bullish biased
And we will be expecting
A further bullish move up
Buy!
Comment and subscribe to help us grow!
Check out other forecasts below too!
Disclosure: I am part of Trade Nation's Influencer program and receive a monthly fee for using their TradingView charts in my analysis.
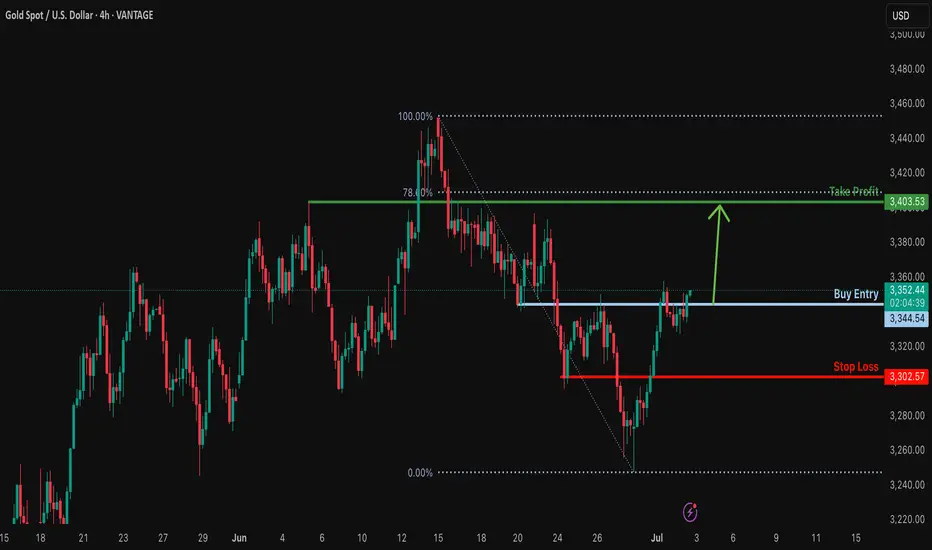
Bullish rise for the Gold?The price is reacting off the resistance level which is a pullback resistance and could potentially rise from this level to our take profit.
Entry: 3,344.54
Why we like it:
There is a pullback resistance level.
Stop loss: 3,302.57
Why we like it:
There is a pullback support level.
Take profit: 3,403.53
Why we like it:
There is a pullback resistance level that lines up with the 78.6% Fibonacci retracement.
Enjoying your TradingView experience? Review us!
Please be advised that the information presented on TradingView is provided to Vantage (‘Vantage Global Limited’, ‘we’) by a third-party provider (‘Everest Fortune Group’). Please be reminded that you are solely responsible for the trading decisions on your account. There is a very high degree of risk involved in trading. Any information and/or content is intended entirely for research, educational and informational purposes only and does not constitute investment or consultation advice or investment strategy. The information is not tailored to the investment needs of any specific person and therefore does not involve a consideration of any of the investment objectives, financial situation or needs of any viewer that may receive it. Kindly also note that past performance is not a reliable indicator of future results. Actual results may differ materially from those anticipated in forward-looking or past performance statements. We assume no liability as to the accuracy or completeness of any of the information and/or content provided herein and the Company cannot be held responsible for any omission, mistake nor for any loss or damage including without limitation to any loss of profit which may arise from reliance on any information supplied by Everest Fortune Group.
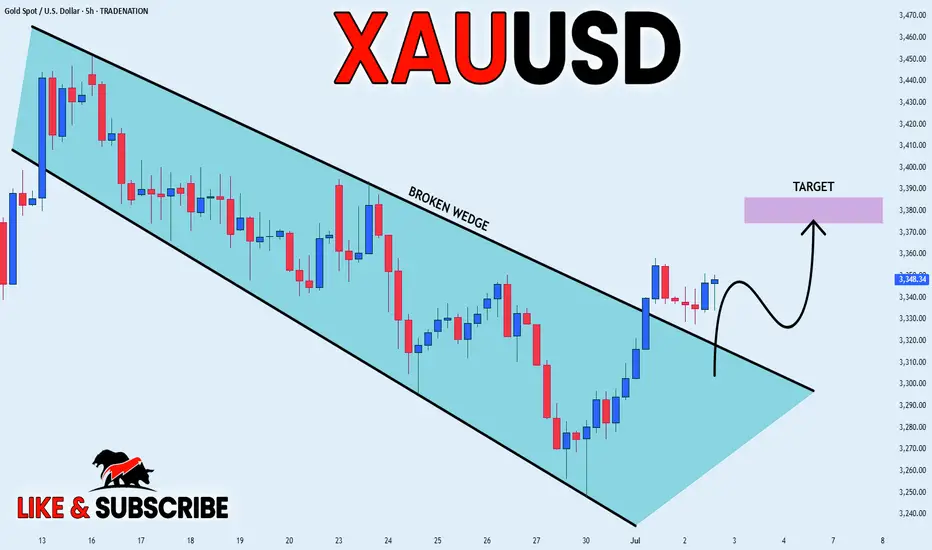
GOLD BROKEN WEDGE|LONG|
✅GOLD was trading in an
Opening wedge pattern and
Now we are seeing a bullish
Breakout so we are bullish
Biased and we will be expecting
A further bullish move up
LONG🚀
✅Like and subscribe to never miss a new idea!✅
Disclosure: I am part of Trade Nation's Influencer program and receive a monthly fee for using their TradingView charts in my analysis.
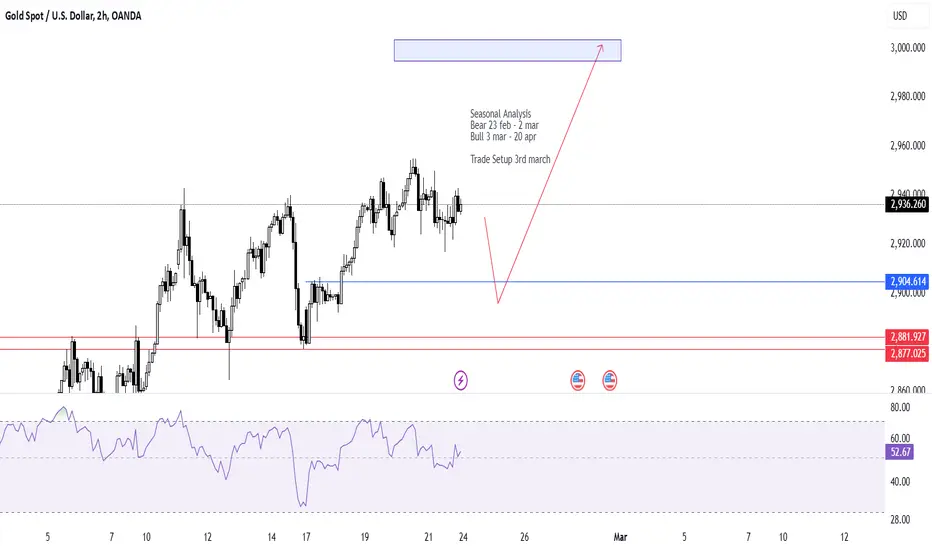
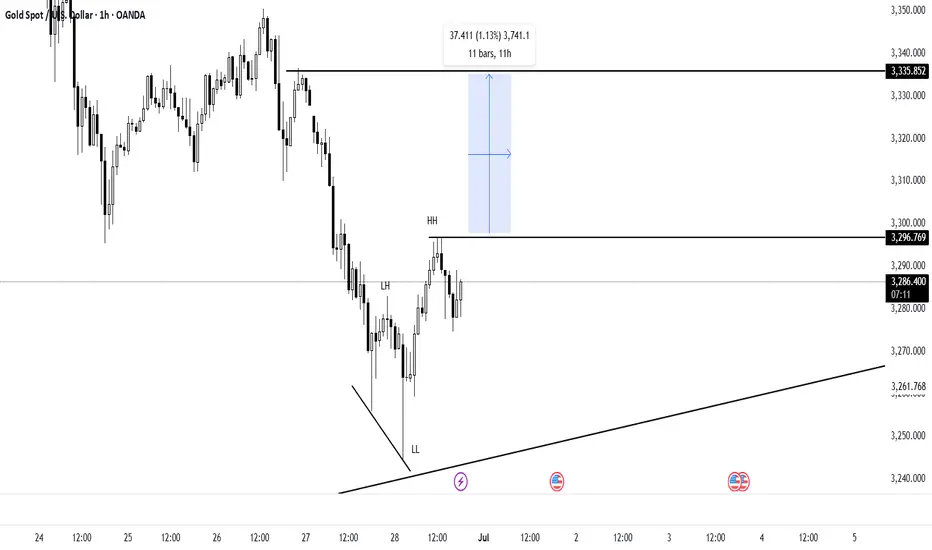
XAU bearish and bullish setup for next week
Still XAU making HH and HL
It has to retrace before going for another HH
Seasonal analysis showing same previous 5 year data
XAU Bearish from 23 Feb to 2 Mar then Bullish from 3 Mar - 20 Apr
So, instead of this week retracement and consolidation
I look for trade bullish trade next week.
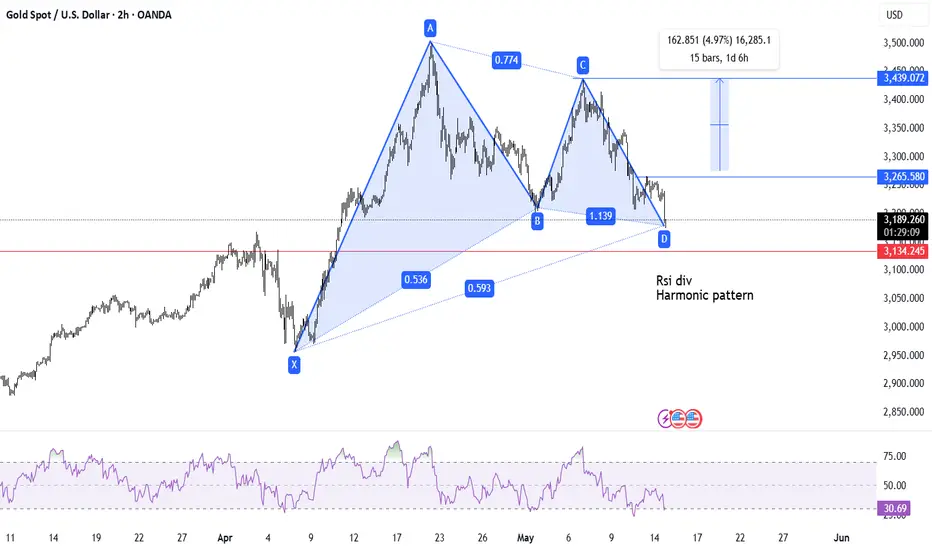
Gold forming harmonic patternRSI divergence needs to be confirm use buy stop at last Higher low
or wait for HH and HL then Higher low to be good entry
Harmonic pattern
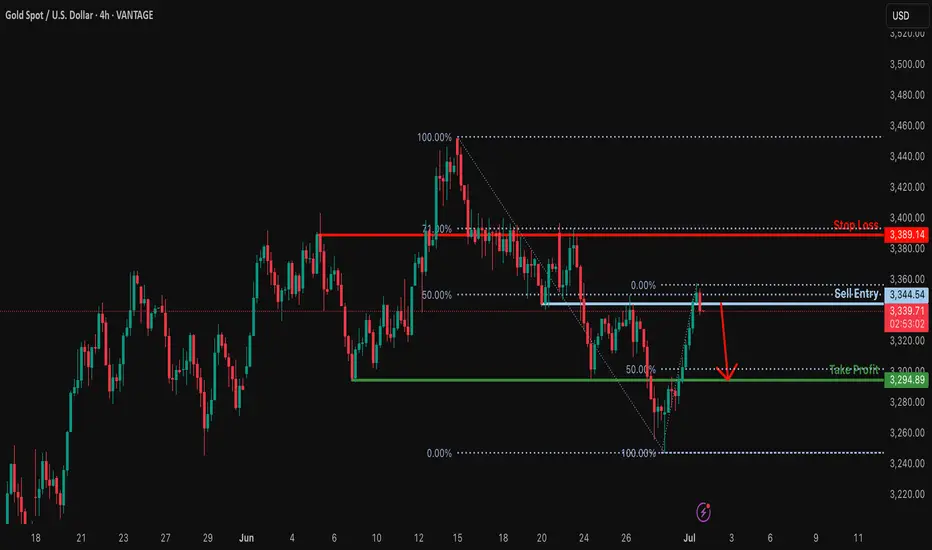
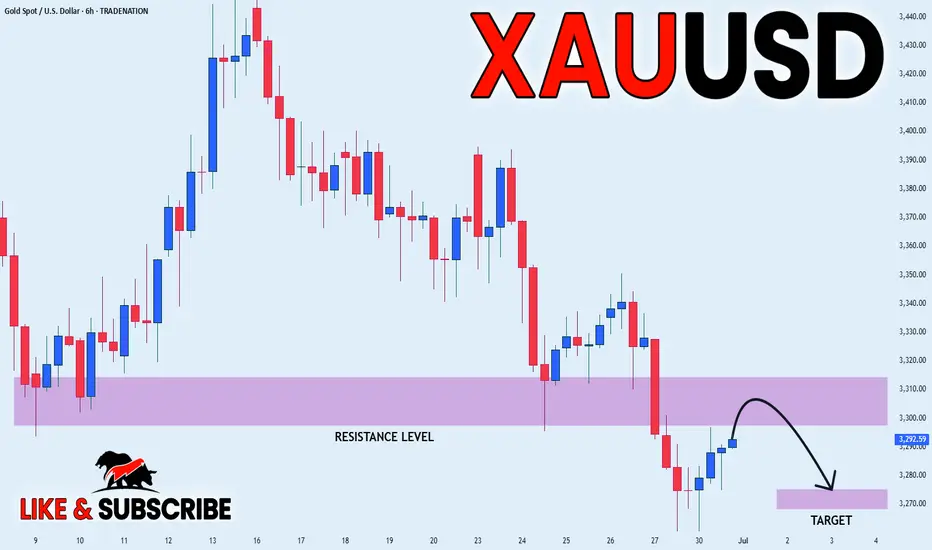
Bearish drop?XAU/USD is reacting off the resistance which is a pullback resistance that lines up with the 50% Fibonacci retracement and could drop from this level to our take profit.
Entry: 3,344.54
Why we like it:
There is a pullback resistance that lines up with the 50% Fibonacci retracement.
Stop loss: 3,389.14
Why we like it:
There is a pullback resistance that lines up with the 71% Fibonacci retracement.
Take prpofit: 3,294.89
Why we like it:
There is a pullback support level that aligns with the 50% Fibonacci retracement.
Enjoying your TradingView experience? Review us!
Please be advised that the information presented on TradingView is provided to Vantage (‘Vantage Global Limited’, ‘we’) by a third-party provider (‘Everest Fortune Group’). Please be reminded that you are solely responsible for the trading decisions on your account. There is a very high degree of risk involved in trading. Any information and/or content is intended entirely for research, educational and informational purposes only and does not constitute investment or consultation advice or investment strategy. The information is not tailored to the investment needs of any specific person and therefore does not involve a consideration of any of the investment objectives, financial situation or needs of any viewer that may receive it. Kindly also note that past performance is not a reliable indicator of future results. Actual results may differ materially from those anticipated in forward-looking or past performance statements. We assume no liability as to the accuracy or completeness of any of the information and/or content provided herein and the Company cannot be held responsible for any omission, mistake nor for any loss or damage including without limitation to any loss of profit which may arise from reliance on any information supplied by Everest Fortune Group.
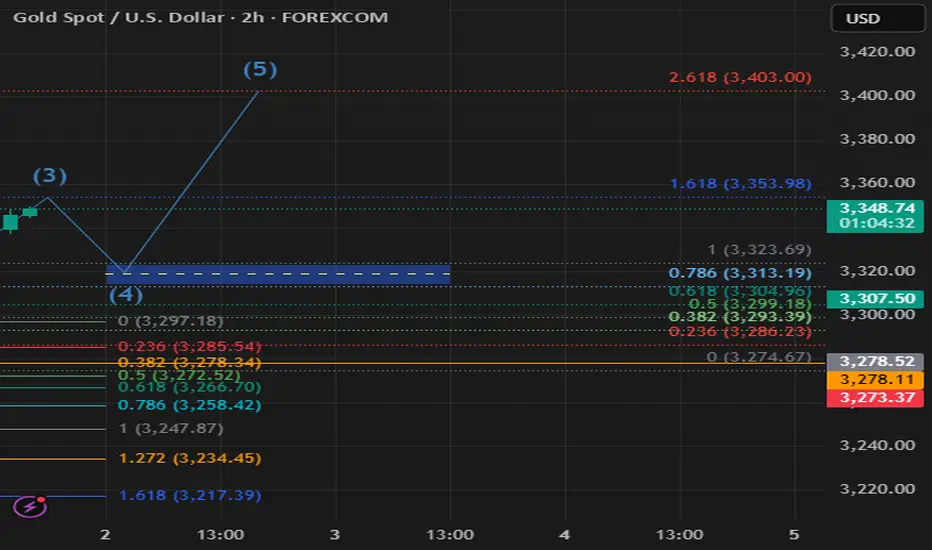
XAU/USD Start July 20251. i start after XAU/USD break previous High and correction (fibbo 32.0) respected. based on elliot wave strategy we can targeting end of wave 3 at 3353 area and than correction wave 4 (target at fibbo 32.0 - 50.0). after target correction, continue wave 5 at target 3403 area.
2. fundamentally speaking, new months new quarter. there ins't new catalist and sentiment. Macro Economic this week focus on labour market at US and FED projection to cut rate.
3. War at Iran and Israel, Russia and Ukraine, India and Pakistan, Trade War case, etc,.
4. Will be update
Gold toushes major trendlinemajor trendline on 1d timeframe
RSI divergence
Reverse of trend HH and HL
Risk 1:2
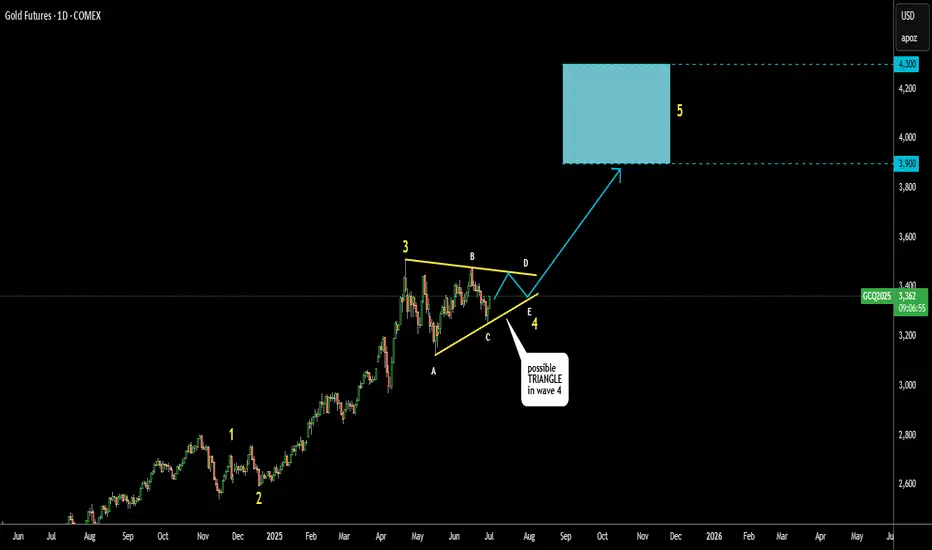
Gold Update: Possible Triangular Consolidation Before New RallyIt looks like corrective wave 4 is in the making within a large Triangle
3 waves A, B and C already emerged in 3-waves structure
which confirms triangle
Wave D should stay under the top of wave B
Wave E could either touch or break down the support line
It should keep above the valley of wave C
Target area changed higher as this consolidation tends to narrowing within a
contracting triangle.
Lowest target now $3,900
Optimistic target is at $4,300
Breakdown below $3,123 would invalidate the pattern
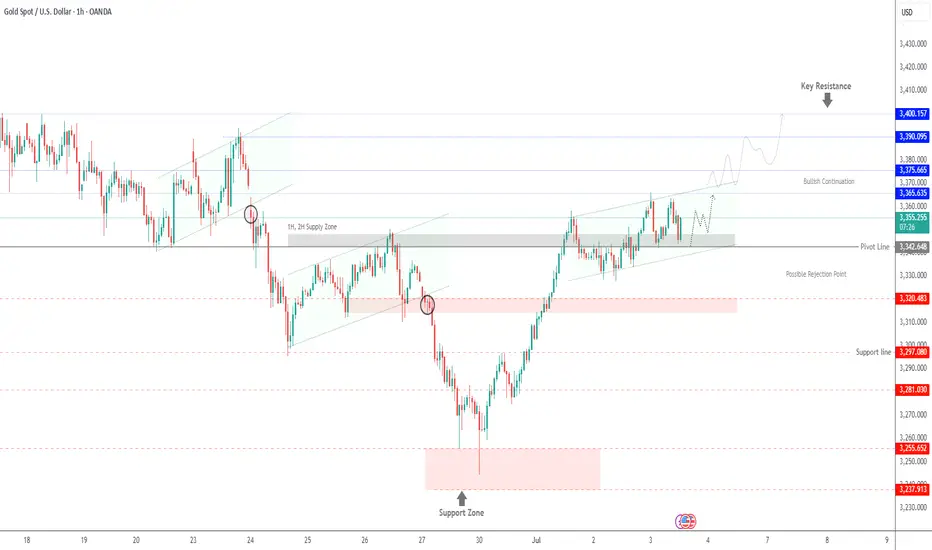
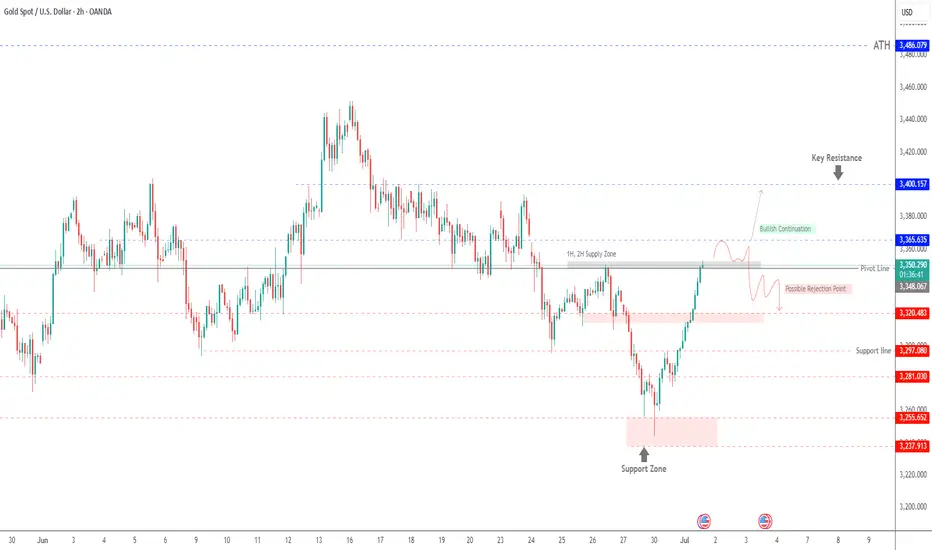
XAU/USD – Testing 2H/1H Supply Zone | Breakout or Rejection?XAU/USD – Testing 1H/2H Supply Zone | Bullish Continuation or Rejection Ahead
Gold has rallied strongly from the support zone around 3,238–3,255, breaking multiple intraday resistance levels and now approaching a critical 1H/2H Supply Zone near 3,348–3,366.
This area previously acted as a strong sell-off zone, making it a key decision point.
Scenario 1: Bullish Continuation
If price breaks and closes above 3,366 with momentum, we could see further upside toward the next resistance at 3,400 and possibly retest the ATH zone at 3,486. A short consolidation or retest within the zone would confirm strength.
Scenario 2: Rejection from Supply Zone
If the supply holds, a rejection from the zone could lead to a pullback toward:
3,320.48 (minor support)
3,297.08 (support line)
Or deeper retracement to the 3,255–3,238 support zone
Key Technical Levels
Supply Zone: 3,348 – 3,366
Resistance: 3,400 – 3,486 (ATH)
Support Levels: 3,320 – 3,297 – 3,255 – 3,238
Pivot Line: 3,348
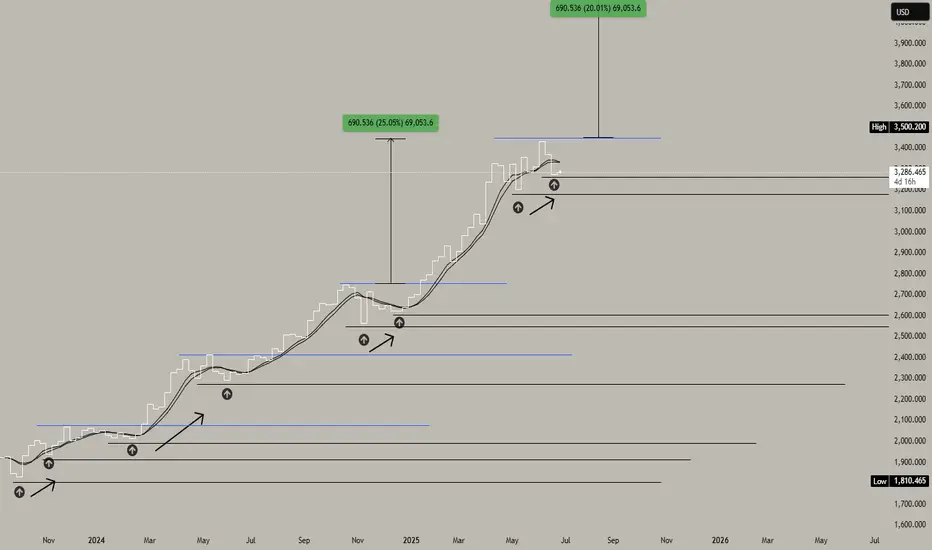
GOLD, back at higher base. BUY at 3250 enroute to ath 3500 / 4k.GOLD had a wonderful run this past few seasons grinding up a series of ATH taps every higher baselines since 1500.
After goin to a new parabolic highs of 3500 ATH, GOLD did hibernate a bit and got trimmed back to 3240 levels -- a precise 61.8 FIB tap. This is where most buyers converge, and position themselves on the next run up.
The next ascend series will be far more generous eyeing new higher numbers never before seen. Ideal seeding zone is at the current price range of 3250.
Current higher lows on momentum metrics has been spotted conveying intense upside pressure as it moves forward.
Spotted at 3250
Interim target at 3500 ATH
Long term: 4000
TAYOR.
Trade safely. Market will be market.
Not financial advice.
GOLD Short From Resistance! Sell!
Hello,Traders!
GOLD made a bullish
Rebound from the support
Below just as we predicted in
Our previous analysis but
Gold is still trading in the
Downtrend as the lower lows
And higher highs are intact
And the structure is healthy
So after the price retested the
Horizontal resistance above
Around 3,310$ we are
Likely to see a further
Bearish move down
Sell!
Comment and subscribe to help us grow!
Check out other forecasts below too!
Disclosure: I am part of Trade Nation's Influencer program and receive a monthly fee for using their TradingView charts in my analysis.
GOLD WILL FALL|SHORT|
✅GOLD is trading in a
Downtrend and the price is
Making a typical rebound but
After the horizontal resistance
Level above around 3,300$ is
Retested we will be expecting
A further bearish move down
SHORT🔥
✅Like and subscribe to never miss a new idea!✅
Disclosure: I am part of Trade Nation's Influencer program and receive a monthly fee for using their TradingView charts in my analysis.
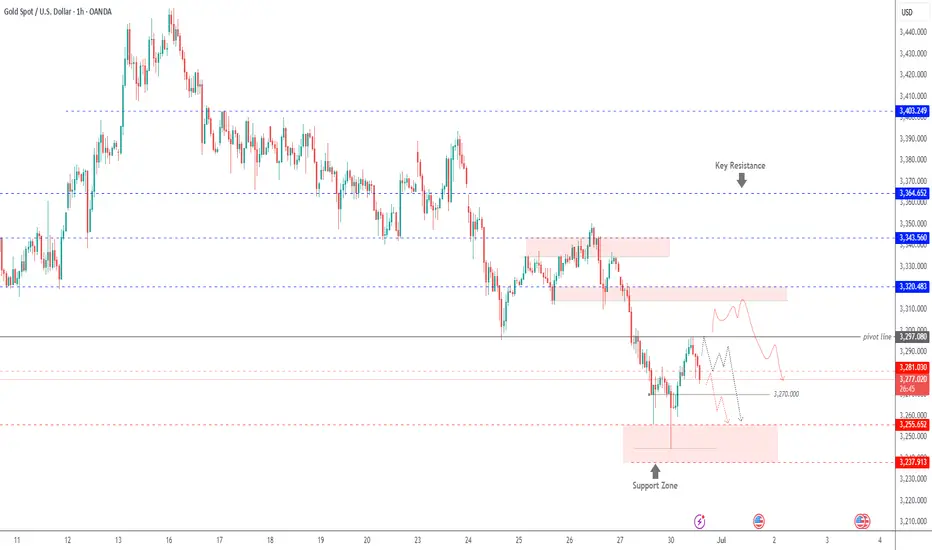
GOLD | Pressure Below Pivot – Eyes on 3255 and 3238GOLD | Market Outlook
The overall momentum remains bearish as long as the price trades below the pivot line at 3297.
Currently, the price is attempting to stabilize below 3281, suggesting a potential continuation of the downtrend toward 3270 and 3255.
A confirmed 1H close below 3255 would further strengthen the bearish scenario, opening the way toward 3238.
Sell Setup:
Valid if 1H candle closes below 3281→ Targets: 3270 and 3255
Buy Setup:
Valid if 1H candle closes above 3297→ Targets: 3314
Key Levels:
• Pivot: 3281
• Support: 3255 / 3238
• Resistance: 3297 / 3314
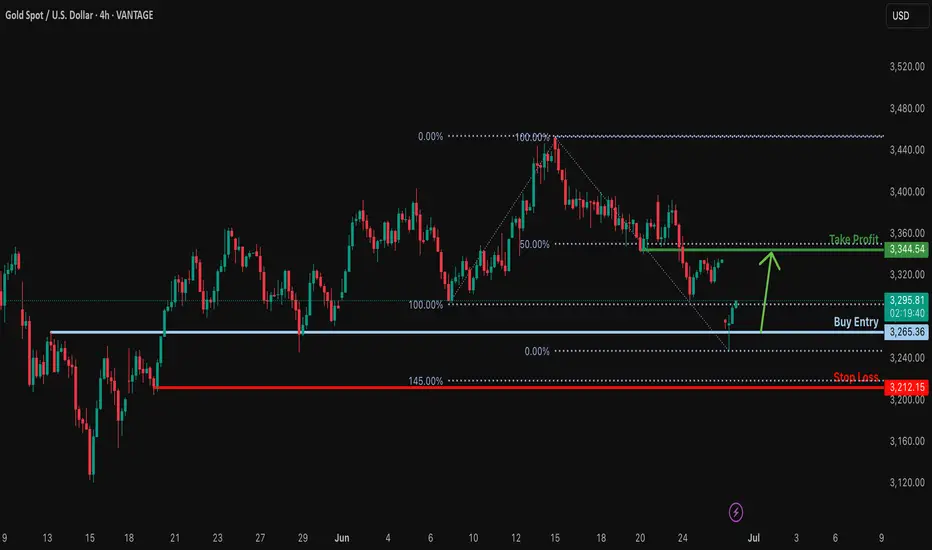
Bullish bounce off major support?XAU/USD has bounced off the support level which is an overlap support and could rise from this level to our take profit.
Entry: 3,265.39
Why we like it:
There is an overlap support level.
Stop loss: 3,121.15
Why we like it:
There is a pullback support level that aligns with the 145% Fibonacci extension.
Take profit: 3,344.54
Why we like it:
There is a pullback resistance that lines up with the 50% Fibonacci retracement.
Enjoying your TradingView experience? Review us!
Please be advised that the information presented on TradingView is provided to Vantage (‘Vantage Global Limited’, ‘we’) by a third-party provider (‘Everest Fortune Group’). Please be reminded that you are solely responsible for the trading decisions on your account. There is a very high degree of risk involved in trading. Any information and/or content is intended entirely for research, educational and informational purposes only and does not constitute investment or consultation advice or investment strategy. The information is not tailored to the investment needs of any specific person and therefore does not involve a consideration of any of the investment objectives, financial situation or needs of any viewer that may receive it. Kindly also note that past performance is not a reliable indicator of future results. Actual results may differ materially from those anticipated in forward-looking or past performance statements. We assume no liability as to the accuracy or completeness of any of the information and/or content provided herein and the Company cannot be held responsible for any omission, mistake nor for any loss or damage including without limitation to any loss of profit which may arise from reliance on any information supplied by Everest Fortune Group.
Gold in a Shifting Macro Landscape Fundamentals First: Why is Gold Falling While DXY is Too?
Normally, gold and the U.S. dollar share an inverse relationship (which means, when DXY weakens, gold rises). But recently, this correlation has broken down, and that divergence is a loud macro signal.
What’s Happening:
Trade Deal Optimism:
Headlines suggest the U.S. is nearing a resolution with China and other partners. With reduced geopolitical tension, investors are reallocating from safe-haven assets like gold into risk-on trades like equities and crypto.
Iran-Israel Ceasefire:
The temporary cooling of conflict has revived risk appetite. Traders are rotating out of war hedges (like gold and oil) and into tech, growth, and EM plays.
Real Yields Still Elevated:
Despite a softening Fed narrative, U.S. real yields remain positive, keeping pressure on non-yielding assets like gold. The fact that gold couldn't rally even as the 10-year note softened post-Moody's downgrade could be telling.
My Perspective:
This is the first clear signal in months that geopolitical hedging may have peaked. When gold decouples from its safe-haven narrative despite macro uncertainty, that often precedes a structural rotation phase, especially if institutional flows favor equities.
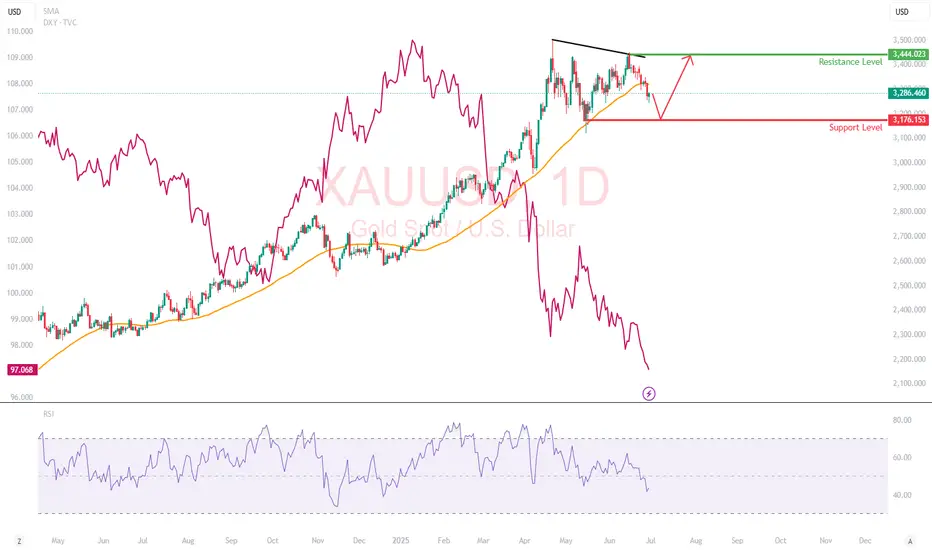
Technical Breakdown
Gold has broken below its 50-day SMA at $3,322 and is trading in the lower third of its 3-month range. While the daily candles show increasing selling pressure, especially on lower highs (a sign of weakening bullish momentum)
RSI : Falling toward 40, with no bullish divergence yet.
Support Level : $3,176: Previous swing low
Resistance Level : $3,444: previous swing high
What This Move Might Be Telling Us
When gold sells off on dollar weakness and geopolitical calm, the market isn’t just relaxing. It is rotating. The de-grossing of gold-heavy hedges: Some hedge funds may be taking profit on gold-heavy exposure from Q1’s rally.
Rise of risk appetite despite cracks: Markets are forward-pricing trade peace and earnings resilience, possibly too early. Gold might not be in trouble, but it’s on the bench. Unless something reignites fear (e.g., Fed policy mistake, Middle East flashpoint, or economic shock), capital may stay elsewhere.
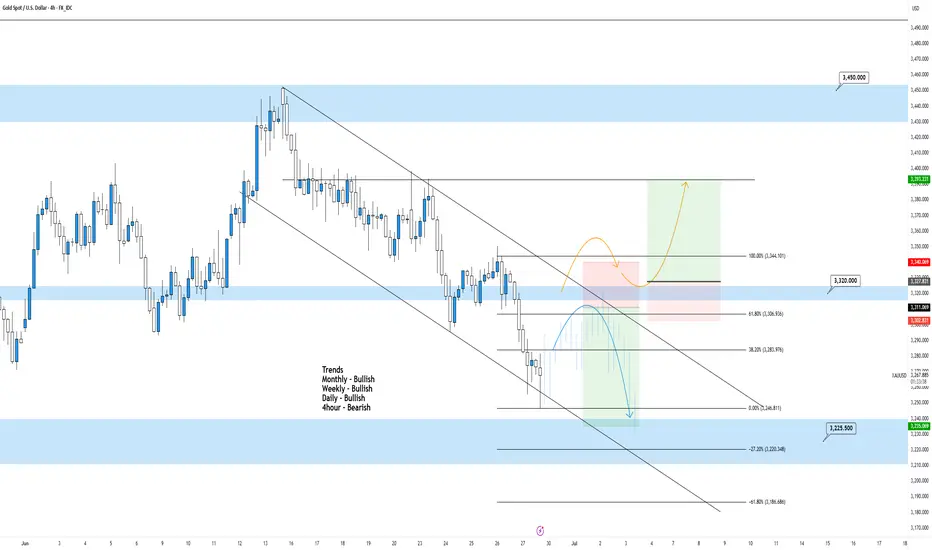
XAUUSD 4hour TF - June 29th, 2025XAUUSD 4hour Neutral Idea
Monthly - Bullish
Weekly - Bullish
Daily - Bullish
4hour - Bearish
Gold has been on the rally of a century for a while and isn’t showing too many signs of slowing down long term. For now we do have a couple opportunities I can bring to your attention.
4hour bearish continuation - For this to happen we would like to see price action come back to our pocket of confluence near the 3,320.000 level followed by bearish conviction. If this happens look to target lower toward major support levels like 3,225.500.
4hour trend reversal - If we are to see a reversal of the 4hour trend we would need to see price action pop back above the 3,320.000 resistance area. Look for strong bullish conviction above this level and target higher toward appropriate levels of resistance.
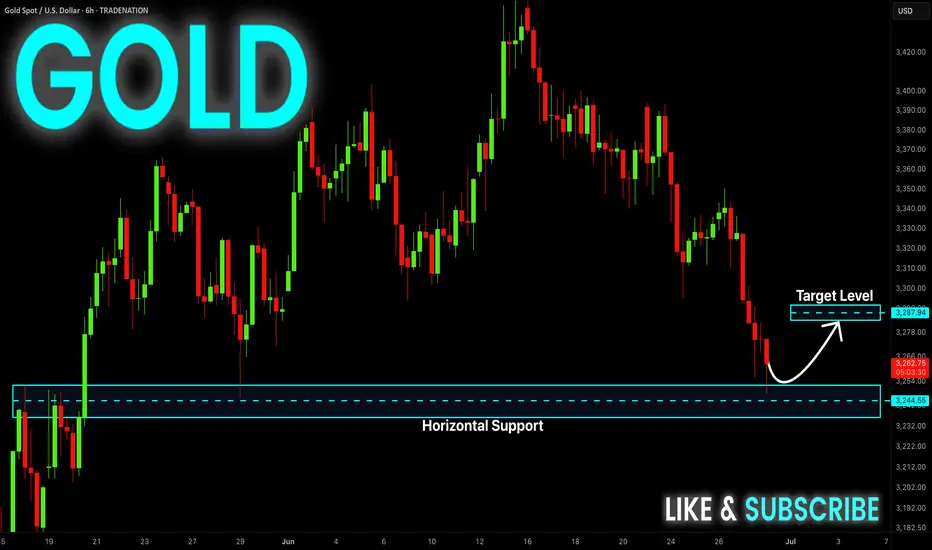
GOLD Support Ahead! Buy!
Hello,Traders!
GOLD keeps falling just
As I predicted but the price
Will soon hit a horizontal support
Around 3235$ from where we
Will be expecting a local
Bullish rebound
Buy!
Comment and subscribe to help us grow!
Check out other forecasts below too!
Disclosure: I am part of Trade Nation's Influencer program and receive a monthly fee for using their TradingView charts in my analysis.
Gold Holds Above $3340 as Dollar Drops and Fed Uncertainty Rises GOLD OVERVIEW
Gold Holds Gains as Dollar Weakens and Fed Uncertainty Grows
Gold climbed above $3,340 per ounce on Thursday, supported by a sharp decline in the U.S. dollar amid growing dovish expectations from the Federal Reserve.
Adding to market speculation, U.S. President Donald Trump hinted he may announce a new Fed Chair as early as September or October, potentially reducing Jerome Powell’s influence before his term ends in June and boosting expectations for a more accommodative policy stance.
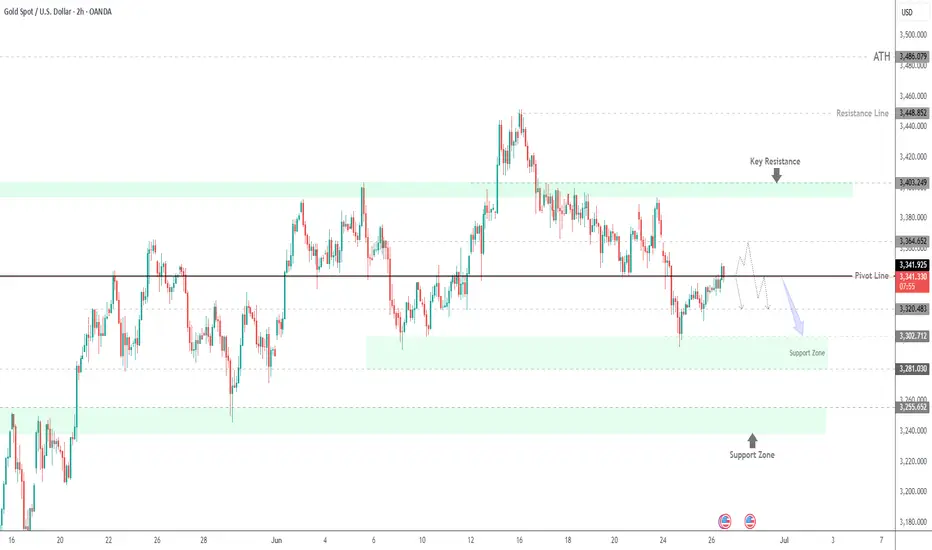
TECHNICAL OUTLOOK – XAU/USD
Gold shows bearish potential if the price can stabilize below the pivot level at 3,341.
However, while trading above 3,341, a short-term correction toward 3,364–3,365 is likely before any renewed selling pressure.
Today’s U.S. GDP release may add further volatility and direction to the market.
Key Levels
Pivot Line: 3,341
Resistance: 3,364 → 3,373
Support: 3,320 → 3,302
previous idea: