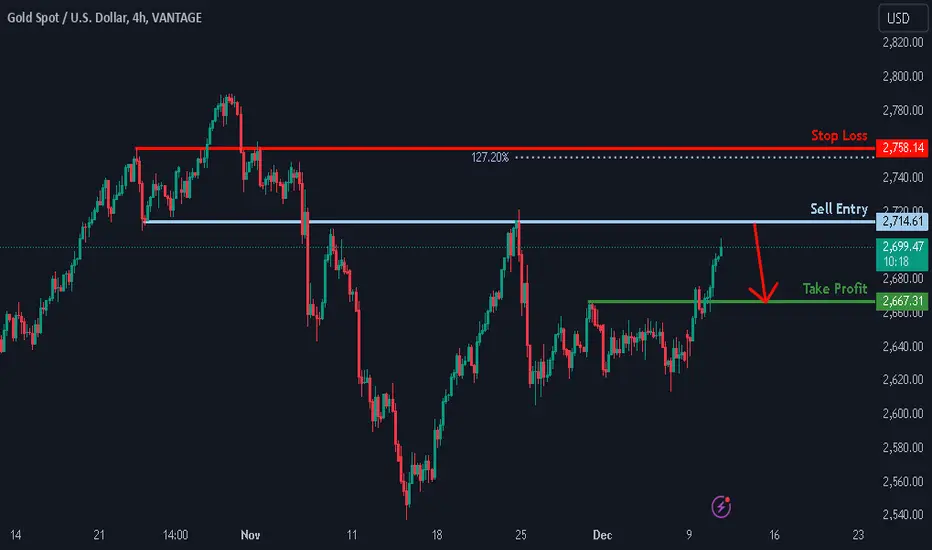
Overlap resistance ahead?XAU/USD is rising towards the resistance level which is an overlap resistance and could reverse from this level to our take profit.
Entry: 2,714.61
Why we like it:
There is a pullback support level.
Stop loss: 2,758.14
Why we like it:
there is a pullback resistance level that aligns with the 127.2% Fibonacci extension.
Take profit: 2,667.31
Why we like it:
There is a pullback support level.
Enjoying your TradingView experience? Review us!
Please be advised that the information presented on TradingView is provided to Vantage (‘Vantage Global Limited’, ‘we’) by a third-party provider (‘Everest Fortune Group’). Please be reminded that you are solely responsible for the trading decisions on your account. There is a very high degree of risk involved in trading. Any information and/or content is intended entirely for research, educational and informational purposes only and does not constitute investment or consultation advice or investment strategy. The information is not tailored to the investment needs of any specific person and therefore does not involve a consideration of any of the investment objectives, financial situation or needs of any viewer that may receive it. Kindly also note that past performance is not a reliable indicator of future results. Actual results may differ materially from those anticipated in forward-looking or past performance statements. We assume no liability as to the accuracy or completeness of any of the information and/or content provided herein and the Company cannot be held responsible for any omission, mistake nor for any loss or damage including without limitation to any loss of profit which may arise from reliance on any information supplied by Everest Fortune Group.
J-XAU
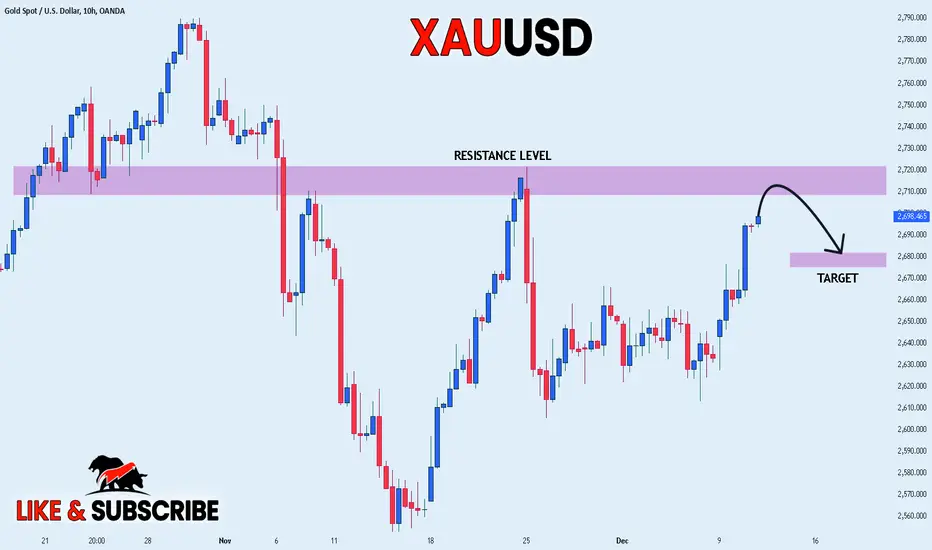
GOLD RESISTANCE AHEAD|SHORT|
✅GOLD is approaching a supply level of 2,720$
So according to our strategy
We will be looking for the signs of the reversal in the trend
To jump onto the bearish bandwagon just on time to get the best
Risk reward ratio for us
SHORT🔥
✅Like and subscribe to never miss a new idea!✅
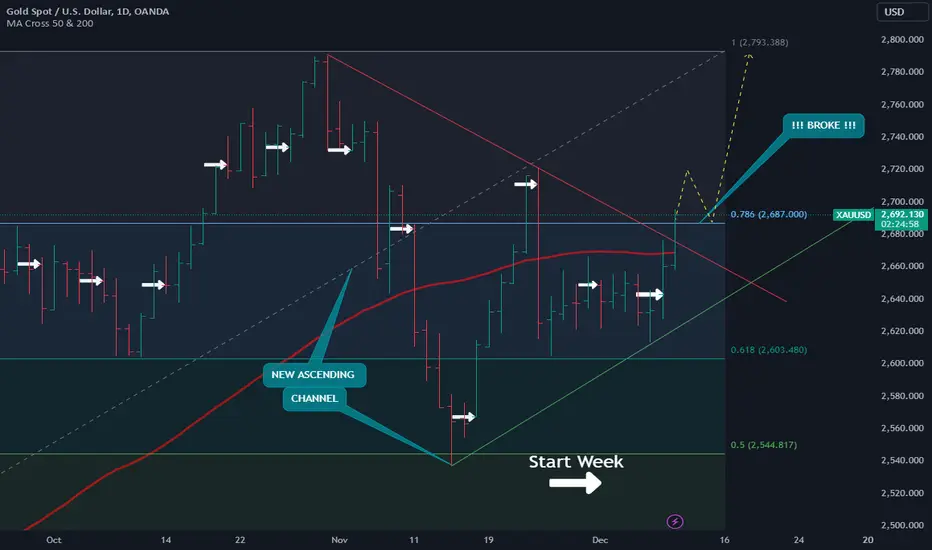
!!! GOLD !!! - New Ascending channelHi,
We have a break above a Fibonacci line indicating a possible price run up
This is just an idea!
Be careful!
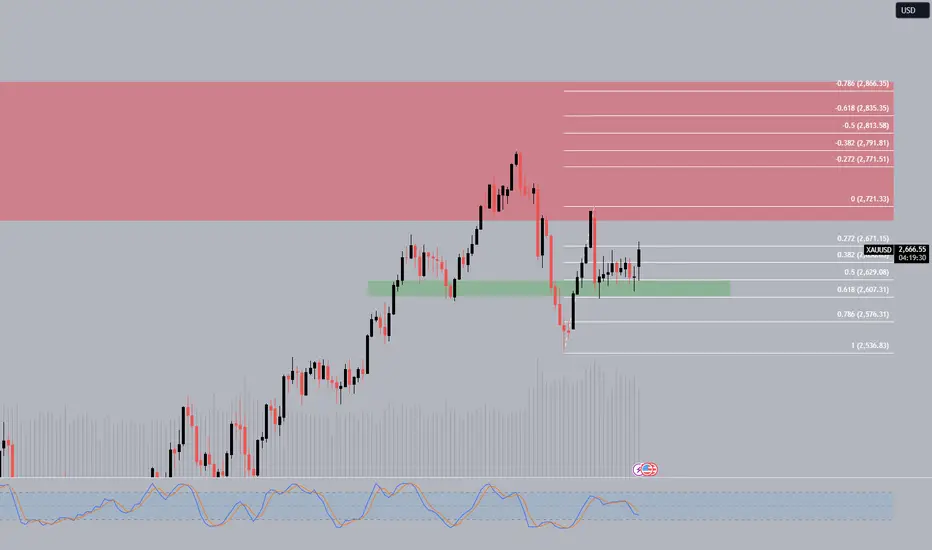
GOLD - Price can bounce from resistance level and start to fallHi guys, this is my overview for XAUUSD, feel free to check it and write your feedback in comments👊
Some time ago price made a strong upward impulse to $2720 points, thereby breaking $2665 level.
But then, price turned around and started to decline inside triangle, breaking $2665 level one more time.
Next, Gold fell to support area, after which started to grow and soon reached $2665 level, after which made a correction.
Later price rose to resistance line of triangle, after which corrected to $2620 support level and then started to grow.
Recently, Gold reached resistance line of the triangle, exited from this pattern, and even made retest.
Now price trades below the resistance level and I think Gold can bounce down from this level to $2630
If this post is useful to you, you can support me with like/boost and advice in comments❤️

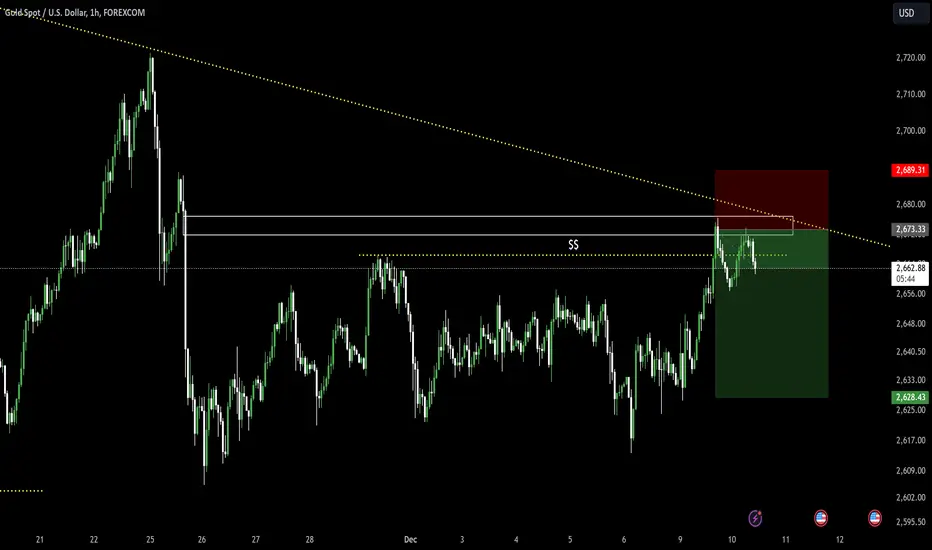
XAUUSD shortGold in the short term and on the 1-hour timeframe as a risky move (since it goes against the main trend).
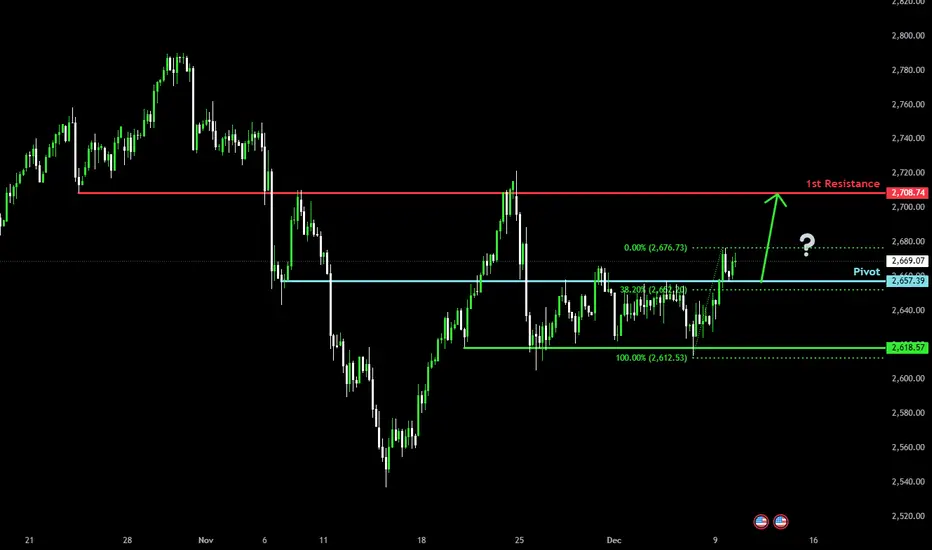
Bullish bounce off overlap support?The Gold (XAU/USD) is reacting off the pivot which has been identified as an overlap support and could bounce to the 1st resistance which acts as an overlap resistance.
Pivot: 2,657.39
1st Support: 2,618.57
1st Resistance: 2,708.74
Risk Warning:
Trading Forex and CFDs carries a high level of risk to your capital and you should only trade with money you can afford to lose. Trading Forex and CFDs may not be suitable for all investors, so please ensure that you fully understand the risks involved and seek independent advice if necessary.
Disclaimer:
The above opinions given constitute general market commentary, and do not constitute the opinion or advice of IC Markets or any form of personal or investment advice.
Any opinions, news, research, analyses, prices, other information, or links to third-party sites contained on this website are provided on an "as-is" basis, are intended only to be informative, is not an advice nor a recommendation, nor research, or a record of our trading prices, or an offer of, or solicitation for a transaction in any financial instrument and thus should not be treated as such. The information provided does not involve any specific investment objectives, financial situation and needs of any specific person who may receive it. Please be aware, that past performance is not a reliable indicator of future performance and/or results. Past Performance or Forward-looking scenarios based upon the reasonable beliefs of the third-party provider are not a guarantee of future performance. Actual results may differ materially from those anticipated in forward-looking or past performance statements. IC Markets makes no representation or warranty and assumes no liability as to the accuracy or completeness of the information provided, nor any loss arising from any investment based on a recommendation, forecast or any information supplied by any third-party.
Last Leg XAUOverall uptrend still needs a leg to complete its wave.
Considering higher lows of around -10%, the recent drop is the 4th point in our Elliot Wave analysis.
Last leg is to form the head and shoulders, synonym of long term tops.
I think the focus will be towards currencies, with countries focusing on Trumponomics, strengthening currencies for the dollar against tariffs. PBOC just reached an ATH in their gold hoarding.
Dollar itself might feel some headwind, because of the recent rise in DXY, a cool down soon is expected with my lower yields analysis. This would go well with foreign currencies reaching up while some headwind causes the USD to lag.
Let's see
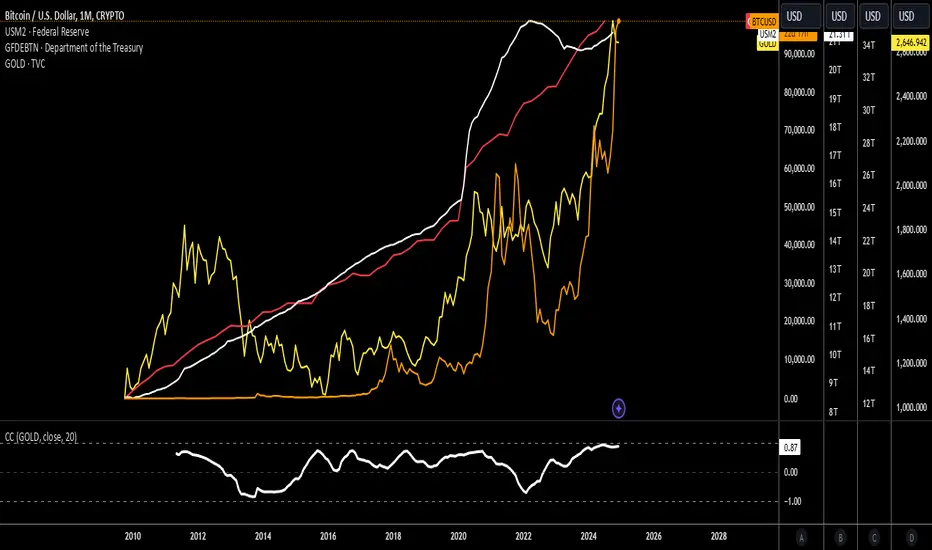
All Stars Aligned: Bitcoin, Gold, Fiat, and DebtThis post explores the idea that Bitcoin, often referred to as "digital gold," might one day replace gold as the preferred store of value.
Gold’s price (shown in yellow) has traditionally been sensitive to inflation, which is influenced by money printing, as indicated by the US M2 money supply (shown in white on the chart). Geopolitical and economic insecurity also drives demand for gold, the "safe-haven" metal. To add further context, I've also included US debt (shown in red).
The chart reveals that the market seems to have found some form of equilibrium at current levels, with gold’s price finally tracking the M2 money supply and debt parameters closely. Interestingly, Bitcoin (shown in orange) has mirrored this behavior in a similar fast-paced manner.
Around the $3,000 mark for gold and near $100,000 for Bitcoin, both assets are aligning with the money supply and debt trends. This suggests that any further price increases could be limited unless additional money is printed or debt increases. Of course, a Black Swan event could disrupt this equilibrium at any time.
I also used TradingView’s Correlation Coefficient tool to examine the relationship between Bitcoin and gold. The correlation is impressively high at 0.87, indicating an almost perfect alignment between the two assets.
The chart supports the idea that Bitcoin is tracking gold closely, strengthening the notion that Bitcoin could indeed be positioning itself as the "digital gold" of the future.
Let me know your thoughts in the comments below!
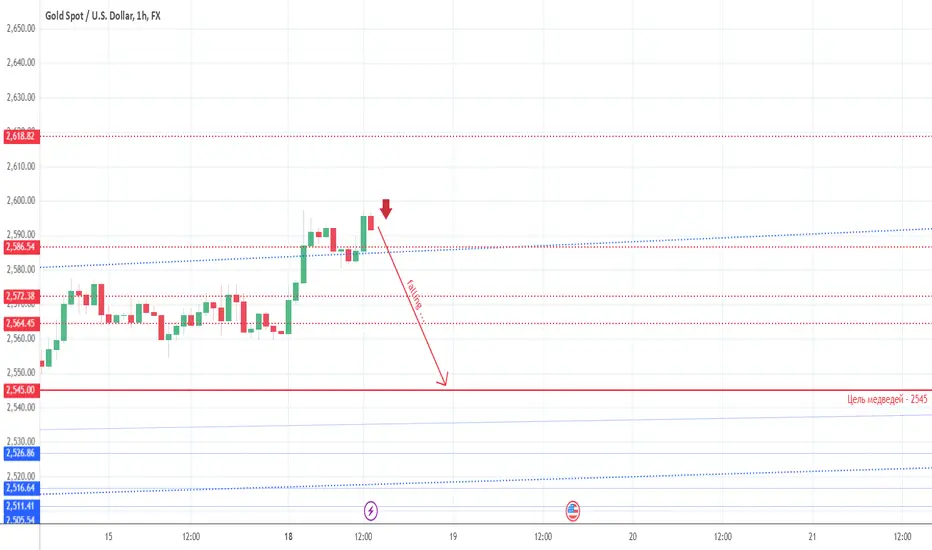
XAUUSD (Gold), falling to 2545 secondlyHi everybody. Gold want try fall to support lavel 2545. On 4H we have good bears accumulation process BUT there is strong re-sell on 2572 and higher. Levels thanks to X-Lines script. Have a nice trading week ;)
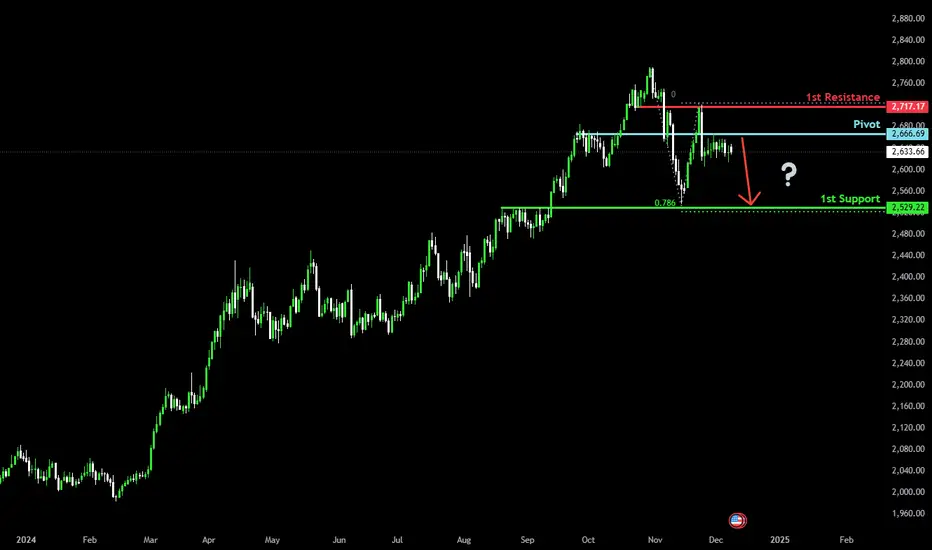
Potential bearish drop?The Gold (XAU/USD) is reacting off the pivot which has been identified as a pullback resistance and could drop to the 1st support which acts as an overlap support.
Pivot: 2,666.69
1st Support: 2,529.22
1st Support: 2,529.22
Risk Warning:
Trading Forex and CFDs carries a high level of risk to your capital and you should only trade with money you can afford to lose. Trading Forex and CFDs may not be suitable for all investors, so please ensure that you fully understand the risks involved and seek independent advice if necessary.
Disclaimer:
The above opinions given constitute general market commentary, and do not constitute the opinion or advice of IC Markets or any form of personal or investment advice.
Any opinions, news, research, analyses, prices, other information, or links to third-party sites contained on this website are provided on an "as-is" basis, are intended only to be informative, is not an advice nor a recommendation, nor research, or a record of our trading prices, or an offer of, or solicitation for a transaction in any financial instrument and thus should not be treated as such. The information provided does not involve any specific investment objectives, financial situation and needs of any specific person who may receive it. Please be aware, that past performance is not a reliable indicator of future performance and/or results. Past Performance or Forward-looking scenarios based upon the reasonable beliefs of the third-party provider are not a guarantee of future performance. Actual results may differ materially from those anticipated in forward-looking or past performance statements. IC Markets makes no representation or warranty and assumes no liability as to the accuracy or completeness of the information provided, nor any loss arising from any investment based on a recommendation, forecast or any information supplied by any third-party.
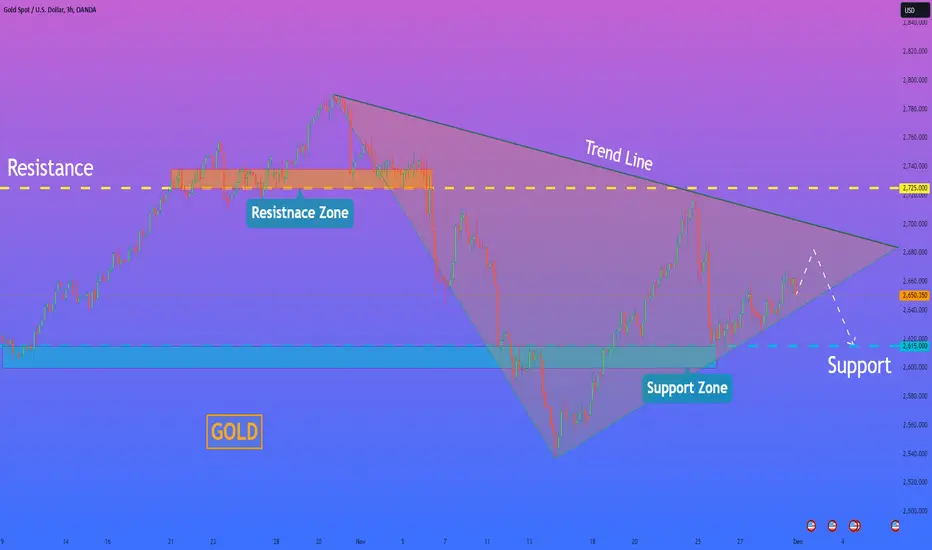
HelenP. I Gold can fall to support level and then start to growHi folks today I'm prepared for you Gold analytics. In this chart, we can see how the price rose to the resistance level, which coincided with the resistance zone and soon broke it. After this, the price some time traded near the 2720 level and later rebounded up to the trend line. Then Gold turned around and started to decline inside the triangle, where it in a short time declined below the 2720 level, and broke it one more time. Then XAU declined a little more, after which rose a little and then continued to decline to the support level, which coincided with the support level. When the price fell to this level, it broke it and fell to 2536 points, but at once turned around and made impulse up, breaking the support level one more time. After this, the price rose to the trend line, then at once dropped back and some time traded near this level. At the moment, the price continues to trades near this level, and in my mind, XAUUSD will decline to the support level and then start to grow to the trend line, Therefore I set my goal at 2670 points, which coincided with this line. If you like my analytics you may support me with your like/comment ❤️

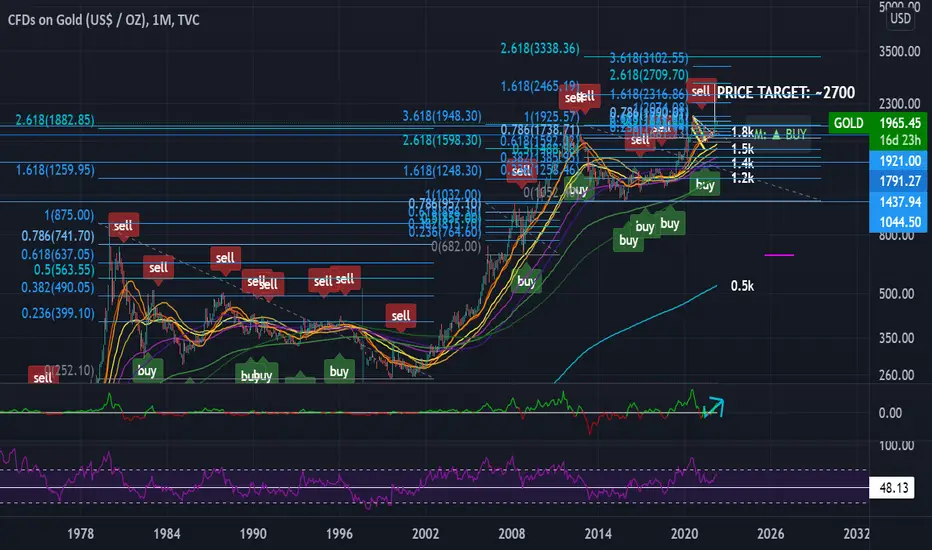
Gold can exit from pennant and rise to 2700 pointsHello traders, I want share with you my opinion about Gold. By observing the chart, we can see that the price rebounded from the support line and later dropped to the resistance level, which coincided with the seller zone. After this, the price made impulse down to the support line, breaking the 2720 level, and then tried to grow, but failed and continued to decline next. Then Gold reached the support level, which coincided with the buyer zone, and broke it too, after which Gold dropped to the support line. Next, the price turned around and started to grow inside the upward pennant, where it soon reached the 2615 level and even broke it one more time. After this, XAU continued to grow until it reached the resistance level, which coincided with the resistance line of the pennant, and then turned around and made a correction movement. Price fell to the support level, some time traded near this level, and then rose to the resistance line of the pennant, but later it rebounded and fell back to the 2615 support level. Recently it started to grow and at the moment I think that the price can correct to support line and then rebound up, thereby exiting from the pennant pattern. Next, Gold will continue to grow, so, I set my TP at 2700 points. Please share this idea with your friends and click Boost 🚀

R2F Weekly Analysis - 8th December 2024 (ICT Concepts)Welcome to another R2F Weekly Market Analysis using ICT Concepts along with my own discoveries. I'm going to go through various assets/markets, and give a real-time view of how I perform my analysis on the weekends. I'll give my take on what has been happening, and what I'm expecting in either the coming days, weeks, or months. Without further ado, let's get into it!
- R2F

GOLD Outlook2.618 fib Cup
3.618 fib Handle
Wolfpack Green wave
RSI: Room for overbought + future div
2023 Recession = Safety in Metals
Measured Cup & Handle Target 1: $2700 - confluent with 2.618 handle fib!
Target 2: $3000 Max extension
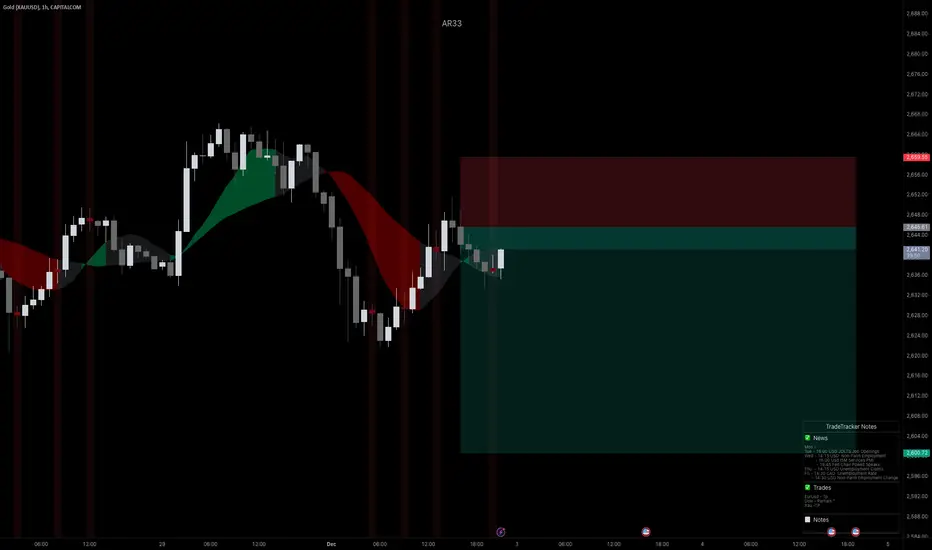
Gold Short: Capitalizing on Sunday Open RejectionGold has shown a strong rejection of the $2,650 price area after retracing to the Sunday open levels, aligning with the prevailing higher time frame (HTF) bearish trend. This trade is engaged to capitalize on the downside potential as the price fails to break the dynamic resistance at $2,650. With the support of the HTF momentum and a clear rejection, the trade setup focuses on targeting the lower support levels in the $2,610-$2,600 zone while maintaining a disciplined approach to risk management.
Technical Analysis:
Daily Chart:
• Price struggles below the mildly bearish 20 SMA.
• Both 100 and 200 SMAs maintain their bearish slopes, confirming the downtrend.
• Momentum indicators remain neutral, supporting the absence of bullish reversal signs.
4-Hour Chart:
• XAU/USD trades below the flat 20 SMA while hovering near a directionless 100 SMA.
• The 200 SMA around $2,690 acts as dynamic resistance, pushing prices lower.
• Indicators are aligned with bearish momentum, suggesting further downside.
• Support Levels: $2,626.70, $2,611.35, $2,598.70
• Resistance Levels: $2,643.30, $2,655.00, $2,671.55
Fundamental Analysis:
The US Dollar’s strength continues to weigh on Gold prices, driven by robust macroeconomic data:
• ISM Manufacturing PMI: Revised upward to 49.7, better than expected, supporting USD strength.
• Wall Street Sentiment: Mixed trading as geopolitical tensions between the US and Russia persist.
• Upcoming Events: Markets anticipate key US employment data, particularly the Nonfarm Payrolls (NFP) report on Friday, which could bring additional volatility to XAU/USD.
Trade Management:
• Entry near $2,645 with clear rejection signals.
• Stop Loss: Placed above $2,659 to manage risk efficiently.
• Targets: Initial take profit at $2,622, with a potential extension to $2,610.
• Risk Management: Adhering to the bearish trend, the trade will be closely monitored, especially as the US Nonfarm Payrolls data approaches.
• Risk Management: Trail stops as price moves lower. Monitor market reactions closely, especially around major support and resistance zones, and adapt as Nonfarm Payrolls approach.
Note: Please remember to adjust this trade idea according to your individual trading conditions, including position size, broker-specific price variations, and any relevant external factors. Every trader’s situation is unique, so it’s crucial to tailor your approach to your own risk tolerance and market environment.
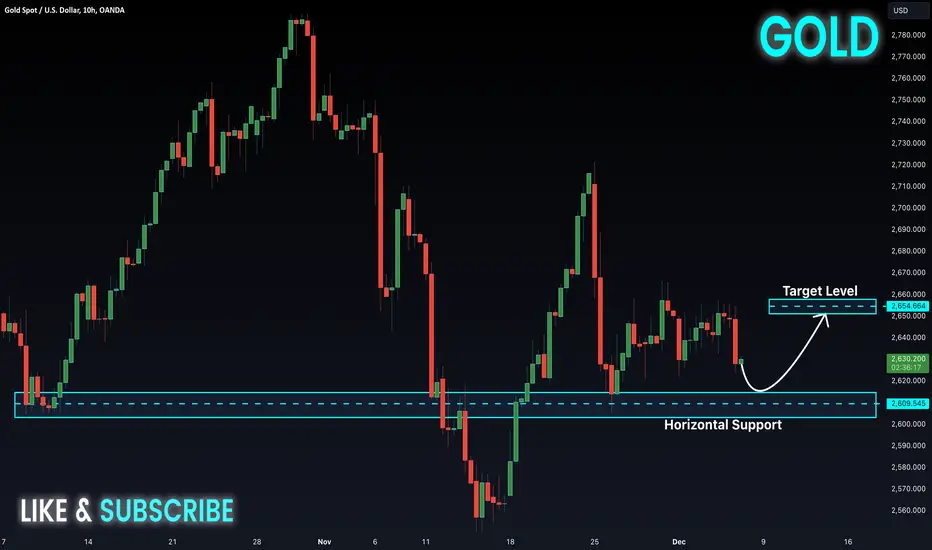
GOLD Local Long From Support! Buy!
Hello,Traders!
GOLD is going down
Locally but a horizontal
Support level is ahead
At 2600$ from where
We will be expecting a
Local bullish rebound
Buy!
Comment and subscribe to help us grow!
Check out other forecasts below too!
GOLD - Price can exit from pennant and then bounce upHi guys, this is my overview for XAUUSD, feel free to check it and write your feedback in comments👊
A few moments ago price entered to falling channel, where soon broke $2720 level and then fell to support line.
After this, price rose to resistance line and then continued to fall, until it broke $2610 level and fell to $2536 points.
Then price turned around and started to grow in pennant, exiting from falling channel and soon breaking $2610 level.
Later Gold rose to resistance level, which coincided with resistance line of pennant, which bounced down.
Next, price was corrected to support level and some time traded near, and at the moment, XAU trades close support line.
In my mind, price can leave pennant and then bounce up to $2720 resistance level.
If this post is useful to you, you can support me with like/boost and advice in comments❤️

Gold AnalysisOn the daily timeframe, we anticipate a downward movement in gold to the 2580 level. Upon reaching the daily ascending trendline, a price rebound toward the 2670 range and interaction with the 4-hour descending trendline is not unexpected.
This analysis is brought to you by the FXonbit Traders Team
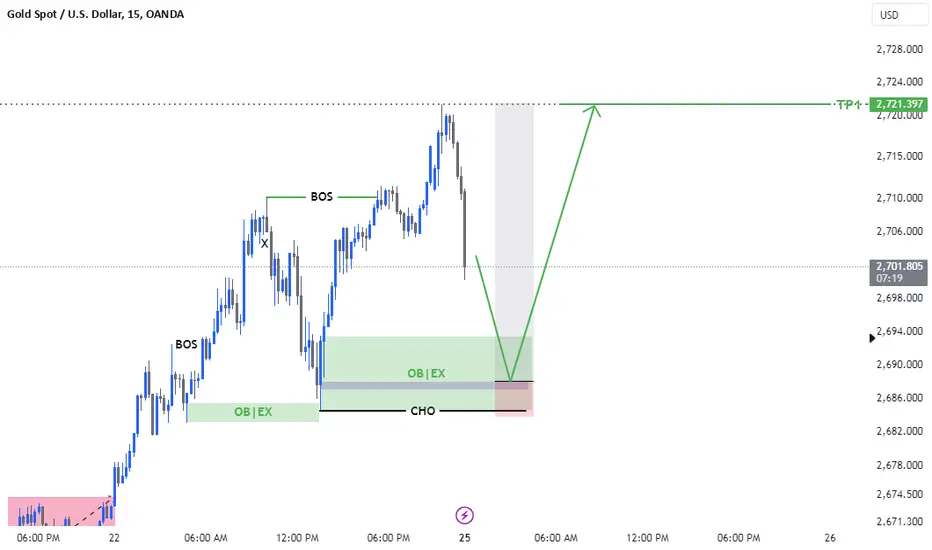
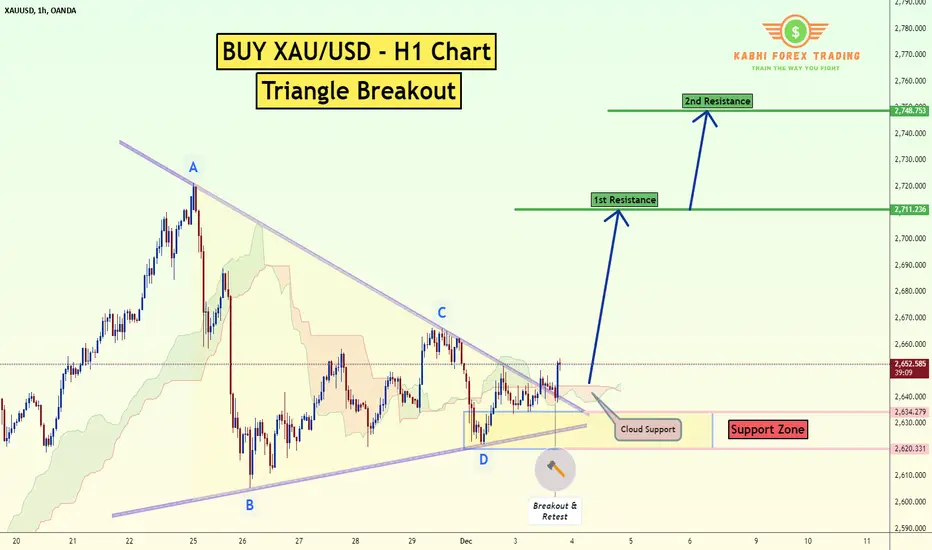
XAU/USD (Gold) - H1 - Triangle BreakoutThe XAU/USD pair on the H1 timeframe presents a Potential Buying Opportunity due to a recent breakout from a Triangle Pattern. This suggests a shift in momentum towards the upside and a higher likelihood of further advances in the coming Days.
Possible Long Trade:
Entry: Consider Entering A Long Position Above The Broken Trendline Of The Triangle After Confirmation. Ideally, This Would Be Around 2652
Target Levels:
1st Resistance – 2711
2nd Resistance – 2748
Your likes and comments are incredibly motivating and will encourage me to share more analysis with you.
Best Regards, KABHI FOREX TRADING
Thank you.
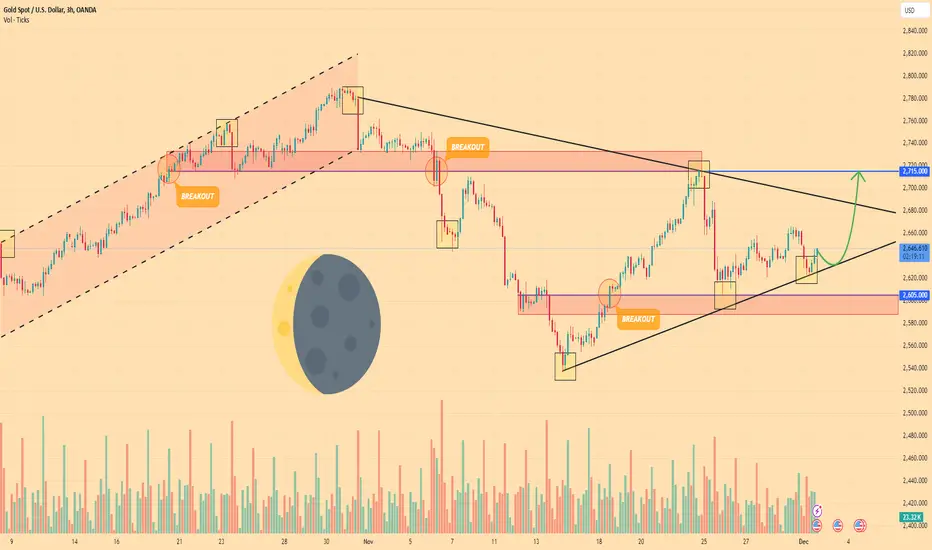
GOLD - Price can correct to support line and start to riseHi guys, this is my overview for XAUUSD, feel free to check it and write your feedback in comments👊
Some days ago price entered to rising channel, where it rose to $2715 level and broke it, after which made retest.
Then it rose to resistance line of channel, after which little declined and then continued to grow.
When price rose to $2790 points, it turned around and started to decline, thereby exiting from channel.
Gold continued to fall inside triangle, where it fell until to $2537 points, breaking $2715 and $2605 levels.
Price rose to resistance line, breaking $2605 level, after which made correction and now XAU rising near support line.
Possibly, Gold can bounce up from support line to $2715 resistance level, exiting from triangle.
If this post is useful to you, you can support me with like/boost and advice in comments❤️
HelenP. I Gold can grow a little and then drop to support levelHi folks today I'm prepared for you Gold analytics. Some time ago price fell to the support level, which coincided with the support zone, and then turned around and started to grow. In a short time price rose to the resistance level, which coincided with the resistance zone and even entered to this area, and some time traded inside. Later Gold rose to the trend line and then started to decline. Price quickly fell lower 2725 level, breaking it, and continued to decline to the support level. When the price reached the 2615 level, it broke this level and fell until to 2536 points, after which turned around and in a short time rose to the 2615 level and broke it again. Then price continued to move up to the trend line and when it reached this line, it turned around and made an impulse down to support the level back. But a few moments ago it started to move up. So, at the moment, I expect that XAUUSD can rise a little more and then turn around and fall to the support level. That's why I set my goal at 2615 points. If you like my analytics you may support me with your like/comment ❤️
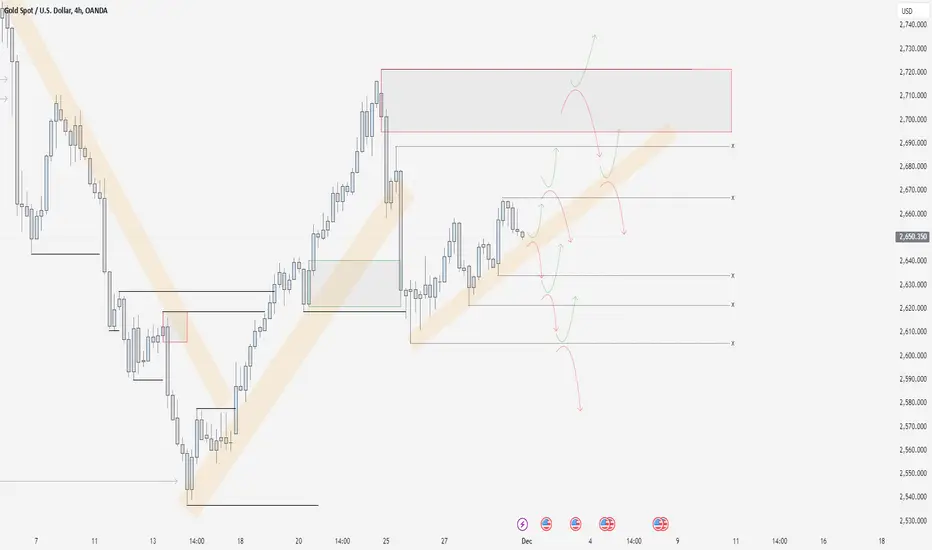
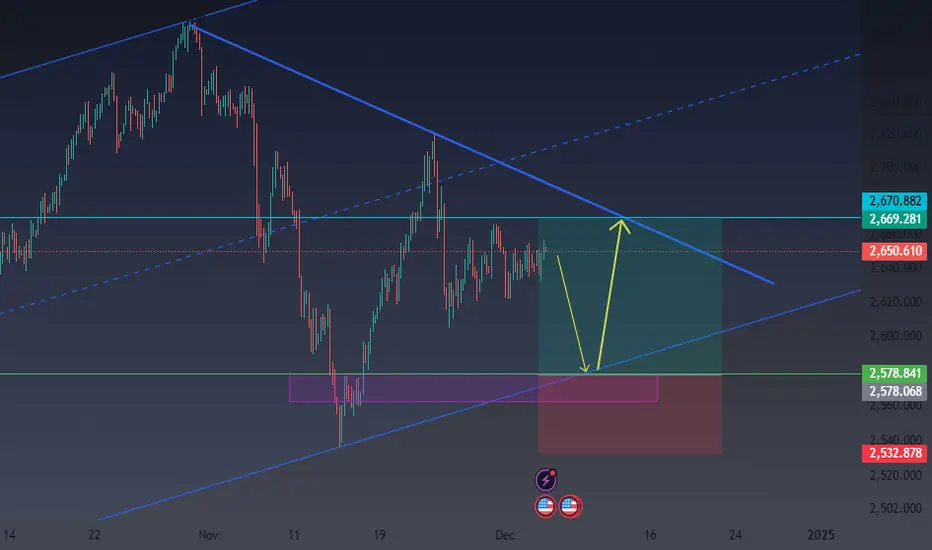
XAUUSD 1/12/24Heading into a new week with a fresh bias on gold, we maintain an overall short bias and aim to follow it. However, we are fully aware that the chances of gold moving long are relatively high. Because of this, we advise caution. Gold can be a challenging asset to trade due to its sensitivity to fundamentals and potential counter-bias movements.
Regardless, we stick to our data-proven ruleset. Currently, we are monitoring two key areas: the liquidity highs above the current price and the supply zone at the top of the last major high. These areas may offer good opportunities for a sell move. However, we are more inclined to see a sweep of a major high followed by a sell-off, aligning with our expected short bias.
Additionally, the upward-moving institutional average suggests that if gold begins to trade below this level, it could further support our anticipated downward move.
Trade safely, and stick to your plan and risk management strategy!