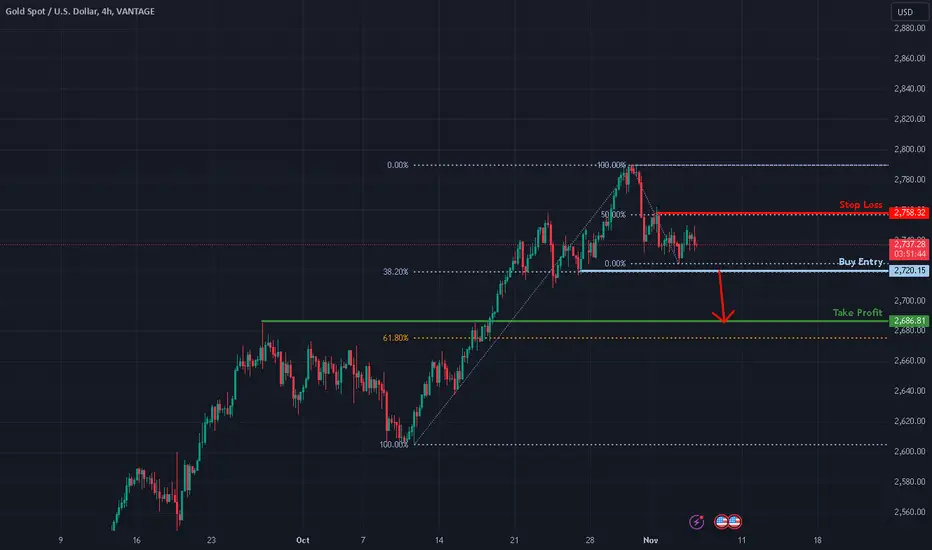
Bearish breakout?XAU/USD is falling towards the support level which is a pullback support which aligns with the 38.2% Fibonacci retracement and could drop from this level to our take profit.
Entry: 2,720.15
Why we like it:
There is a pullback support level that aligns with the 38.2% Fibonacci retracement.
Stop loss: 2,758.32
Why we like it:
There is a pullback resistance level that lines up with the 50% Fibonacci retracement.
Take profit: 2,686.32
Why we like it:
There is a pullback support level that is slightly above the 61.8% Fibonacci retracement.
Enjoying your TradingView experience? Review us!
Please be advised that the information presented on TradingView is provided to Vantage (‘Vantage Global Limited’, ‘we’) by a third-party provider (‘Everest Fortune Group’). Please be reminded that you are solely responsible for the trading decisions on your account. There is a very high degree of risk involved in trading. Any information and/or content is intended entirely for research, educational and informational purposes only and does not constitute investment or consultation advice or investment strategy. The information is not tailored to the investment needs of any specific person and therefore does not involve a consideration of any of the investment objectives, financial situation or needs of any viewer that may receive it. Kindly also note that past performance is not a reliable indicator of future results. Actual results may differ materially from those anticipated in forward-looking or past performance statements. We assume no liability as to the accuracy or completeness of any of the information and/or content provided herein and the Company cannot be held responsible for any omission, mistake nor for any loss or damage including without limitation to any loss of profit which may arise from reliance on any information supplied by Everest Fortune Group.
J-XAU
Bearish drop?XAU/USD is rising towards the pivot and could drop from this level to the pullback support.
Pivot: 2,758.49
1st Support: 2,720.04
1st Resistance: 2,791.74
Risk Warning:
Trading Forex and CFDs carries a high level of risk to your capital and you should only trade with money you can afford to lose. Trading Forex and CFDs may not be suitable for all investors, so please ensure that you fully understand the risks involved and seek independent advice if necessary.
Disclaimer:
The above opinions given constitute general market commentary, and do not constitute the opinion or advice of IC Markets or any form of personal or investment advice.
Any opinions, news, research, analyses, prices, other information, or links to third-party sites contained on this website are provided on an "as-is" basis, are intended only to be informative, is not an advice nor a recommendation, nor research, or a record of our trading prices, or an offer of, or solicitation for a transaction in any financial instrument and thus should not be treated as such. The information provided does not involve any specific investment objectives, financial situation and needs of any specific person who may receive it. Please be aware, that past performance is not a reliable indicator of future performance and/or results. Past Performance or Forward-looking scenarios based upon the reasonable beliefs of the third-party provider are not a guarantee of future performance. Actual results may differ materially from those anticipated in forward-looking or past performance statements. IC Markets makes no representation or warranty and assumes no liability as to the accuracy or completeness of the information provided, nor any loss arising from any investment based on a recommendation, forecast or any information supplied by any third-party.

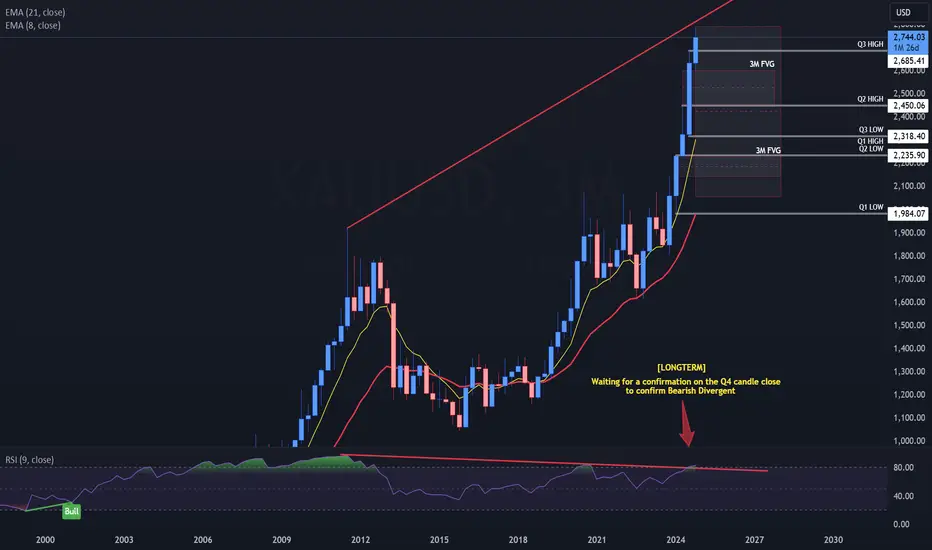
XAUUSD - Gold 3Month (quarterly)Overview:
Gold and silver have performed remarkablely in 2024, emerging as the two best-performing assets of the year. Precious metals often serve as safe-haven assets during times of economic uncertainty, and this year has proven no exception. Investors have flocked to them as hedges against inflation and market volatility, helping to drive their values upward.
By the end of October, silver had surged by 42.4 percent, a dramatic increase that reflects growing demand and limited supply. Gold, similarly, has gained 33.7 percent, solidifying its role as a reliable store of value. These gains in the precious metals market outpaced other commodities and most traditional financial assets.
For comparison, the NASDAQ—the best-performing stock index—has gained 24 percent over the same period. This robust performance in the NASDAQ reflects strength in technology stocks, yet it still falls short of the exceptional growth observed in gold and silver. Such trends highlight the unique appeal of precious metals, especially during periods of market turbulence and geopolitical tension.
Watch the RSI as another blue candle will indicate a Q4 bullish momentum that may continue into the New Year. As for a Red Q4 Candle... This may push the RSI below the 80, creating a bearish Divergence in the LONG term. This Pullback may even look like a trend reversal. Keep in mind a healthy market needs to retrace.
Key Levels:
2450
2315
2235
(Support)
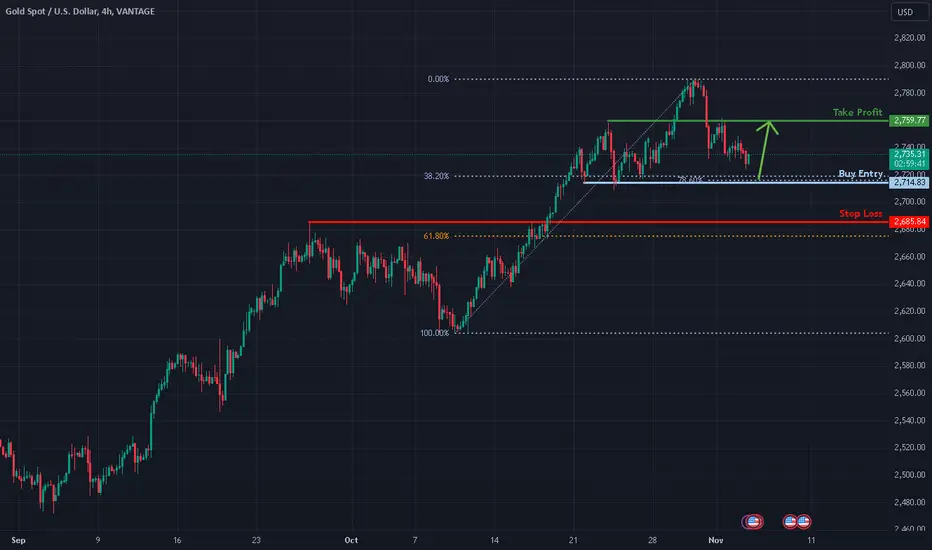
Bullish bounce?XAU/USD is falling towards the support level which is a pullback support that aligns with the 38.2% Fibonacci retracement and the 78.6% Fibonacci projection and could bounce from this level to our take profit.
Entry: 2,714.83
Why we like it:
There is a pullback support level that aligns with the 38.2% Fibonacci retracement and the 78.6% Fibonacci projection.
Stop loss: 2,685.84
Why we like it:
There is a pullback support level that is slightly above the 61.8% Fibonacci retracement.
Take profit: 2,759.77
Why we like it:
There is a pullback resistance level.
Enjoying your TradingView experience? Review us!
Please be advised that the information presented on TradingView is provided to Vantage (‘Vantage Global Limited’, ‘we’) by a third-party provider (‘Everest Fortune Group’). Please be reminded that you are solely responsible for the trading decisions on your account. There is a very high degree of risk involved in trading. Any information and/or content is intended entirely for research, educational and informational purposes only and does not constitute investment or consultation advice or investment strategy. The information is not tailored to the investment needs of any specific person and therefore does not involve a consideration of any of the investment objectives, financial situation or needs of any viewer that may receive it. Kindly also note that past performance is not a reliable indicator of future results. Actual results may differ materially from those anticipated in forward-looking or past performance statements. We assume no liability as to the accuracy or completeness of any of the information and/or content provided herein and the Company cannot be held responsible for any omission, mistake nor for any loss or damage including without limitation to any loss of profit which may arise from reliance on any information supplied by Everest Fortune Group.
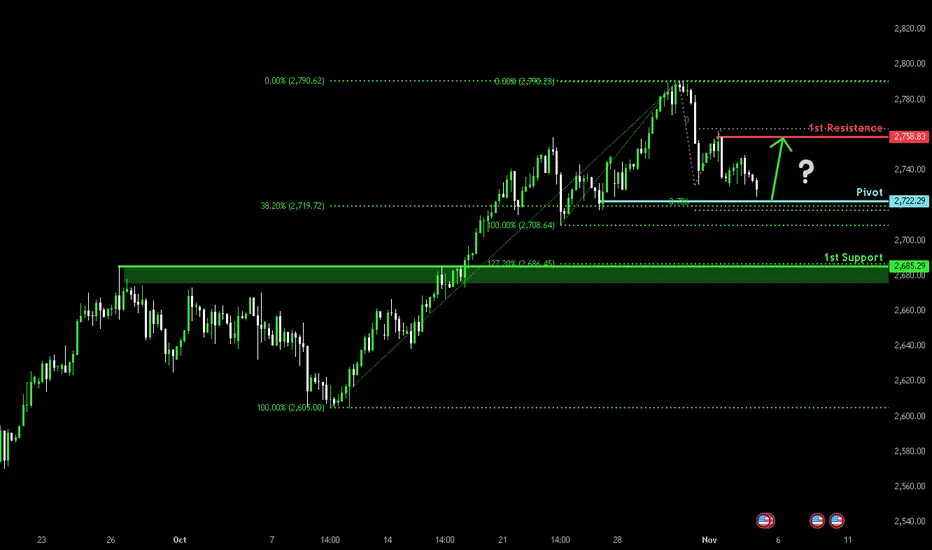
Could the Gold bounce from here?The price is falling towards the pivot and could bounce to the pullback resistance level.
Pivot: 2,722.29
1st Support: 2,685.29
1st Resistance: 2,758.83
Risk Warning:
Trading Forex and CFDs carries a high level of risk to your capital and you should only trade with money you can afford to lose. Trading Forex and CFDs may not be suitable for all investors, so please ensure that you fully understand the risks involved and seek independent advice if necessary.
Disclaimer:
The above opinions given constitute general market commentary, and do not constitute the opinion or advice of IC Markets or any form of personal or investment advice.
Any opinions, news, research, analyses, prices, other information, or links to third-party sites contained on this website are provided on an "as-is" basis, are intended only to be informative, is not an advice nor a recommendation, nor research, or a record of our trading prices, or an offer of, or solicitation for a transaction in any financial instrument and thus should not be treated as such. The information provided does not involve any specific investment objectives, financial situation and needs of any specific person who may receive it. Please be aware, that past performance is not a reliable indicator of future performance and/or results. Past Performance or Forward-looking scenarios based upon the reasonable beliefs of the third-party provider are not a guarantee of future performance. Actual results may differ materially from those anticipated in forward-looking or past performance statements. IC Markets makes no representation or warranty and assumes no liability as to the accuracy or completeness of the information provided, nor any loss arising from any investment based on a recommendation, forecast or any information supplied by any third-party.
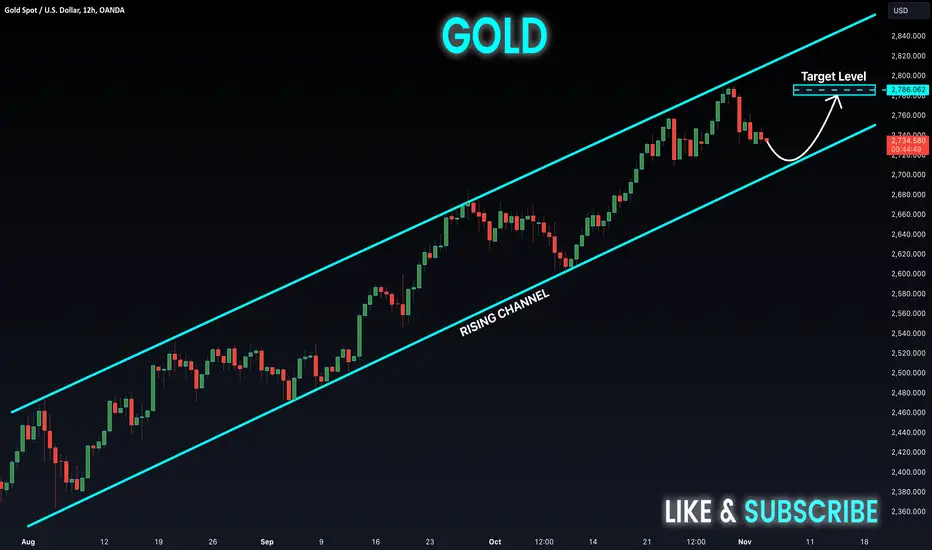
GOLD Rising Channel! Buy!
Hello,Traders!
GOLD is trading in an
Uptrend and the price
Has formed a rising
Parallel channel so
We are bullish biased
And we will be expecting
A further move up
Buy!
Like, comment and subscribe to help us grow!
Check out other forecasts below too!
XAUEUR_4Hhello
Analysis of gold against the euro Analysis based on Elliott waves The market is in a downward correction and this correction is the bottom of wave 4 in the long term, for which we are buying the market for the long term. But in the 4-hour and weekly time, the resistance is 2545.5, and by maintaining this resistance, we will fall towards 2440.0

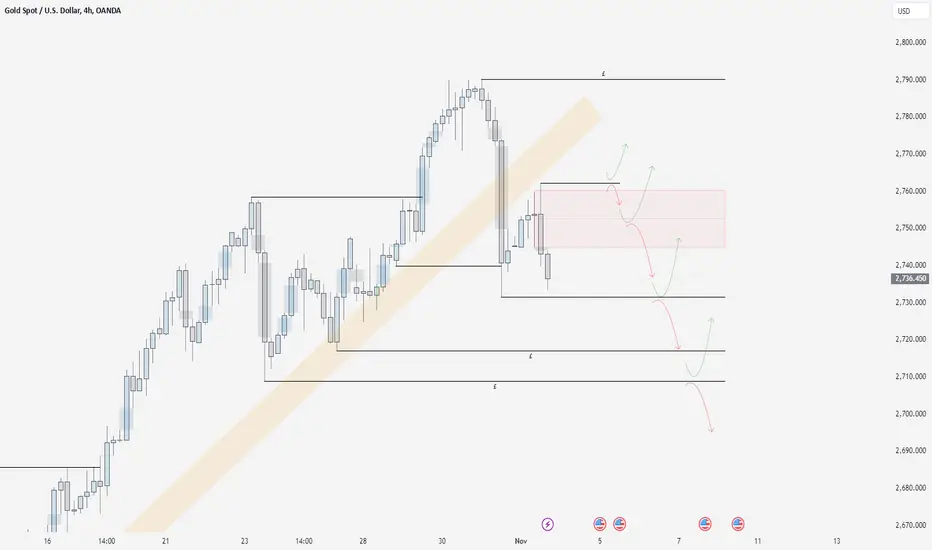
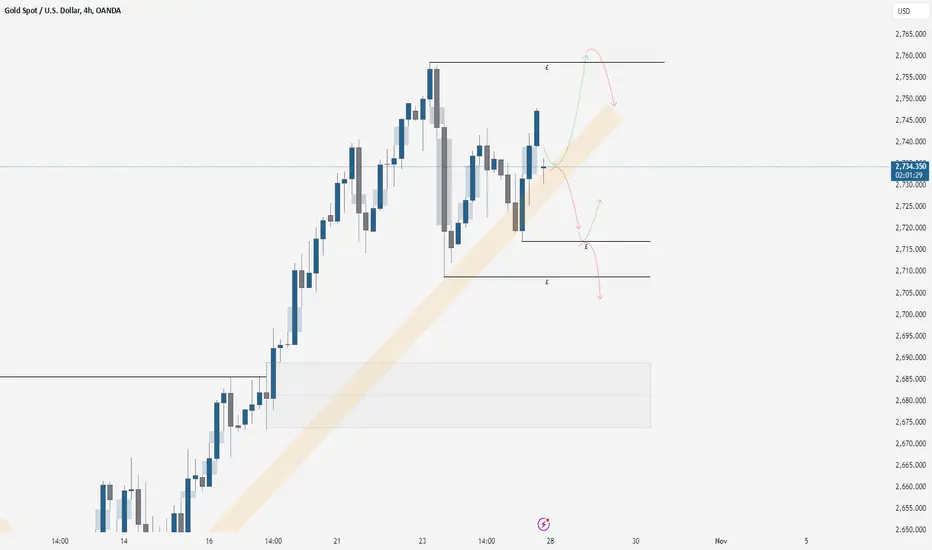
XAUUSD 3/11/24We have a short bias on gold this week, mainly to establish a better price level in case the market decides to move higher again, based on the daily timeframe gap. This is the first bearish gap in over a month, which indicates a strong chance for a possible sell-off.
We’ve marked the lows, and currently, there are no unmitigated areas of demand. Given our bearish bias, this is expected, as previous areas of demand or support are likely to be broken, allowing the price to reach a more favorable level for future buying opportunities. There’s also an area of supply marked above, which could push the price lower. However, we're primarily looking for a short-term sell-off, with a longer-term expectation of reaching all-time highs again, driven by strong fundamentals supporting gold.
This pullback is likely a temporary correction in the overall uptrend. Since we haven’t seen a pullback in a while, a correction is ultimately inevitable. Where it will end and turn bullish again is uncertain.
This week, our focus is on the liquidity levels marked for potential reactions. Trade based on current price action and follow your plan. Stick to your strategy, manage your risk, and consider the supply area as a possible point for selling into the lows.
Follow your plan and stick to your risk.
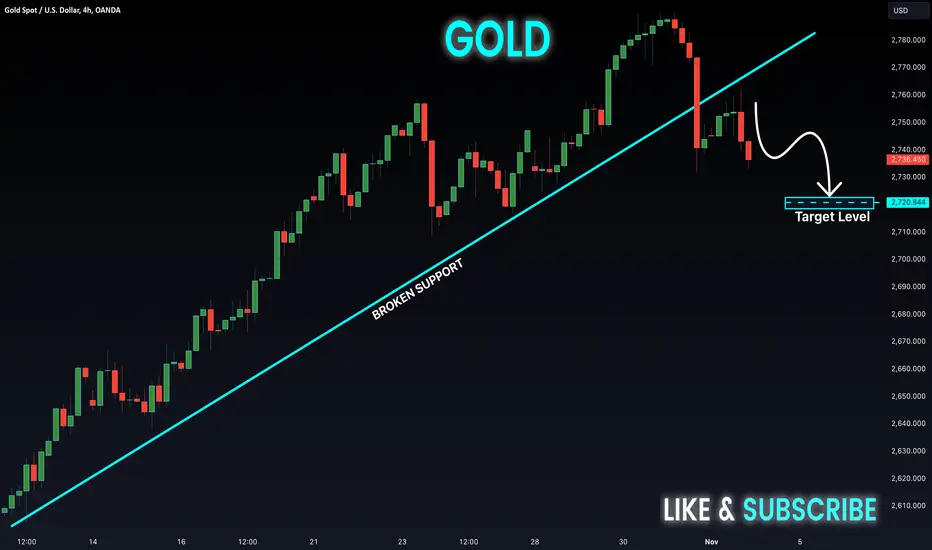
GOLD Potential Short! Sell!
Hello,Traders!
GOLD is going down
After the price made a
Retest of the broken
Rising support so we are
Bearish biased and we
Will be expecting a
Further move down
Sell!
Like, comment and subscribe to help us grow!
Check out other forecasts below too!
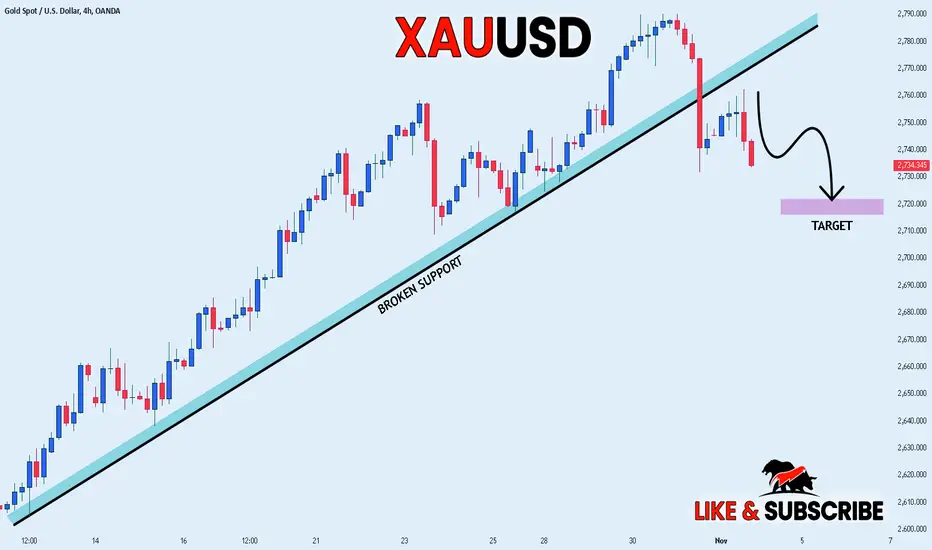
GOLD WILL GO DOWN|SHORT|
✅GOLD broke the rising
Support, then made a pullback
And is going down again in
A long-awaited correction
So we are locally bearish
Biased and we will be
Expecting a further move down
SHORT🔥
✅Like and subscribe to never miss a new idea!✅
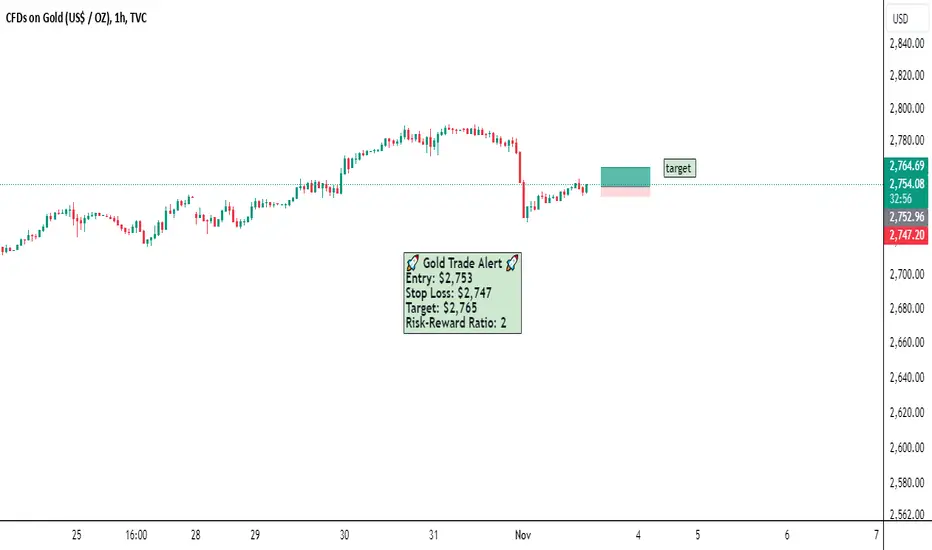
Gold Trade Alert: Targeting $2,765 with 2:1 RRTrade Setup for Gold (XAU/USD):
Entry Point: $2,753
Stop Loss: $2,747
Target: $2,765
I'm looking at a short-term entry at $2,753, aiming for a quick move up to $2,765. With a 2:1 risk-reward ratio, this trade has a tight stop, making it a calculated play. Watch out for momentum around the entry level, and manage risk carefully. Let's see how the market responds!
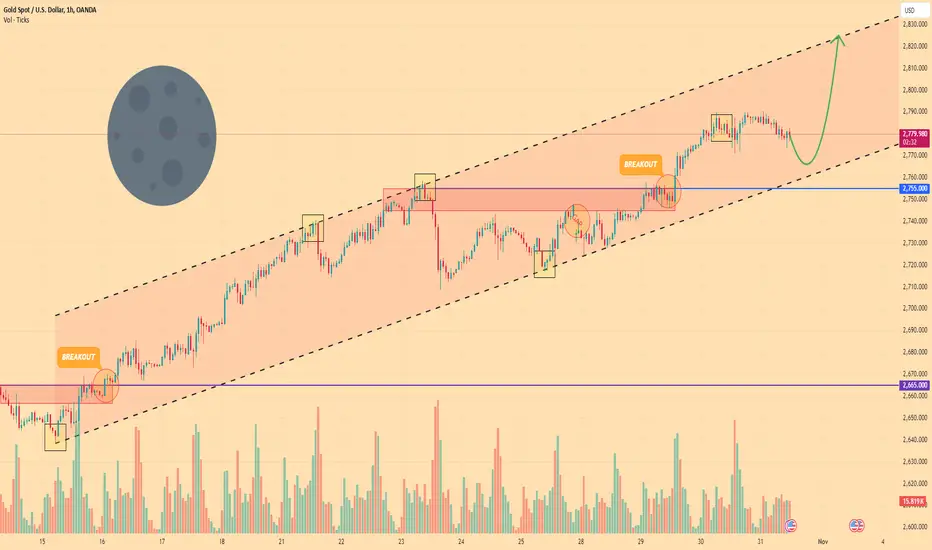
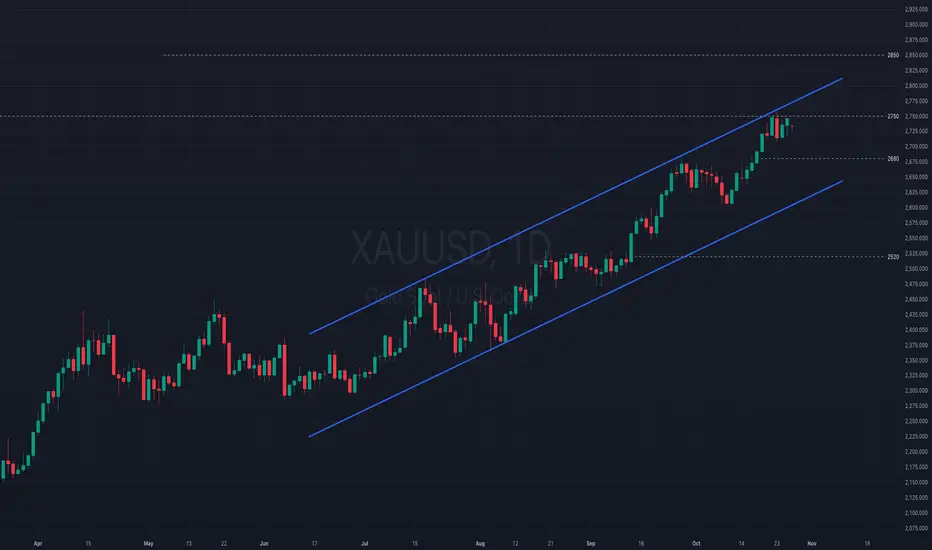
GOLD - Price can little correct and then bounce up to $2825Hi guys, this is my overview for XAUUSD, feel free to check it and write your feedback in comments👊
Not long ago, price bounced from $2665 support level and fell below it, after which it started to grow inside rising channel.
In channel, Gold broke $2665 level one more time and later rose to resistance line of channel, after which made little move down.
Then Gold rose to $2755 level, after which bounced down to support line of channel and then continued to grow.
Later price made a gap, after which fell back to support line and then bounced up, breaking $2755 level.
Price a little rose, after which it started to decline, so, in my opinion, Gold can little decline.
After this movement, price can turn around one more time and then start to grow to $2825 resistance line of channel.
If this post is useful to you, you can support me with like/boost and advice in comments❤️
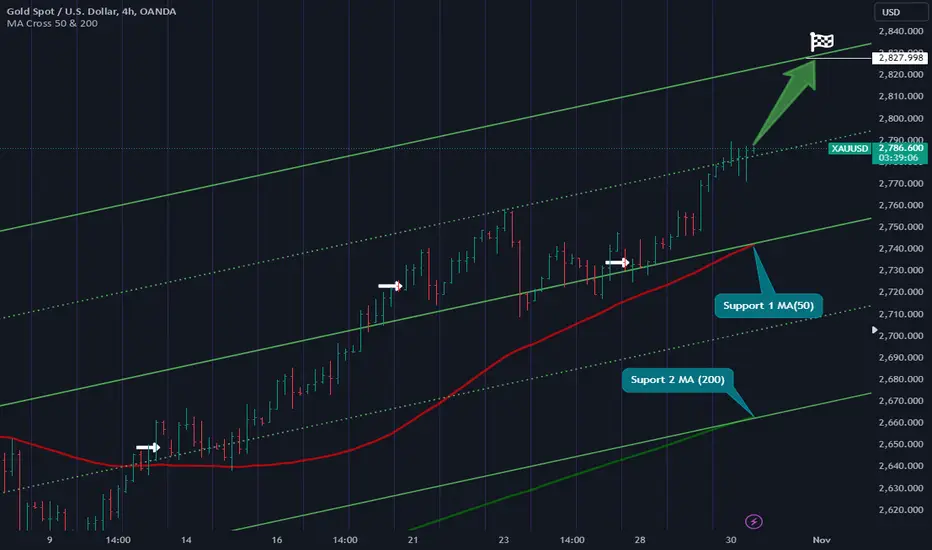
!!! GOLD !!! unstoppable!Hi,
The race continues my friends and the next stop is at the finish line
This is just an idea!
Be careful!
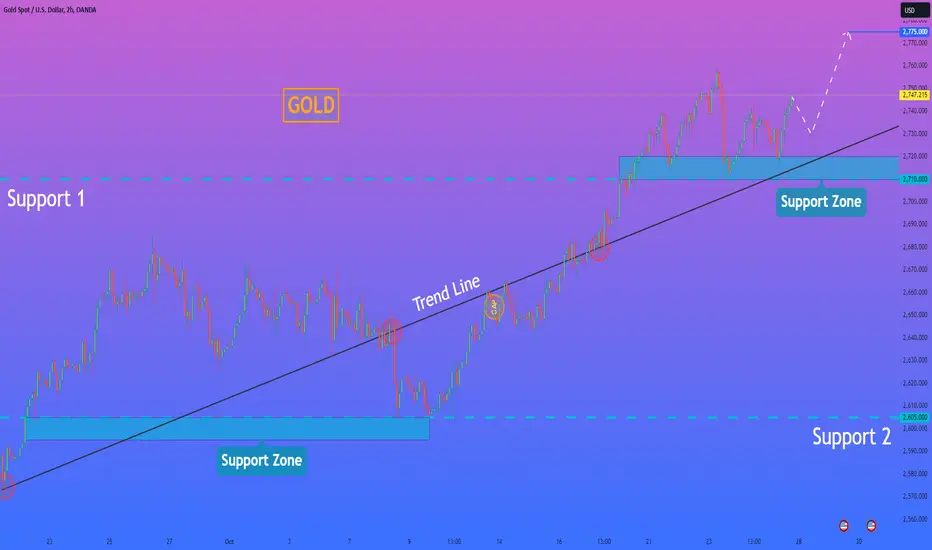
HelenP. I Gold will make small correction and then continue riseHi folks today I'm prepared for you XAUUSD analytics. If we look at the chart we can see how the price some days ago rebounded from the trend line and rose to support 2, which coincided with the support zone. Then the price broke this level and then continued to move up, until it reached 2680 points, after which it turned around and made a correction movement to the trend line. When Gold reached this line, the price broke it and dropped to support 2, but soon turned around and in a short time rose to the trend line and even made a gap. Then price some time traded near the trend line and later broke it. After which Gold reached support 1, which coincided with one more support zone, broke it, and rose even higher in this area. But sometimes, the price fell to the support zone, and now it rising. For this case, I expect that XAUUSD will make small correction and then continue to move up, therefore I set my goal at 2775 points. If you like my analytics you may support me with your like/comment ❤️
HelenP. I Gold can grow a little and then rebound downHi folks today I'm prepared for you Gold analytics. In the chart we can see how the price declined to trend line and then started to grow inside pennant. In this pattern, price some time rising near trend line and later rebounded to the support zone, which coincided with the support 2. Then price made correction, after which continued to move up and soon broke the support 2, after which rose until to resistance line of the pennant. Then Gold turned around and started to decline and quickly fell to the support 2, which coincided with the trend line and then rebounded. Price made a gap and then exited from the pennant, after which continued to move up to the support 1, which coincided with one more support zone. Soon, Gold broke this level, rose a little and made retest, after a breakout. After this movement, price rebounded and continued to move up, and now trades close 2790 points. So, in my mind, XAUUSD will reach 2795 and then start to decline to 2715 support level, which I set my goal. If you like my analytics you may support me with your like/comment ❤️

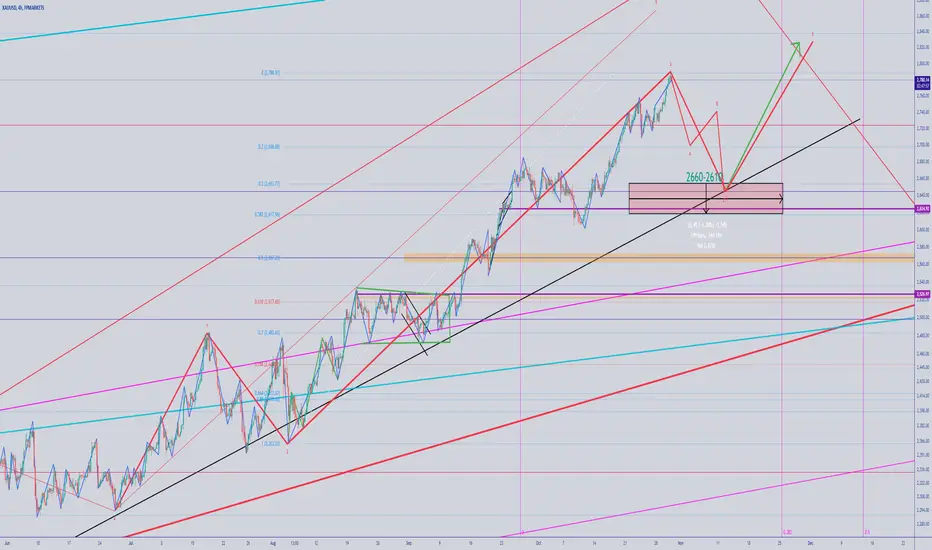
GOLD 4hAccording to Elliot's wave counting conditions, we are probably currently waiting for the formation of wave 4 out of 5 out of 3 out of 5. The correction of this wave can continue until the range of 2660-2610 and after that the price will rise to create a new ceiling.
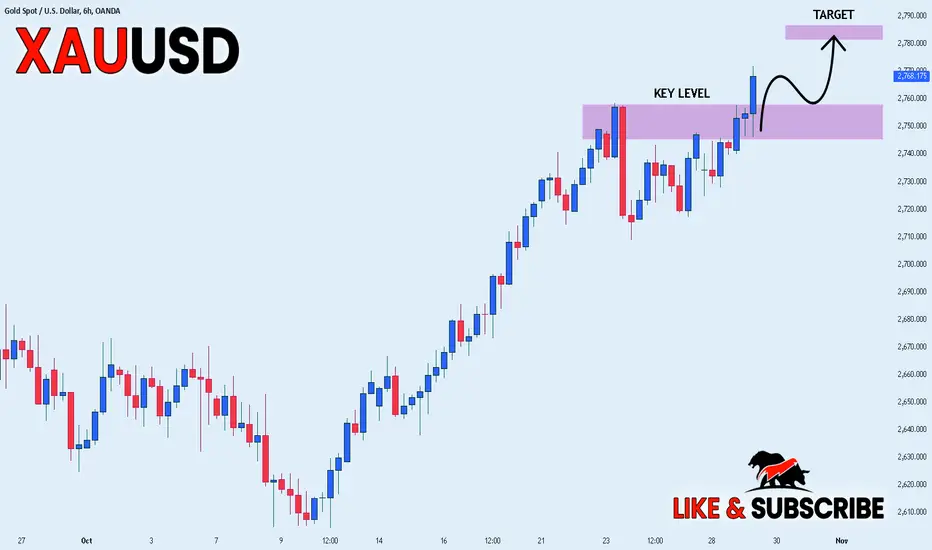
GOLD BULLISH BREAKOUT|LONG|
✅GOLD keeps growing and
The price just broke the
Key horizontal level of 2758$
So we are bullish biased and
We will be expecting a
Further move up
LONG🚀
✅Like and subscribe to never miss a new idea!✅
XAU/USD: Final NFP before Election Americans continue to rank the economy as their top issue, and the final Non-Farm Payrolls (NFP) report before voting day, offers a crucial signal this coming Friday.
September saw a gain of 254,000 jobs, but forecasts point to a marked slowdown, with expectations hovering just above the 100,000 mark. The expected downturn stems from several factors, including back-to-back hurricanes disrupting the Southeast of the country.
For now, gold is trading below Friday’s close (but for how much longer?) as markets react to limited Israeli action against Iran. Tehran has indicated it won’t retaliate, easing geopolitical tension and potentially reducing demand for the haven asset.
Gold continues to show impressive resilience near recent highs
As the threat of a resurgence in inflation with the reckless fiscal policies that are likely to follow the presidential election loom, gold is firmly holding its ground around its historical high. Geopolitical tensions in the Middle East, coupled with soaring demand in China and India, are driving up gold prices. Furthermore, the uncertainty surrounding the US presidential election is boosting demand for gold as a safe haven. UBS has reported that global central banks has acquired 483 tons of gold in 1H2024 and forecasted that gold prices could soar to 3,000 USD per troy ounce next year.
XAUUSD sustained strength throughout the week within the 2720-2750 range. The price maintains a solid uptrend within the ascending channel, while EMA21 shows bullish momentum, widening the gap with EMA78. If XAUUSD breaches the resistance at 2750 and the ascending channel's upper bound, the price could gain upward momentum toward a new high of 2850. Conversely, if XAUUSD breaks the support at 2680, coinciding with EMA21, the price may fall below the channel's lower bound and decline further to the support at 2520.
XAUUSD 27/10/24Continuing from last week's analysis on gold, we are again anticipating higher prices as we enter this trading week. We don’t expect the trend to change unless there's a clear reason, such as breaking below key lows and staying bearish for an extended period, which could signal the start of potential sell-offs. However, for now, we're not considering this scenario. We have three key reference points: the primary target is another all-time high this week. Watch for price to dip below lows that hold liquidity, and then aim for the target at the all-time high. Follow the upward trend of large bank orders and look for a good entry if we see a pullback.
Trade safely and stick to your risk management.
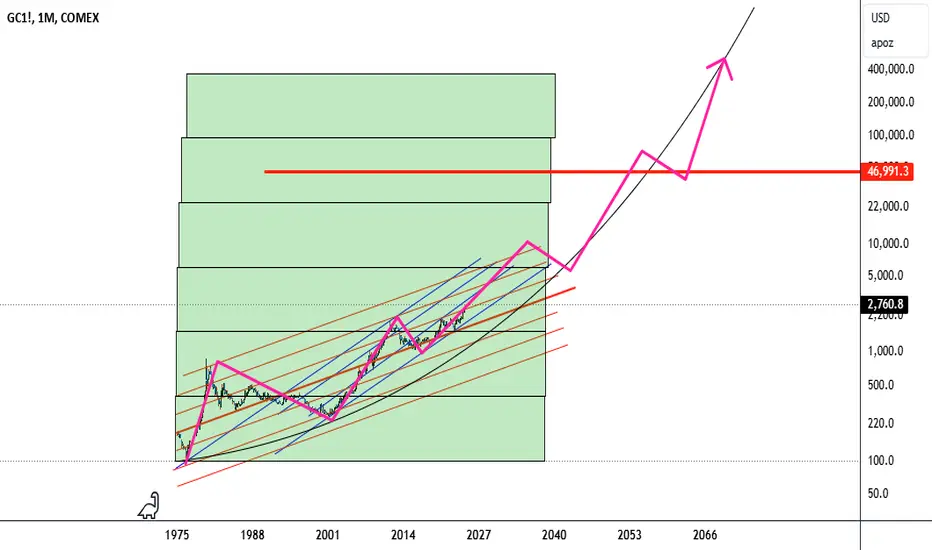
Gold supercycle will take it to near half a million bucksGold is currently on its 3rd rise of secular parabolic run.
Not expecting any meaningful sideways consolidation until a few years from now...
Gold Price Hits New All-Time High Near $2,757 - Have a Look NextGold has once again proven its status as the ultimate safe-haven asset, recently reaching an all-time high just shy of the $2,757 mark. This surge comes amid rising geopolitical tensions and increasing expectations for further rate cuts by the US Federal Reserve. Despite a rise in US Treasury yields, the yellow metal's upward momentum remains strong as investors flock to it during times of uncertainty, highlighting its enduring appeal as a store of value.
Factors Behind Gold’s Historic Surge
1. Geopolitical Tensions
Global geopolitical risks have escalated recently, leading to a rush toward safe-haven assets like gold. Heightened conflicts in the Middle East and lingering tensions in Eastern Europe have fueled fears of broader market instability. Gold, historically seen as a hedge against geopolitical uncertainty, has been one of the primary beneficiaries as investors seek to protect their portfolios.
2. Expectations of Further Fed Rate Cuts
Market sentiment is increasingly tilting toward additional rate cuts by the Federal Reserve. The anticipation of lower interest rates typically supports gold prices, as lower rates reduce the opportunity cost of holding non-yielding assets like gold. With economic data pointing to slower growth and possible deflationary pressures, the Fed may be inclined to continue its dovish stance, further boosting gold’s appeal.
3. US Treasury Yields and Safe-Haven Demand
Even as US Treasury yields have risen, signaling expectations of a stronger US economy, gold's ascent has not been hindered. This decoupling suggests that other factors, like risk aversion and safe-haven demand, are currently driving the metal’s price. Growing fears of a potential Trump presidency in 2024 have added an extra layer of uncertainty, prompting investors to seek the stability that gold provides.
Technical Analysis: Is a Retracement on the Horizon?
From a technical standpoint, the recent surge in gold prices suggests that the metal may be poised for a near-term pullback. Here’s why:
Commitment of Traders (COT) Report Analysis:
According to the latest COT report, retail traders remain heavily bullish on gold, a potential contrarian indicator that often precedes a short-term price reversal. Meanwhile, the so-called "smart money" appears to be scaling back on long positions, suggesting a potential shift in sentiment.
Seasonal Forecast:
Seasonality patterns indicate that gold might be approaching a reversal phase. Historically, gold has shown a tendency to retrace after significant rallies, especially when retail sentiment becomes overly bullish. This seasonal forecast aligns with technical signals that suggest a possible correction.
Potential Retracement Levels:
If gold begins to retrace from current levels, key support zones to watch would include $2,700 and $2,650, where previous resistance levels could now act as support. Traders should keep a tight stop-loss to protect against potential downside risks, especially given the ongoing volatility in global markets.
Trading Strategy: Cautious Optimism with a Tight Stop-Loss
While the long-term outlook for gold remains bullish due to ongoing geopolitical uncertainties and monetary easing expectations, short-term traders should exercise caution. With the potential for a near-term pullback, the ideal strategy may involve waiting for a retracement to key support levels before considering new long positions.
Risk Management: Given the current elevated price levels, it’s crucial to maintain a tight stop-loss to manage potential downside risk.
Potential Reentry: If a retracement occurs, investors could look for signs of stabilization around the $2,650–$2,700 range before reentering the market.
Final Thoughts: A Bullish Long-Term Outlook with Short-Term Caution
Gold’s recent surge to near $2,750 highlights its role as a global safe haven amidst uncertainty. However, with retail sentiment leaning heavily bullish and the possibility of a technical correction looming, traders should remain cautious in the short term.
Despite the potential for a pullback, gold’s long-term fundamentals remain intact, driven by geopolitical risks, monetary policy expectations, and overall global economic uncertainty. As always, a balanced approach, considering both the fundamental and technical factors, will be essential to navigating the evolving landscape of gold trading.
✅ Please share your thoughts about GOLD in the comments section below and HIT LIKE if you appreciate my analysis. Don't forget to FOLLOW ME; you will help us a lot with this small contribution.

The real value of gold is not this!!Gold is currently in a descending wedge and has completed its five upward waves, all indicating a bearish price trend. What further confirms this bearish outlook is the bearish divergence in the MACD. If the signal is followed, we will see a price drop. but Do current tensions in the Middle East allow for it ?
✨We spend hours finding potential opportunities and writing useful ideas, we would be happy if you support us.
Best regards CobraVanguard .💚
_ _ _ _ __ _ _ _ _ _ _ _ _ _ _ _ _ _ _ _ _ _ _ _ _ _ _ _ _ _ _ _
✅Thank you, and for more ideas, hit ❤️Like❤️ and 🌟Follow🌟!
⚠️Things can change...
The markets are always changing and even with all these signals, the market changes tend to be strong and fast!!
