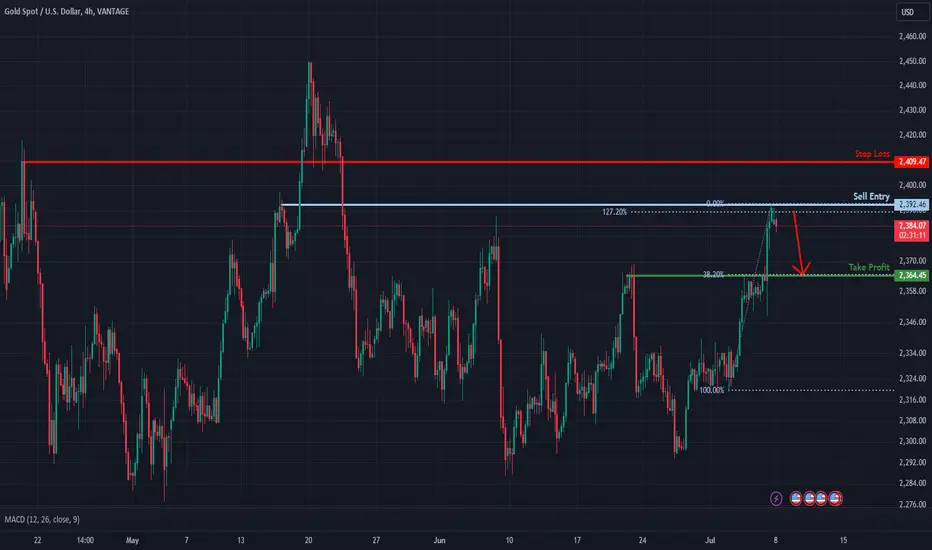
Could Gold reverse from here?The price has reacted off the resistance level which is a pullback resistance that aligns with the 127.2% Fibonacci extension and could potentially drop from this level to our take profit.
Entry: 2,392.46
Why we like it:
There is a pullback resistance that aligns with the 127.2% Fibonacci extension.
Stop loss: 2,409.47
Why we like it:
There is an overlap resistance level.
Take profit: 2,364.45
Why we like it:
There is a pullback support level which aligns with the 38.2% Fibonacci retracement.
Please be advised that the information presented on TradingView is provided to Vantage (‘Vantage Global Limited’, ‘we’) by a third-party provider (‘Everest Fortune Group’). Please be reminded that you are solely responsible for the trading decisions on your account. There is a very high degree of risk involved in trading. Any information and/or content is intended entirely for research, educational and informational purposes only and does not constitute investment or consultation advice or investment strategy. The information is not tailored to the investment needs of any specific person and therefore does not involve a consideration of any of the investment objectives, financial situation or needs of any viewer that may receive it. Kindly also note that past performance is not a reliable indicator of future results. Actual results may differ materially from those anticipated in forward-looking or past performance statements. We assume no liability as to the accuracy or completeness of any of the information and/or content provided herein and the Company cannot be held responsible for any omission, mistake nor for any loss or damage including without limitation to any loss of profit which may arise from reliance on any information supplied by Everest Fortune Group.
J-XAU
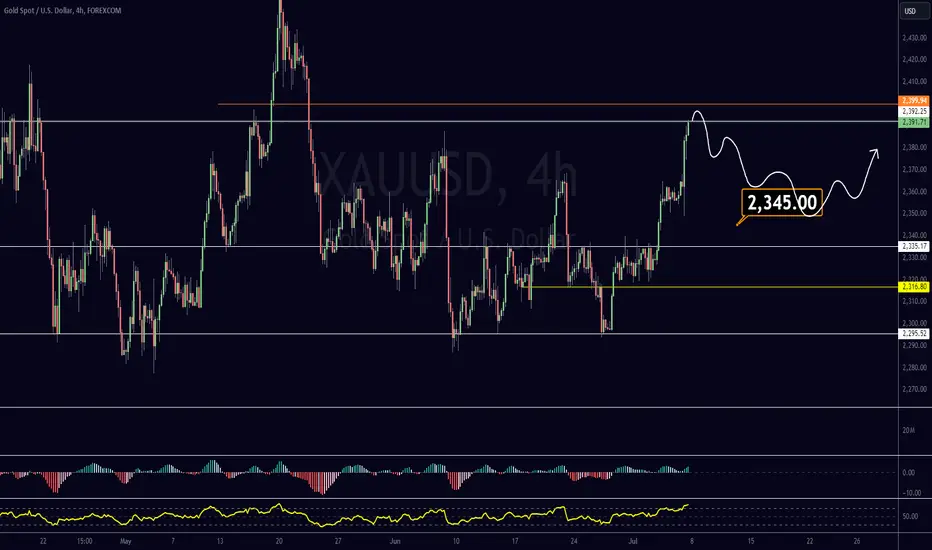
XAUUSD - Gold DailySimple Trading - "W" Pattern
Gold has made its way back to 2390.
Gold will be looking to retest 2350-2360 to confirm new support. If gold manages to stay above this price, look to buy gold top 2415. (this should be the daily "W" pattern target)
*These are just my thoughts, not financial advice.

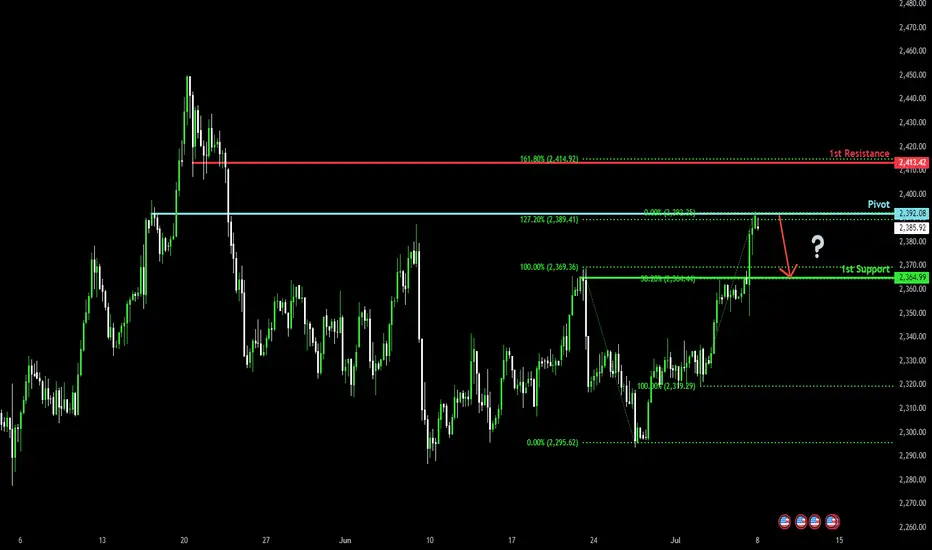
Could Gold fall from here?The price is currently reacting off the pivot and could drop to the pullback support.
Pivot: 2,392.08
1st Support: 2,364.99
1st Resistance: 2,413.42
Risk Warning:
Trading Forex and CFDs carries a high level of risk to your capital and you should only trade with money you can afford to lose. Trading Forex and CFDs may not be suitable for all investors, so please ensure that you fully understand the risks involved and seek independent advice if necessary.
Disclaimer:
The above opinions given constitute general market commentary, and do not constitute the opinion or advice of IC Markets or any form of personal or investment advice.
Any opinions, news, research, analyses, prices, other information, or links to third-party sites contained on this website are provided on an "as-is" basis, are intended only to be informative, is not an advice nor a recommendation, nor research, or a record of our trading prices, or an offer of, or solicitation for a transaction in any financial instrument and thus should not be treated as such. The information provided does not involve any specific investment objectives, financial situation and needs of any specific person who may receive it. Please be aware, that past performance is not a reliable indicator of future performance and/or results. Past Performance or Forward-looking scenarios based upon the reasonable beliefs of the third-party provider are not a guarantee of future performance. Actual results may differ materially from those anticipated in forward-looking or past performance statements. IC Markets makes no representation or warranty and assumes no liability as to the accuracy or completeness of the information provided, nor any loss arising from any investment based on a recommendation, forecast or any information supplied by any third-party.
XAU gold ... LOOKING like it wants to pull backat resistance ... LOOKING like it wants to pull back
white arrow with thought process of where the price action may go
not financial advise
entertainment only
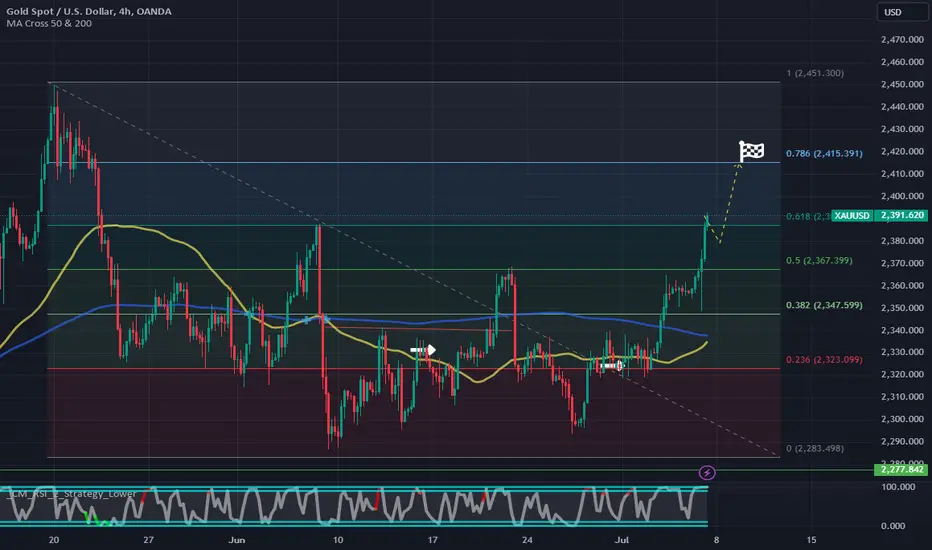
!!! GOLD !!! - The Fibonacci told me... next stop 2.415.Hi,
We have a positive scenario for gold at the moment.
This is just an idea,
Be careful!

Gold can break support level and fall to support line of channelHello traders, I want share with you my opinion about Gold. By observing the chart, we can see that the price made impulse down from the resistance line of the pennant lower than the current support level, which coincided with the support area, thereby breaking it. After this, the price some time traded and then rose back to the support area, where it reached the resistance line of the pennant and then rebounded down to the support line, breaking the 2310 level, but soon Gold rose higher this level, breaking it one more time. Then it in a short time rose to the resistance line of the pennant, turned around, and fell to the support line, after which the price exited from the pennant pattern and declined to lower the 2310 level again. But then Gold started to grow inside the upward channel, making a fake breakout of the support level, which coincided with the buyer zone and later it rose to the current support level. A not long time ago, XAU broke this level and now it trades very close to the 2390 level, near the resistance line of the channel. For this case, I think that the price can make a small correction movement, and then reach the resistance line, after which starts to decline to the support line of the channel, breaking the support level. So, that's why I set my TP at 2360 points, which coincided with the support line of the channel. Please share this idea with your friends and click Boost 🚀

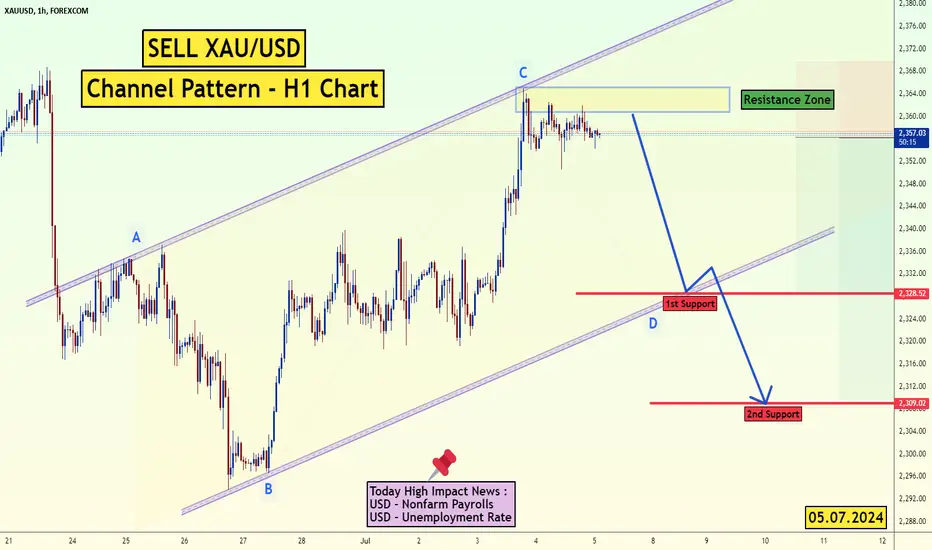
XAU/USD H1 Channel Formation The XAU/USD pair on the H1 timeframe presents a potential selling opportunity due to a recent formation of well-defined Channel pattern. This suggests a shift in momentum towards the downside in the coming Hours. OANDA:XAUUSD
Key Points:
Sell Entry: Consider entering a short position around the current price of 2357, positioned close to the breakout level. This offers an entry point near the perceived shift in momentum.
Target Levels:
1st Support – 2328
2nd Support – 2309
Stop-Loss: To manage risk, place a stop-loss order above 2370. This helps limit potential losses if the price unexpectedly reverses and breaks back upwards.
Thank you.
GOLD - Price can bounce from resistance area and continue riseHi guys, this is my overview for XAUUSD, feel free to check it and write your feedback in comments👊
Recently price declined to support level, which coincided with support area, and at once started to grow.
In a short time, Gold reached $2360 level and even entered to resistance area, but soon bounced down.
Also, price entered to pennant, where it declined from resistance line to support line, after which started to rise.
Price broke $2310 level and later exited from pennant, after which in a short time reached $2360 level again.
A not long time ago Gold broke this level and now trades in resistance area, so, I think it can make little correction.
After this, price will turn around and continue to move up to $2395
If this post is useful to you, you can support me with like/boost and advice in comments❤️
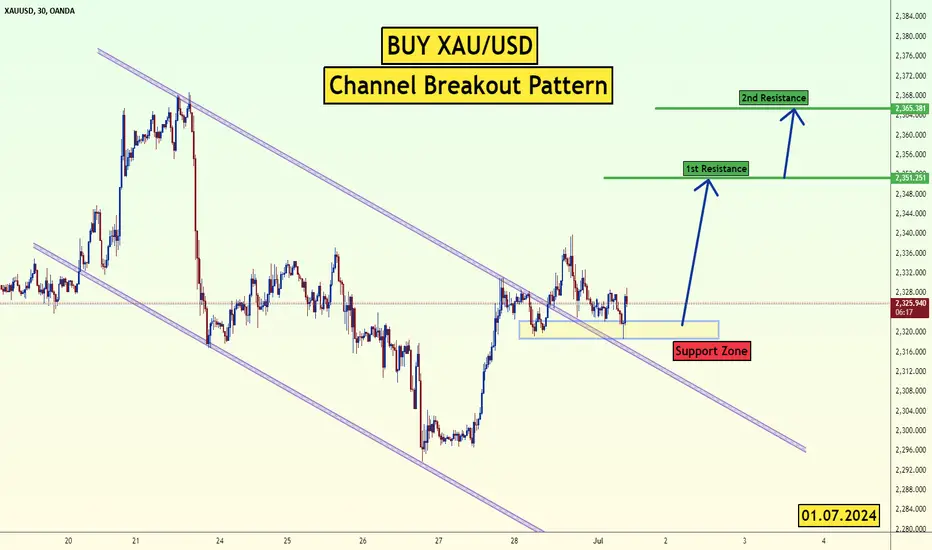
Buy XAUUSD Channel BreakoutThe XAU/USD pair on the M30 timeframe presents a potential Buying opportunity due to a recent downward breakout from a well-defined channel pattern. This suggests a shift in momentum towards the Upside in the coming Hours.
Key Points:
Buy Entry: Consider entering a Long position around the current price of 2326, positioned close to the breakout level. This offers an entry point near the perceived shift in momentum.
Target Levels :
1st Support – 2351
2nd Support – 2365
Stop-Loss: To manage risk, place a stop-loss order below 2316.50 This helps limit potential losses if the price unexpectedly reverses and breaks back upwards.
Thank you.
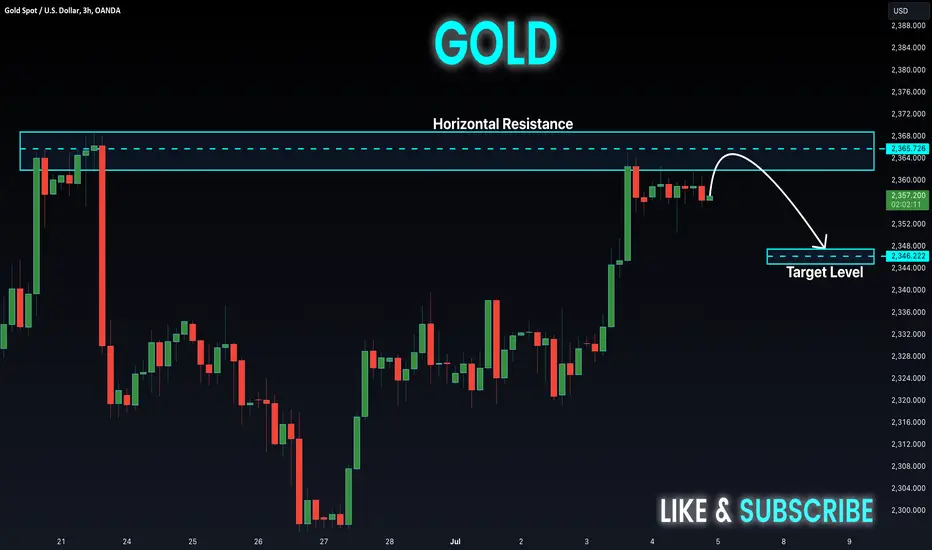
GOLD Risky Short! Sell!
Hello,Traders!
GOLD went up to
Retest the horizontal
Resistance level of 2.3680
And Gold is locally overbought
So we will be expecting
A local bearish correction
Sell!
Like, comment and subscribe to help us grow!
Check out other forecasts below too!
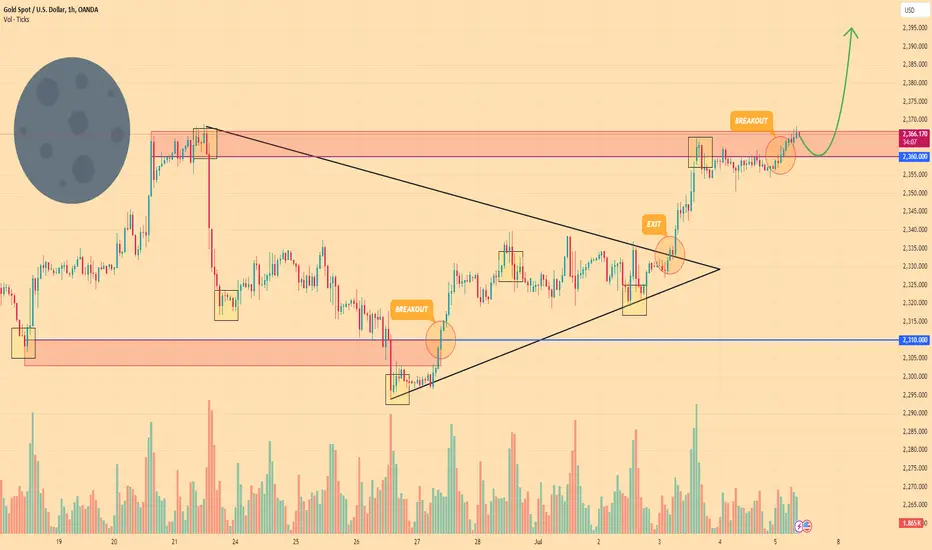
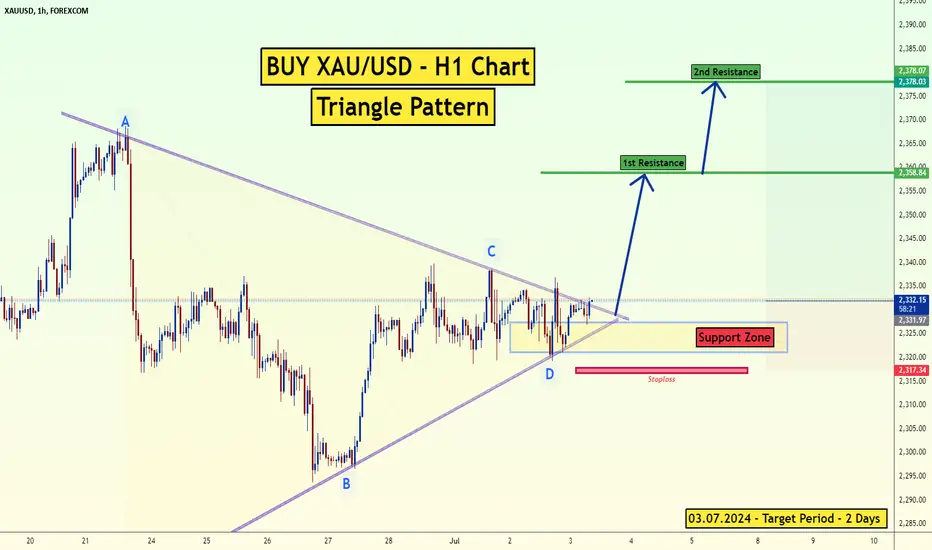
Gold (Xau/Usd) Triangle in H1The XAU/USD pair on the H1 timeframe presents a Potential Buying Opportunity due to a recent breakout from a Triangle Pattern. This suggests a shift in momentum towards the upside and a higher likelihood of further advances in the coming hours.
Possible Long Trade:
Entry: Consider Entering A Long Position Above The Broken Trendline Of The Triangle After Confirmation. Ideally, This Would Be Around 2331
Target Levels:
1st Resistance – 2358
2nd Resistance – 2378
Stop-Loss: To manage risk, place a stop-loss order below 2317.50. This helps limit potential losses if the price falls back unexpectedly.
Thank you
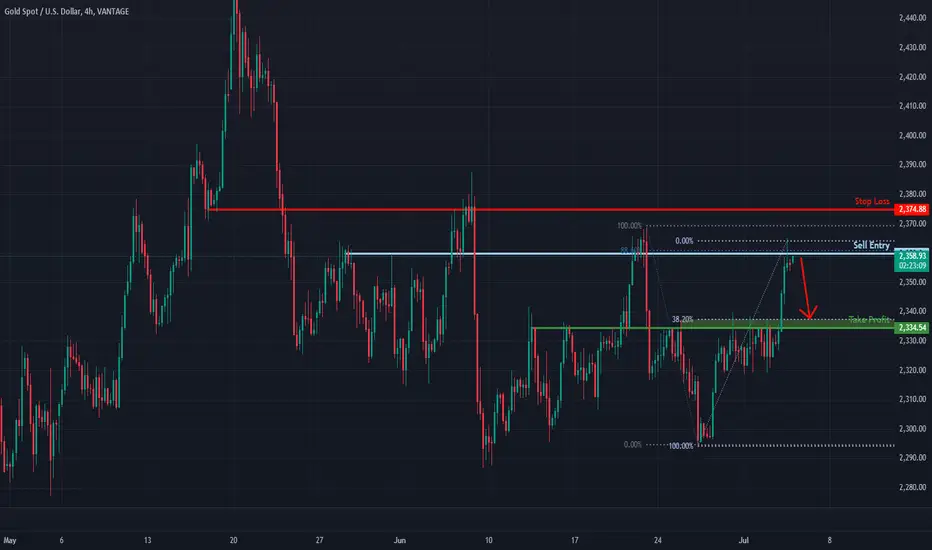
Bearish reversal?XAU/USD is rising towards a resistance level which is an overlap resistance which aligns with the 88% Fibonacci retracement and could reverse from this level to our take profit.
Entry: 2,359.84
Why we like it:
There is an overlap resistance level which aligns with the 88% Fibonacci retracement.
Stop loss: 2,374.88
Why we like it:
There is an overlap resistance level.
Take profit: 2,334.54
Why we like it:
There is an overlap support level which aligns with the 38.2% Fibonacci retracement.
Please be advised that the information presented on TradingView is provided to Vantage (‘Vantage Global Limited’, ‘we’) by a third-party provider (‘Everest Fortune Group’). Please be reminded that you are solely responsible for the trading decisions on your account. There is a very high degree of risk involved in trading. Any information and/or content is intended entirely for research, educational and informational purposes only and does not constitute investment or consultation advice or investment strategy. The information is not tailored to the investment needs of any specific person and therefore does not involve a consideration of any of the investment objectives, financial situation or needs of any viewer that may receive it. Kindly also note that past performance is not a reliable indicator of future results. Actual results may differ materially from those anticipated in forward-looking or past performance statements. We assume no liability as to the accuracy or completeness of any of the information and/or content provided herein and the Company cannot be held responsible for any omission, mistake nor for any loss or damage including without limitation to any loss of profit which may arise from reliance on any information supplied by Everest Fortune Group.
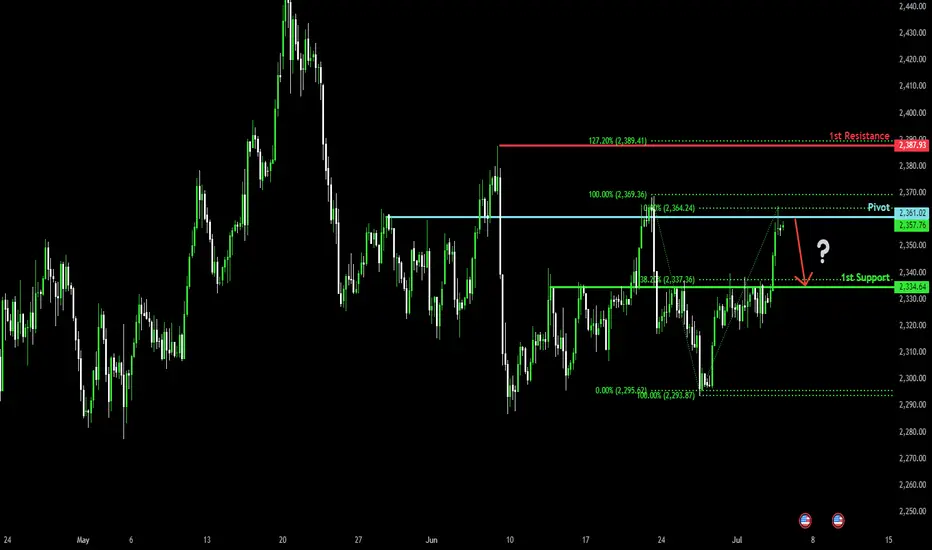
Bearish drop?The Gold (XAU/USD) is rising towards the pivot which is an overlap resistance and could reverse to the overlap support.
Pivot: 2,361.02
1st Support: 2,334.64
1st Resistance: 2,387.93
Risk Warning:
Trading Forex and CFDs carries a high level of risk to your capital and you should only trade with money you can afford to lose. Trading Forex and CFDs may not be suitable for all investors, so please ensure that you fully understand the risks involved and seek independent advice if necessary.
Disclaimer:
The above opinions given constitute general market commentary, and do not constitute the opinion or advice of IC Markets or any form of personal or investment advice.
Any opinions, news, research, analyses, prices, other information, or links to third-party sites contained on this website are provided on an "as-is" basis, are intended only to be informative, is not an advice nor a recommendation, nor research, or a record of our trading prices, or an offer of, or solicitation for a transaction in any financial instrument and thus should not be treated as such. The information provided does not involve any specific investment objectives, financial situation and needs of any specific person who may receive it. Please be aware, that past performance is not a reliable indicator of future performance and/or results. Past Performance or Forward-looking scenarios based upon the reasonable beliefs of the third-party provider are not a guarantee of future performance. Actual results may differ materially from those anticipated in forward-looking or past performance statements. IC Markets makes no representation or warranty and assumes no liability as to the accuracy or completeness of the information provided, nor any loss arising from any investment based on a recommendation, forecast or any information supplied by any third-party.
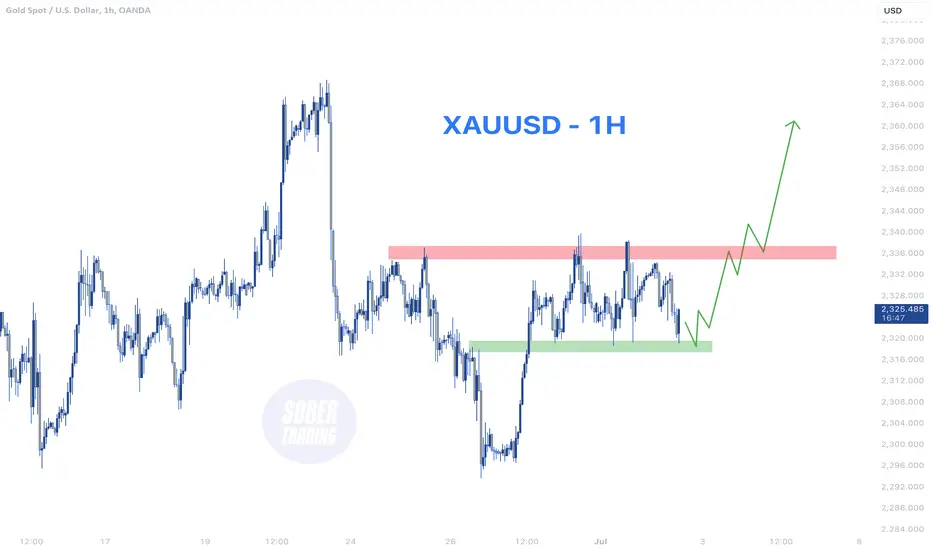
XAUUSD - 1H Bullish momentumThe XAUUSD (Gold) chart analysis shows that Gold couldn’t consolidate below the $2300 mark after multiple attempts.
Now, it’s consolidating above the $2320 zone, indicating strong support. Given this consolidation over the support zone, there’s potential for Gold to rise and break through the resistance zones.
If the bullish momentum continues, we could see Gold targeting higher resistance levels, suggesting a favorable environment for buyers in the short term. Keep an eye on the resistance zones for potential breakouts.
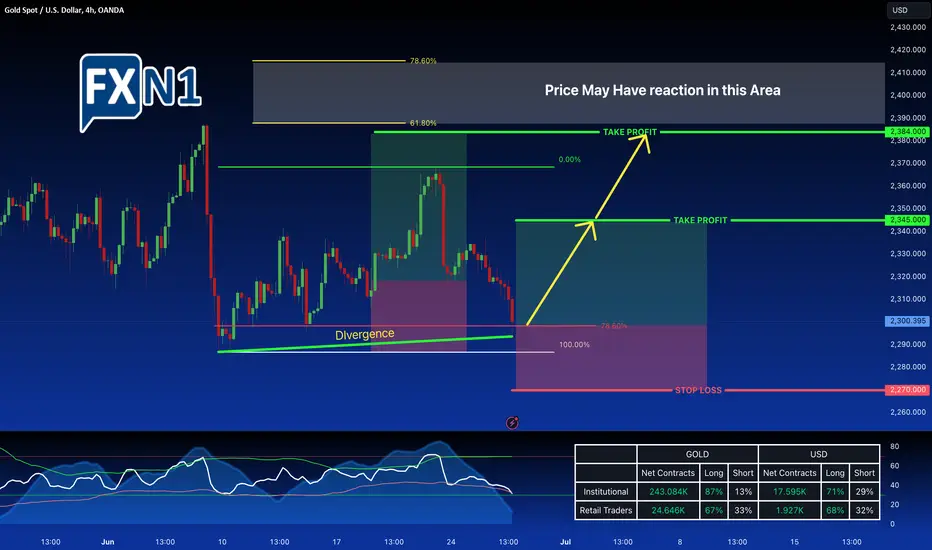
GOLD Hits $2,300 Support Zone as Fed Officials Maintain Hawkish 🟡 Gold pushed lower to around $2,300 on Wednesday as investors weighed comments from Federal Reserve (Fed) officials, who remain hesitant to cut interest rates amid persistently high inflation. This reluctance by the Fed to reduce rates has exerted downward pressure on gold prices.
However, the Commitment of Traders (COT) report reveals strong institutional interest in gold, indicating a substantial long position. Additionally, the price has reached a significant demand area that aligns with the 78.6% Fibonacci retracement level at the $2,300 support zone. This convergence of factors is further supported by a divergence, suggesting a potential bullish reversal.
Given these conditions, we are considering adding another long position in gold from this point, anticipating a rebound from the current support level.
XAUUSD H1 - Long SignalWe continue to see positive performance in XAUUSD. Currently, we are aiming for a break above the $2,338/oz level, compared to approximately $2,335/oz yesterday. I believe this is achievable within the week, with potential targets around $2,360/oz.
Given the recent trading patterns of XAUUSD, we might observe prices fluctuating between $2,322/oz and $2,324/oz, trending upwards to $2,336/oz before breaking higher. This presents an appealing and robust 120-point range that we can capitalize on.
We've been experiencing great success with gold recently. By trading from the identified support level of $2,322/oz and taking long positions, we've captured profitable intraday opportunities. From a swing trading perspective, our target is set at $2,360/oz.

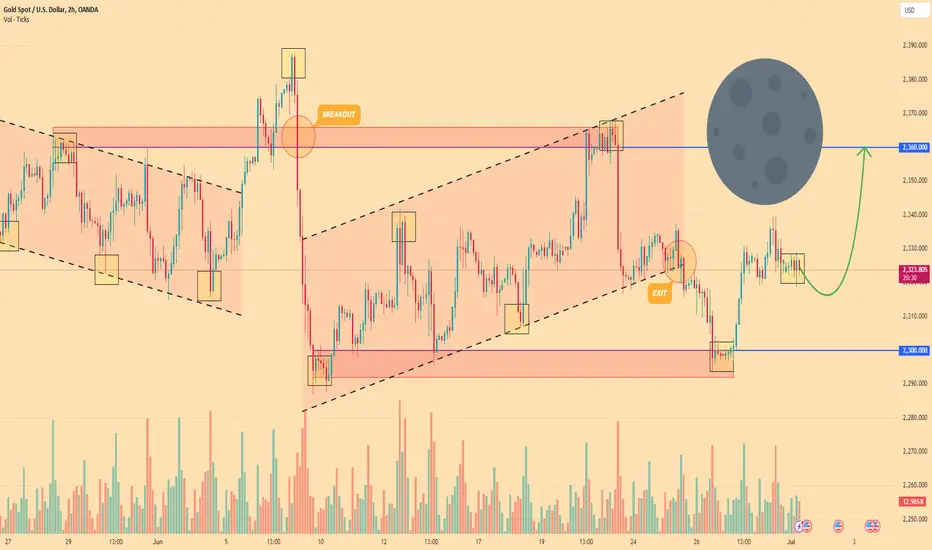
GOLD - Price can make small correction and then continue grow Hi guys, this is my overview for XAUUSD, feel free to check it and write your feedback in comments👊
Some time ago price entered to falling channel, where it at once bounced from support line to resistance line.
After this, price continued to decline in channel, and later it turned around and made upward impulse, exiting from channel.
Also, price rose higher $2360 level, but soon turned around and made strong downward impulse, breaking this level again.
Then price started to grow inside rising channel, where it reached resistance level, after which Gold bounced down.
Gold exited from a rising channel and fell to support level, but a not long time ago it started to grow.
In my mind, price can make a small movement down and then continue to grow to $2360 resistance level.
If this post is useful to you, you can support me with like/boost and advice in comments❤️
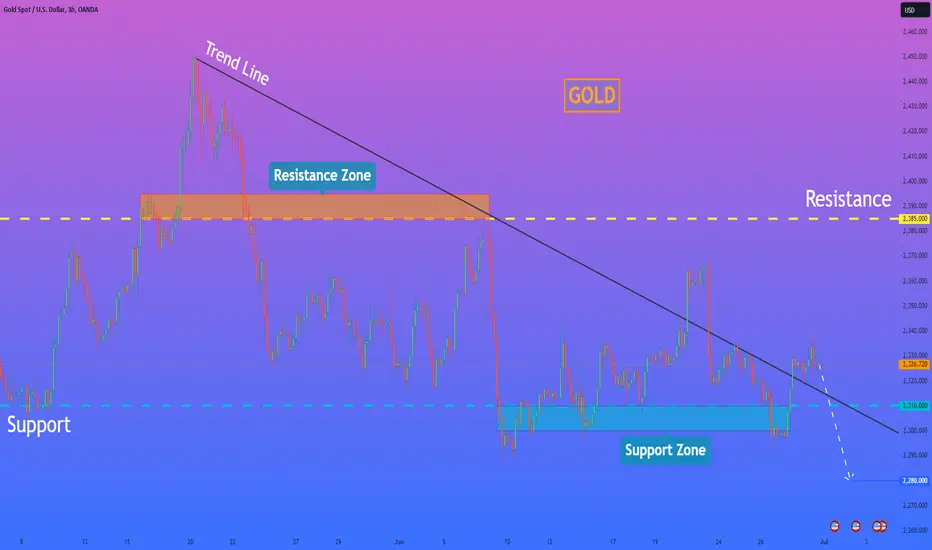
HelenP. I Gold can fall to $2280 points, breaking support levelHi folks today I'm prepared for you Gold analytics. If we look at the chart, we can see how the price some days ago rebounded from the support level and made a strong impulse up to the trend line, thereby breaking the resistance level, which coincided with the resistance zone. After this movement, the price turned around from the trend line and in a short time declined lower than the 2385 level, breaking it one more time. Next, the price declined a little more, and then some time traded near the 2310 support level, after which turned around and in quickly rose to the resistance level. After this movement, the price made an impulse down from the resistance level and fell to the support zone, but soon turned around and rose higher than the support level, making a fake breakout. Later price also broke the trend line, but after this, GOLD rose a little and then made impulse down, breaking this line one more time. Price fell lower support level, but a not long time ago it rebounded from the support zone and rose higher than the 2310 level and trend line as well. Just now, the price trades near the trend line and I expect that XAUUSD will decline to a support level, breaking the trend line. After this, the price can break the support level and continue to fall, therefore I set my goal at 2280 points. If you like my analytics you may support me with your like/comment ❤️
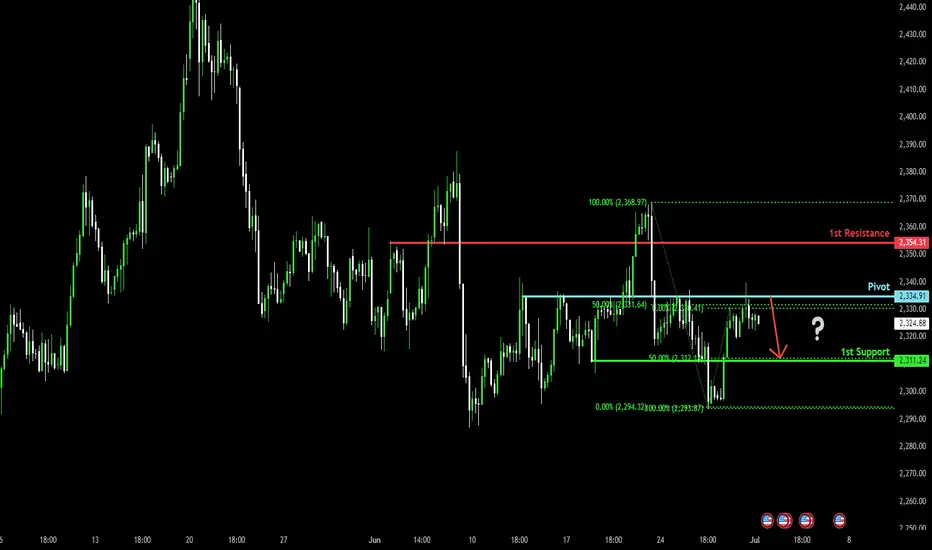
Bearish drop?The Gold (XAUUSD) has reacted off the pivot and could potentially drop to the pullback support.
Pivot: 2,334.9
1st Support: 2,311.2
1st Resistance: 2,354.3
Risk Warning:
Trading Forex and CFDs carries a high level of risk to your capital and you should only trade with money you can afford to lose. Trading Forex and CFDs may not be suitable for all investors, so please ensure that you fully understand the risks involved and seek independent advice if necessary.
Disclaimer:
The above opinions given constitute general market commentary, and do not constitute the opinion or advice of IC Markets or any form of personal or investment advice.
Any opinions, news, research, analyses, prices, other information, or links to third-party sites contained on this website are provided on an "as-is" basis, are intended only to be informative, is not an advice nor a recommendation, nor research, or a record of our trading prices, or an offer of, or solicitation for a transaction in any financial instrument and thus should not be treated as such. The information provided does not involve any specific investment objectives, financial situation and needs of any specific person who may receive it. Please be aware, that past performance is not a reliable indicator of future performance and/or results. Past Performance or Forward-looking scenarios based upon the reasonable beliefs of the third-party provider are not a guarantee of future performance. Actual results may differ materially from those anticipated in forward-looking or past performance statements. IC Markets makes no representation or warranty and assumes no liability as to the accuracy or completeness of the information provided, nor any loss arising from any investment based on a recommendation, forecast or any information supplied by any third-party.
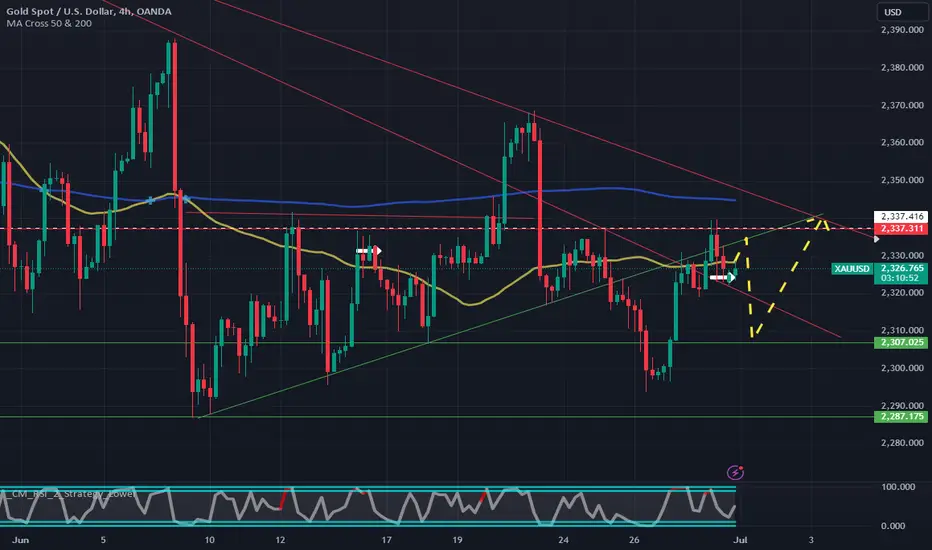
!!! GOLD !!! - Calls for Monday and Tuesday.Hello,
I believe that the best option is to start selling on the white dotted line, and then buy on Tuesday.
Take care!
This is just an idea.
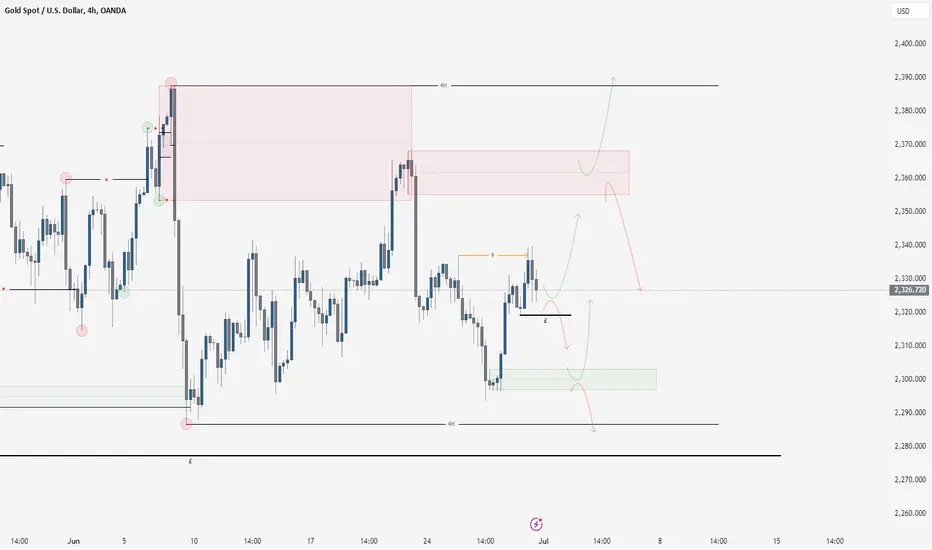
XAUUSD 30/6/24The gold chart here shows a similar outlook to what we had last week. We played off the area of supply we marked, selling off nicely into the lower end of the range. After taking the liquidity across the lows, we saw a strong pullback with a large area of imbalance created, indicating upward momentum. However, it's important to remember that the overall ranges are bearish, and we expect the price action to move lower.
Our preferred option is for the price to run higher to the area of supply before selling off, sweeping the low marks below and heading to the demand zone marked in green. At this point, we would look for the price to either go bullish and move into the area of supply or break down through this zone and continue the bearish trend.
If the price breaks the 4-hour high, it would give us a new directional bias. Conversely, if the price breaks lower, it would align with our current bearish bias, so keep an eye on that if we start pushing in one direction or the other.
Trade safe and follow your plan.
Gold can correct to support level and then start to move upHello traders, I want share with you my opinion about Gold. By observing the chart, we can see that the price declined to the support line, thereby breaking the support level, which coincided with the buyer zone, but at once rebounded and started to grow. In a short time price rose higher than the 2310 level, breaking it again, and then rose to the resistance level, which coincided with the seller zone. Soon, GOLD broke this level, made a retest, and rose to 2442 points, after which turned around and started to decline. Price quickly declined lower than the resistance level with the support line, thereby breaking it. After this movement, the price some time traded in range and then reached the resistance level again, but at once rebounded and made impulse down lower than the 2310 level, to support line of the pennant. Next, Gold in a short time rose to the resistance line of the pennant, after which rebounded back to the support line. But a not long time ago it bounced up and now trades near the support level. In my opinion, the price can decline to the support level and then start to grow to the resistance line of the pennant. After this, Gold can break this line, thereby exiting from the pennant, and then continue to grow, therefore I set my TP at 2360 points. Please share this idea with your friends and click Boost 🚀
