Gold hits record as Polymarket flips Fed callFederal Reserve Chair Jerome Powell has warned that President Donald Trump’s tariff policy is likely to fuel higher inflation and slow economic growth.
Speaking at the Economic Club of Chicago on Wednesday, Powell said, “Markets are struggling with a lot of uncertainty, and that means volatility.” His comments were quickly reflected in the markets, with the Dow shedding 1.7%, the S&P 500 falling 2.3%, and the Nasdaq tumbling 3.4%. Meanwhile, gold extended its rally to a new record high of $3,337.
What may not be uncertain is the Fed’s next rate decision. According to Polymarket data, there's now an 89% chance the Federal Reserve will hold rates steady at its May meeting—up from 69% just a month ago.
Polymarket is also pricing the odds of Powell being replaced by Trump with a more servile director this year at 17% (which could likely send the odds of a rate cut in May shooting up).
J-XAU

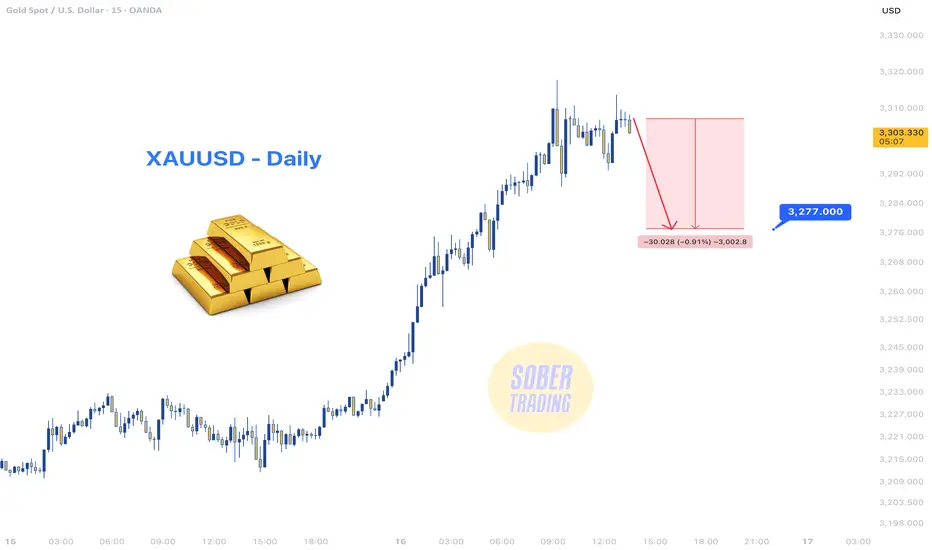
XAUUSD - 15m Sell SetupXAUUSD - Daily Sell Setup 🔻
After a strong and extended rally, Gold (XAUUSD) has reached an overheated level and is now showing signs of short-term exhaustion.
We’re eyeing a $30 correction, which translates to nearly 300 pips of opportunity for short sellers.
📉 Current Price: ~$3,307
🎯 Target: ~$3,277
With momentum slowing and candles printing hesitation, this could be a great time to catch a quick pullback. Ideal for short-term traders who thrive in volatility.
💡 Manage your risk, don’t chase — wait for confirmation before entry.
💸 Ready for 300 pips? Follow us and ride the wave with precision! 🚀
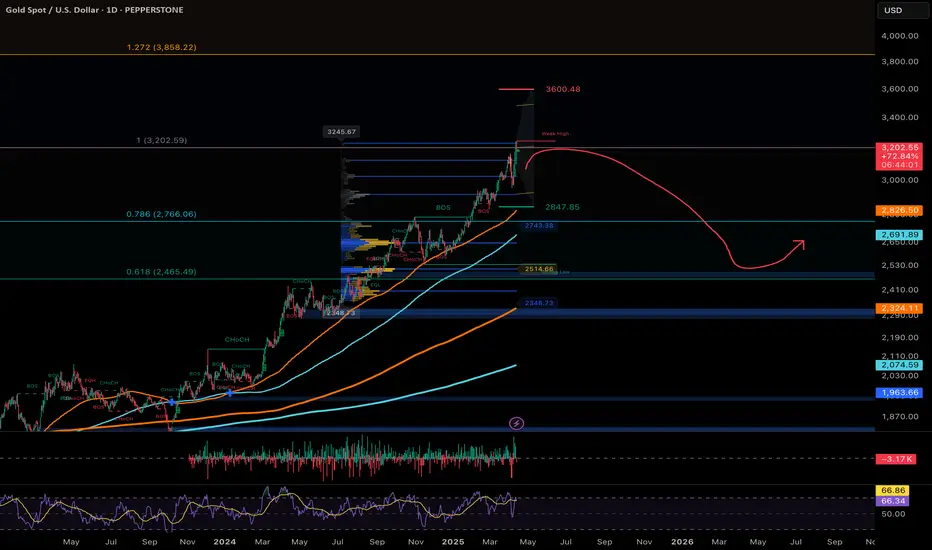
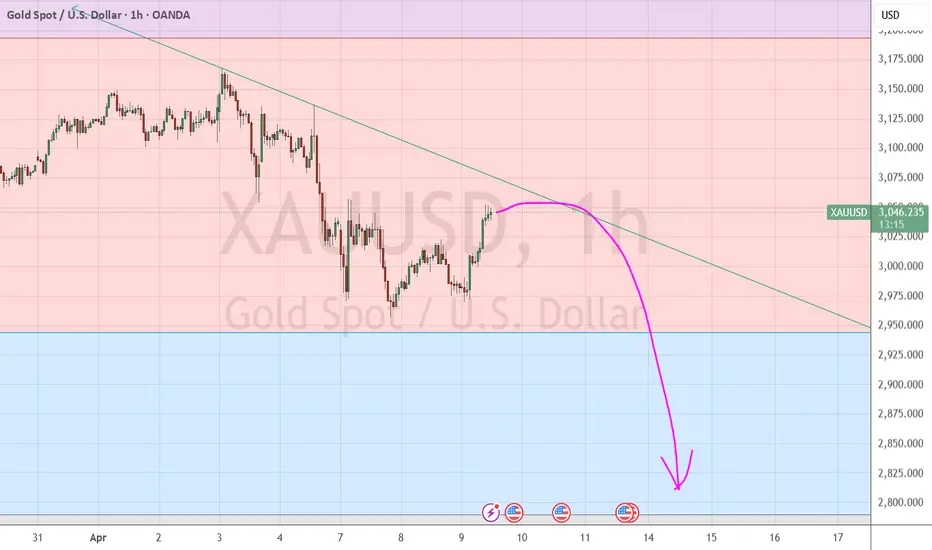
XAUUSD - Possible top formation on gold ?XAUUSD probably topped as I expected around 3200 - 1 fib extension from low 1046 to high 2075 and higher low 1614 (started to short at the precedent low 3157)
big daily bearish divergence on RSI as well
maybe double bottom in 1 or 2 weeks then will go all down till september thats my forecast
daily POC/and back to 0.618 fib extension is my target ~ 2500 (around -20% move)
____
any new ATH could bring gold to next fib extension at around 3850
Cheers
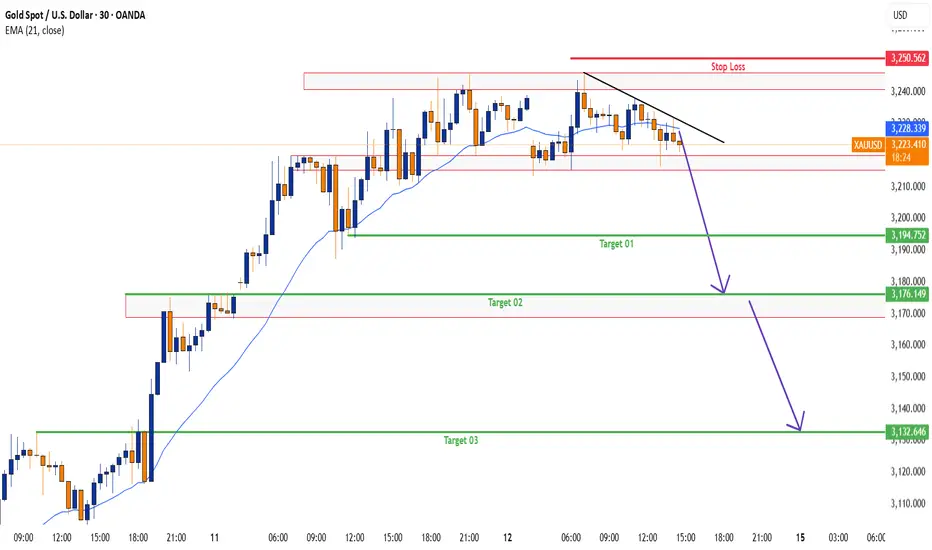
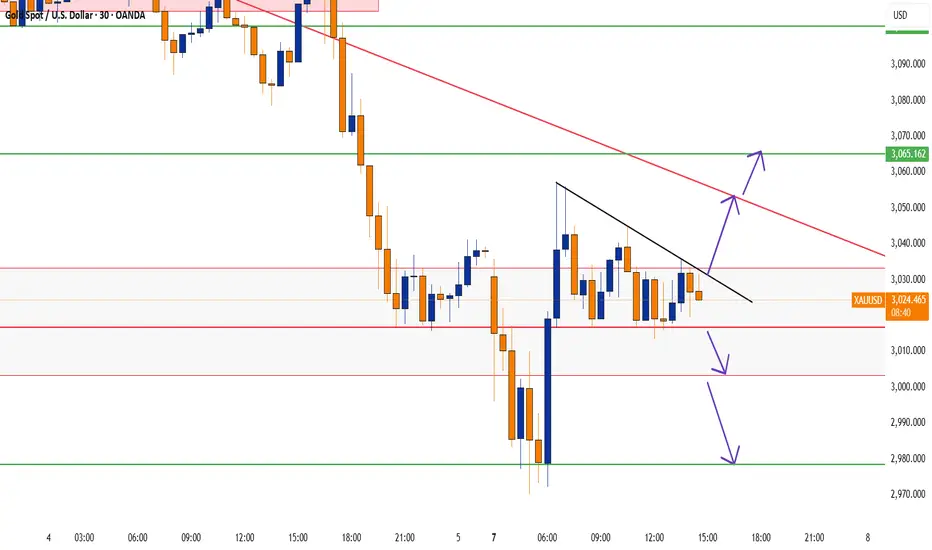
XAUUSD Technical Analysis Update
🔹 Timeframes Observed: H1, M30, and M15
Gold (XAUUSD) has officially broken the trendline on all three lower timeframes — 1 Hour, 30 Minutes, and 15 Minutes — indicating a clear shift in market structure towards the downside.
🔹 Key Support Level:
The next critical confirmation of bearish continuation will occur if price breaks below the $3116 support zone. A clean break and retest of this level can serve as strong validation for further downside movement.
🔹 Target Zones:
If the bearish momentum sustains, price may head towards the following levels:
🎯 Target 1: $3195
🎯 Target 2: $3172
🎯 Target 3: $3132
🔹 Stop Loss:
To manage risk effectively, a recommended stop loss is placed at $3250. This helps protect against unexpected price spikes or false breakouts.
🔹 EMA Confluence:
The 21 EMA on the M30 timeframe has been broken, adding another layer of confirmation to the bearish bias. This EMA break often signals a shift in short- to mid-term trend direction.
⚠️ Important Note on Fundamentals:
While technicals currently show a bearish setup, it's essential to monitor fundamental drivers closely — including economic news releases, central bank statements, tariffs, and geopolitical events — as any significant development can invalidate technical patterns and shift market sentiment instantly.

Gold Trades I'm taking Today 1
So this is how i'll be making my videos from now on, talking about trades i will be taking if triggered, and i update if it was a win or loss.
For this trade, I'm playing with descending triangles and waiting for a break. These patterns are my best but they are more functional on higher-timeframes. This is a 45: meaning it might work or it might not.
I'm learning to just go for it when it comes to gold because i've missed a lot of trades because i hesitated. Let's see how this one plays out..

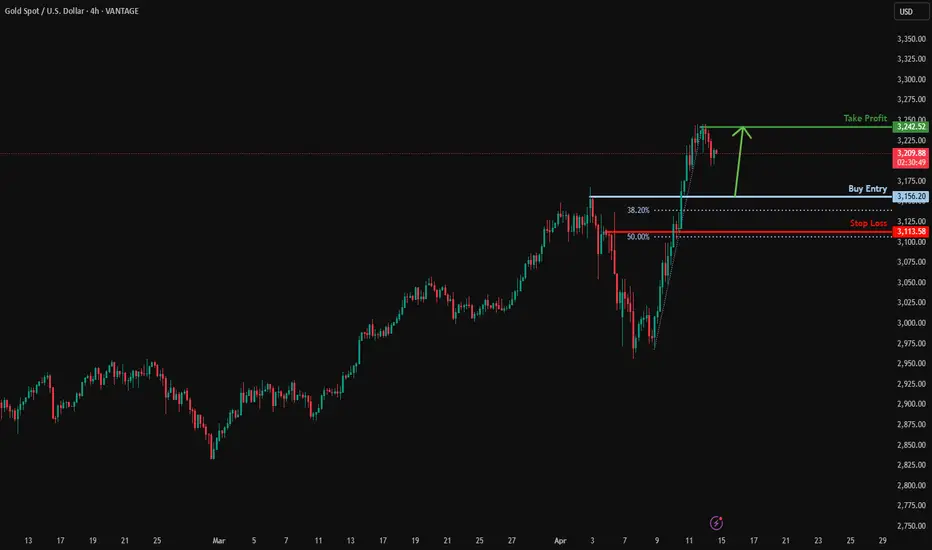
Bullish continuation?XAU/USD is falling towards the support level which is a pullback support that is slightly above the 38.2% Fibonacci retracement and could bounce from this level to our take profit.
Entry: 3,156.20
Why we like it:
There is a pullback support level that is slightly above the 38.2% Fibonacci retracement.
Stop loss: 3,083.60
Why we like it:
There is a pullback support level that aligns with the 50% Fibonacci retracement.
Take profit: 3,242.52
Why we like it:
There is a pullback resistance level.
Enjoying your TradingView experience? Review us!
Please be advised that the information presented on TradingView is provided to Vantage (‘Vantage Global Limited’, ‘we’) by a third-party provider (‘Everest Fortune Group’). Please be reminded that you are solely responsible for the trading decisions on your account. There is a very high degree of risk involved in trading. Any information and/or content is intended entirely for research, educational and informational purposes only and does not constitute investment or consultation advice or investment strategy. The information is not tailored to the investment needs of any specific person and therefore does not involve a consideration of any of the investment objectives, financial situation or needs of any viewer that may receive it. Kindly also note that past performance is not a reliable indicator of future results. Actual results may differ materially from those anticipated in forward-looking or past performance statements. We assume no liability as to the accuracy or completeness of any of the information and/or content provided herein and the Company cannot be held responsible for any omission, mistake nor for any loss or damage including without limitation to any loss of profit which may arise from reliance on any information supplied by Everest Fortune Group.
GOLD All Key Levels! Buy!
Hello,Traders!
GOLD is trading in a MASSIVE
Uptrend and the slope of the
Price increase is getting steeper
And steeper which begs a question
Of how sustainable is this growth
In the future, however we are
Still bullish biased as the turmoil
In the markets makes makes Gold
Particularly attractive as a safe
Haven asset and so the next
Target seems to be a strong
Psychological level of 3300$
Buy!
Comment and subscribe to help us grow!
Check out other forecasts below too!
Disclosure: I am part of Trade Nation's Influencer program and receive a monthly fee for using their TradingView charts in my analysis.

Gold continues to declineThere will be a decline. A rebound from the trendline and will not go above 3050 - be careful!
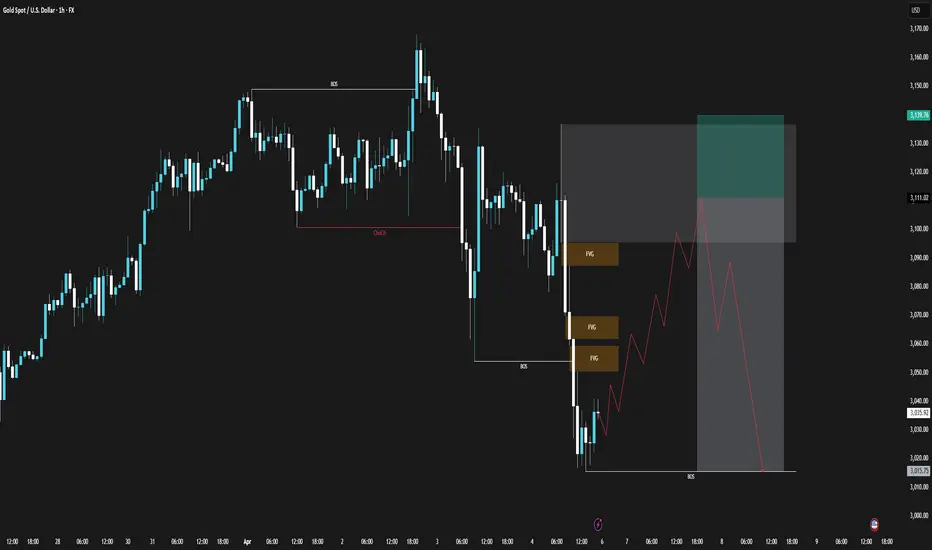
Gold TA 25.4.5Hello everyone, I hope you're doing well. In the 1-hour timeframe, the price of gold has taken a downward trend and has formed two lower lows. There is a very strong order block visible on the chart, and I expect that after the price retraces to this order block, it will react and continue to move down. We will wait for the price to reach this order block, then in the 5-minute timeframe, we will take the right trades and enter a short position. Keep in mind that in higher timeframes, the market is moving upwards, so short positions carry higher risk.
⚠️ This Analysis will be updated ...
👤 Sadegh Ahmadi: GPTradersHub
📅 25.Apr.5
⚠️(DYOR)
❤️ If you apperciate my work , Please like and comment , It Keeps me motivated to do better
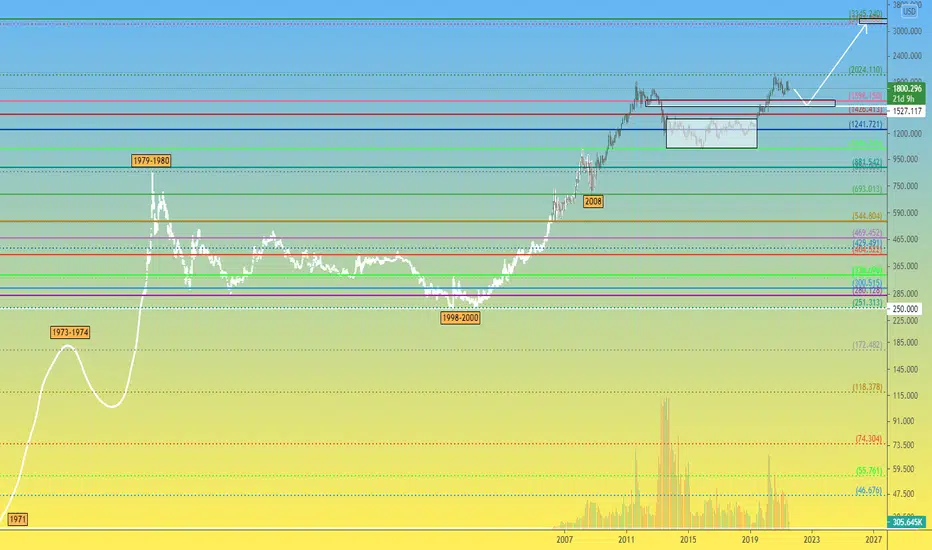
XAU 1M Gold price formation history and future expectationsGold , or as denote the main trading pair XAUUSD , has been gaining a lot of attention around itself in recent years.
As soon as major analysts or hedge fund top-managers begin to say that the next crisis is near, investors immediately start buying gold as a defensive asset, and its price, accordingly, goes up.
Let's walk a little through the history of the Gold price.
We finished drawing the graph, to what exists on tradingview.com, based on the data that is freely available.
1) In 1933, to overcome the crisis after the "Great Depression", US President Roosevelt issued a decree on the confiscation of gold from the population. The price for an ounce of gold is set at $20.66.
2) In 1971, a real rise in the value of gold begins. After decoupling the US dollar rate from the "gold standard", which regulated the cost of 1 troy ounce of gold at $35 for a long period from 1934 to August 1971.
3) 1973 - "The First Oil Crisis" and the rise in the value of gold from $35 to $180 - as the main anti-crisis instrument, a means of hedging investment risks.
4) 1979-1980 Islamic Revolution in Iran (Second Energy Crisis). The cost of gold, as the main protective asset, in a short period of time grows more than 8 times and sets a maximum at around $850
5) During 1998-2000, the world swept through: the "Asian economic crisis", defaults in a number of countries, and the cherry on the cake - the "Dotcom Bubble". During this period, the price of gold was twice aggressively bought out by investors, from the level of $250. It was a clear signal - there will be no lower, next, only growth!
6) And so it happened, from 2001 to 2011 there was an increase in the value of gold from $250 to $1921 . Even the mortgage crisis of 2008 could not break the growth trend, but only acted as a trigger for a 30% price correction.
Looking at the XAUUSD chart now, one can assume that large investors were actively buying gold in the $1050-1350 range during 2013-2019.
It is hard to believe that investors who have been gaining long positions for 6 years will be satisfied with such a small period of growth in 2019-2020.
For ourselves, we establish a Gold purchase zone in the range of $1527-1600 per troy ounce, from where we expect the growth trend to continue to the $3180-3350 region
What are your views on the future price of gold? Share them in the comments!
What Next For Gold?So I went back to the weekly after yesterday's success and ath (all time high) and had to re-draw my channel to get a little insight to where she's headed. To be honest, i see a move to 3300 happening (not a prediction). So I have this little vibe. watch the video to see my entry..

Why make it too complicated?!!Find the trend, follow the trend and stay on the trend. If can't find the trend then wait, trading is a marathon and not sprint.

I Came Back As A Gold TraderThis is a short detailed video about my journey and transition from PEPPERSTONE:NAS100 to NASDAQ:XAU . For Gold, I see a very big push for a new all time high at 3189-3200. All this is possible if the previous high gets a solid break since there's been a major resistance in the area. I'm currently in the trade and added another just incase. Let's see how this plays out..

Trader's Alert: Gold Potential Top, Signal (Bullish Bitcoin)Gold today is making a strong move after hitting a new All-Time High. The current session is red and has the highest volume since November 2024. This is an early signal that can be interpreted as the top being printed. Very early.
Gold peaking can have a strong significance for us Cryptocurrency traders. Gold has been in a strong uptrend since December 2024. Bitcoin peaked and went sideways with bearish tendencies in December 2024. They have been moving in contrary direction. This can mean that a Gold top would produce a Bitcoin bottom.
The Gold peak can mean a change in market dynamics, all markets. Bullish goes bearish and bearish goes bullish.
Gold is still bullish on the weekly timeframe but with a parabolic rise. A parabolic rise tends to end with a sudden crash. A true parabola.
This is a friendly alert to all Gold traders.
XAUUSD is likely to go down.
Confirmation is needed.
Thank you for reading.
Namaste.
XAU going to drop market structure shift and choch happened and market take the idm and now making liquidity for the target partily book profit extram poi is 2850
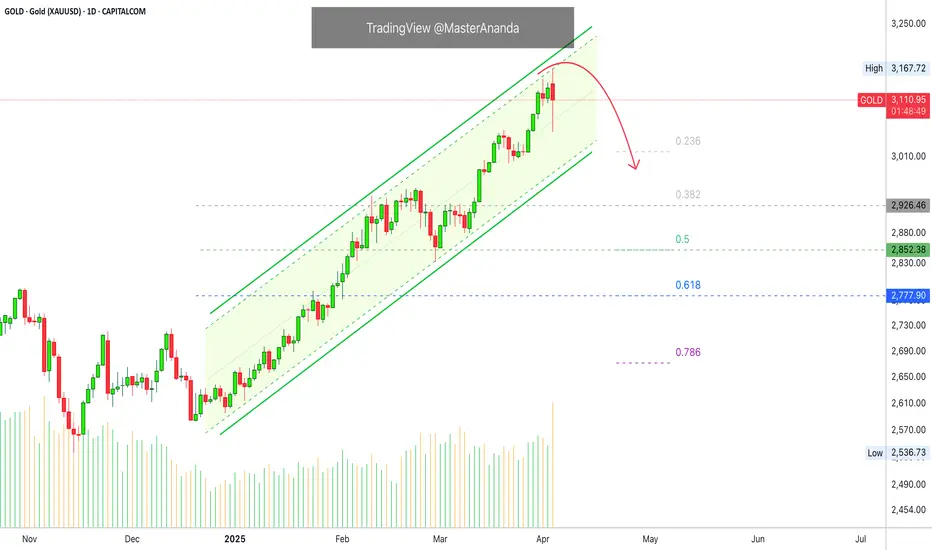
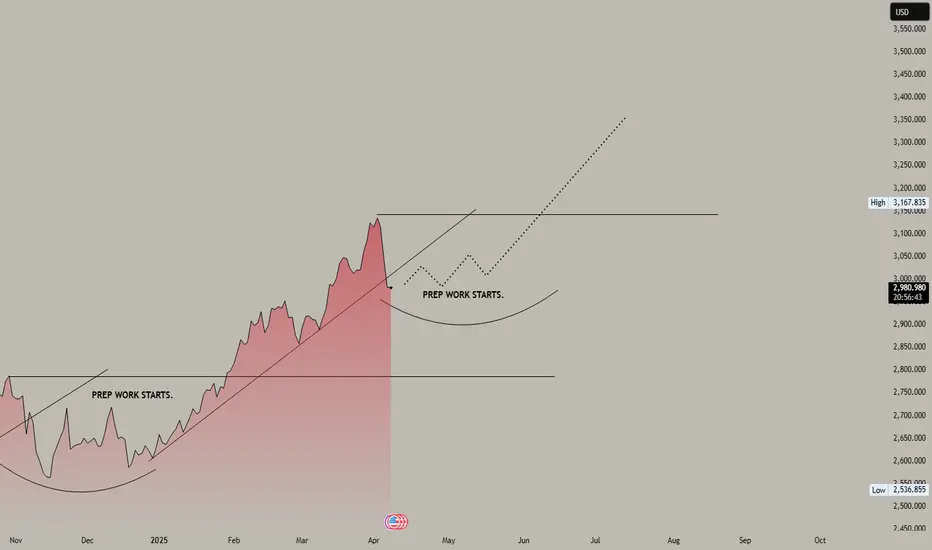
GOLD, preppin tarmac for the next FLIGHT season from here 2980GOLD has been breaking expectations the last few weeks with constant ATH breaks and parabolic surges since last year -- overtaking most risk-on assets in the field and for good reason. I can't say enough fundamental reasons because they are too far many -- which all favors GOLD's ultra ascend.
After tapping its ATH peak at 3167, gold finally retreated for a healthy trim down following the markets RED pressure. It tapped 61.8 fib levels to touch 2979 zone -- an almost a 2000 pip drop.
This area is where most buyers converge. And based on our latest metrics from the diagram -- we are now starting a new transitional phase, and prep work for the next BIG SHIFT. It is currently commencing as we speak.
This transition shifts only comes once every 6 months -- so this occasion is very rare specially to those who seek to get the best seasonal price (post correction).
*Disclaimer, we may see some bargain overextension moves from here -- but those are good opportunities to stack up if it gives more discount ranges.
Ideal seed at the current range. A retap of the ATH peak -- and go beyond further is expected from the higher basing zone.
Last chance to grab this rare discount season.
Spotted at 2980.
Interim at 3167 (current) ATH
Mid 3300
Long term 4000.
TAYOR. Trade safely.
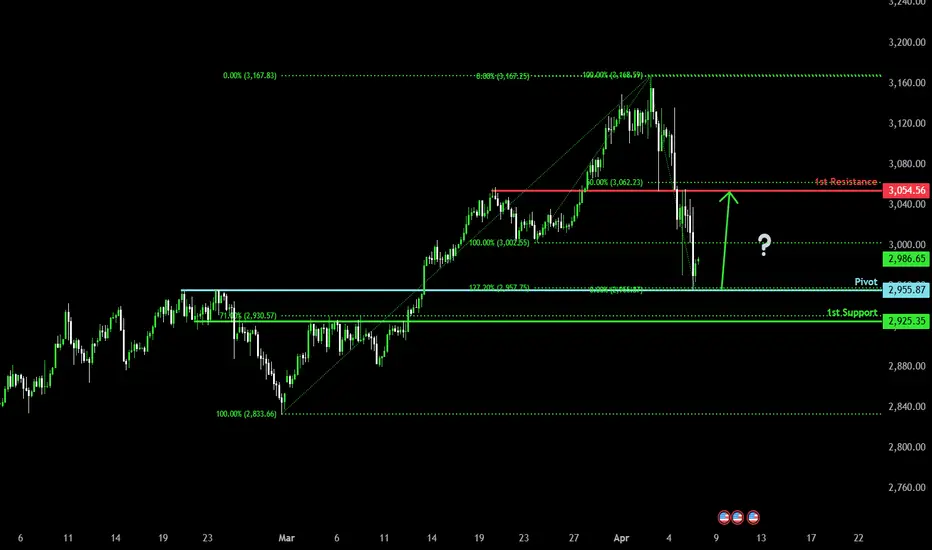
Could the Gold rebound from here?The price has reacted off the pivot and could potentially rise to the 1st resistance.
Pivot: 2,955.87
1st Support: 2,925.35
1st Resistance: 3,054.56
Risk Warning:
Trading Forex and CFDs carries a high level of risk to your capital and you should only trade with money you can afford to lose. Trading Forex and CFDs may not be suitable for all investors, so please ensure that you fully understand the risks involved and seek independent advice if necessary.
Disclaimer:
The above opinions given constitute general market commentary, and do not constitute the opinion or advice of IC Markets or any form of personal or investment advice.
Any opinions, news, research, analyses, prices, other information, or links to third-party sites contained on this website are provided on an "as-is" basis, are intended only to be informative, is not an advice nor a recommendation, nor research, or a record of our trading prices, or an offer of, or solicitation for a transaction in any financial instrument and thus should not be treated as such. The information provided does not involve any specific investment objectives, financial situation and needs of any specific person who may receive it. Please be aware, that past performance is not a reliable indicator of future performance and/or results. Past Performance or Forward-looking scenarios based upon the reasonable beliefs of the third-party provider are not a guarantee of future performance. Actual results may differ materially from those anticipated in forward-looking or past performance statements. IC Markets makes no representation or warranty and assumes no liability as to the accuracy or completeness of the information provided, nor any loss arising from any investment based on a recommendation, forecast or any information supplied by any third-party.
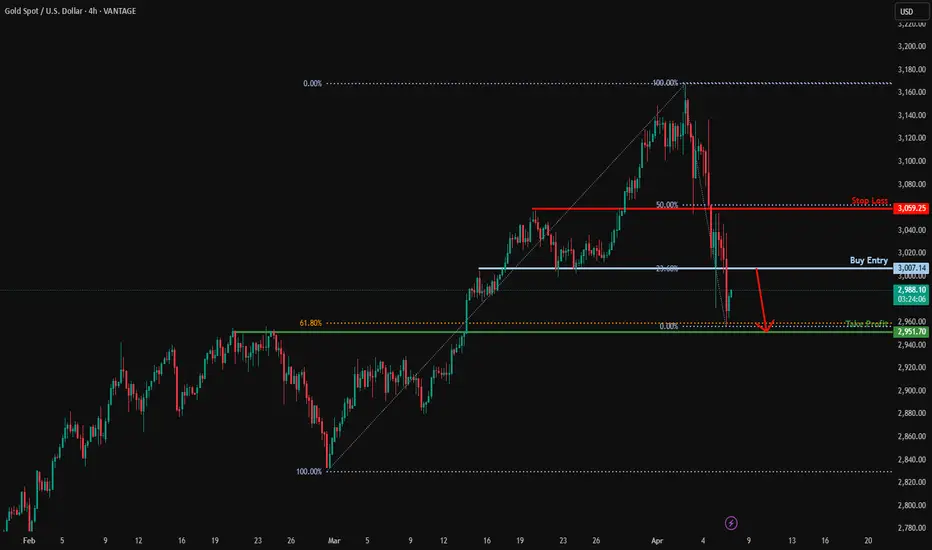
Potential bearish drop?XAU/USD is rising towards the resistance level which is a pullback resistance that aligns with the 23.6% Fibonacci retracement and could drop from this level to our take profit.
Entry: 3,007.14
Why we like it:
There is a pullback resistance level that line sup with the 23.6% Fibonacci retracement.
Stop loss: 3,059.25
Why we like it:
There is a pullback resistance level that lines up with the 50% Fibonacci retracement.
Take profit: 2,951.70
Why we like it:
There is a pullback support level that is slightly below the 61.8% Fibonacci retracement.
Enjoying your TradingView experience? Review us!
Please be advised that the information presented on TradingView is provided to Vantage (‘Vantage Global Limited’, ‘we’) by a third-party provider (‘Everest Fortune Group’). Please be reminded that you are solely responsible for the trading decisions on your account. There is a very high degree of risk involved in trading. Any information and/or content is intended entirely for research, educational and informational purposes only and does not constitute investment or consultation advice or investment strategy. The information is not tailored to the investment needs of any specific person and therefore does not involve a consideration of any of the investment objectives, financial situation or needs of any viewer that may receive it. Kindly also note that past performance is not a reliable indicator of future results. Actual results may differ materially from those anticipated in forward-looking or past performance statements. We assume no liability as to the accuracy or completeness of any of the information and/or content provided herein and the Company cannot be held responsible for any omission, mistake nor for any loss or damage including without limitation to any loss of profit which may arise from reliance on any information supplied by Everest Fortune Group.
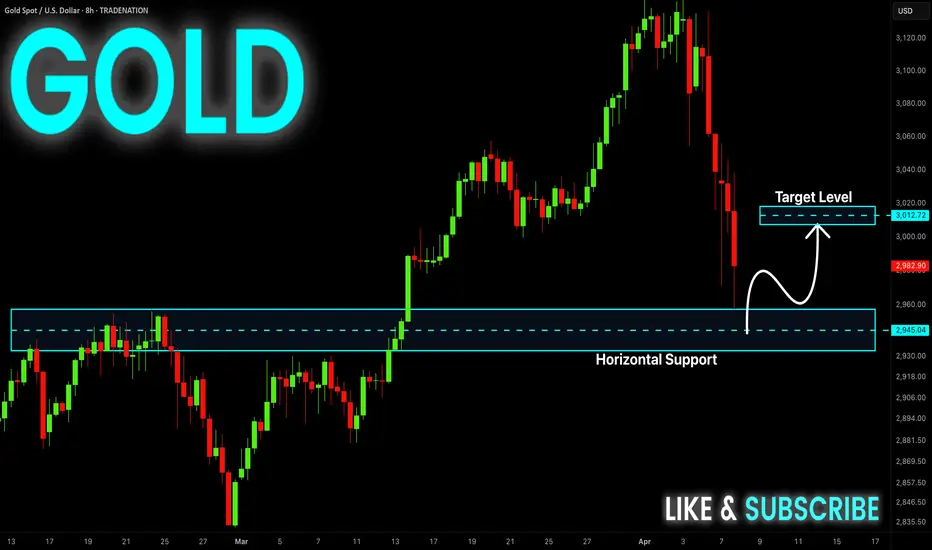
GOLD Will Go UP! Buy!
Hello,Traders!
GOLD made a nice correction
Of almost 7% on the general
Panic over the trade wars which
Gives us a great opportunity
To jump into Gold with a discount
From a nice horizontal support
Level of 2945$ from where
We will be expecting a
Further bullish move up
Buy!
Comment and subscribe to help us grow!
Check out other forecasts below too!
Disclosure: I am part of Trade Nation's Influencer program and receive a monthly fee for using their TradingView charts in my analysis.
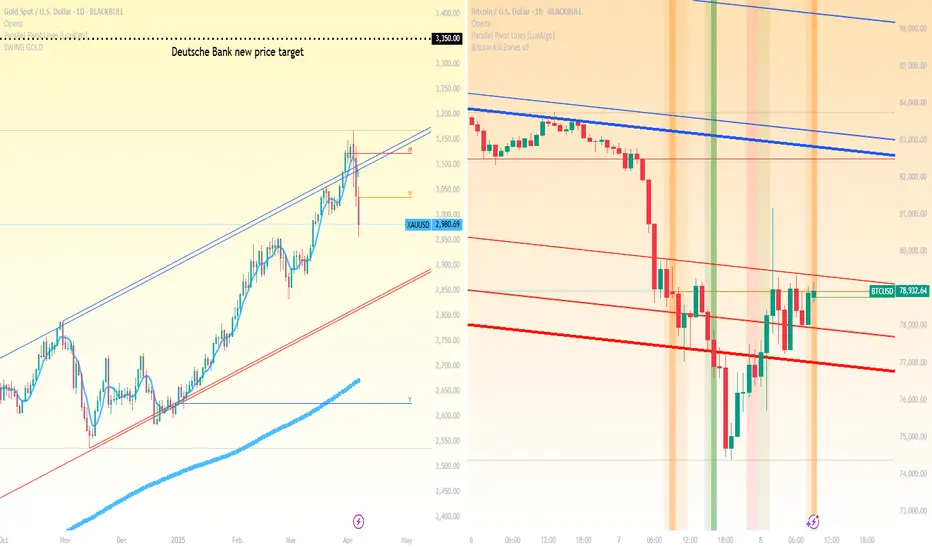
It could be worse for Gold and Bitcoin, right? Apple alone has shed nearly $640 billion in market capitalisation over just three days. The S&P 500 has fallen more than 10% during the same stretch—its worst performance since the onset of the COVID-19 pandemic. In Asia, the selloff is even more severe, with Japan's Nikkei 225 down nearly 8%, South Korea’s Kospi 200 off almost 6%, and Taiwan equities falling close to 10%, triggering circuit breakers.
In comparison, Bitcoin and Gold, while under pressure, appear to be weathering the downturn with relatively less panic.
Bitcoin has declined around 10%—a notable drop, but not unusual by crypto standards. Trading near $76,000, it has returned to pre-election levels, breaching both short- and long-term support zones.
Gold is tracking its worst three-day performance in over four years. Although some positive forecasts are emerging. Deutsche Bank has revised its year-end gold price forecast upward to $3,350, citing rising recession risks and renewed safe-haven demand.
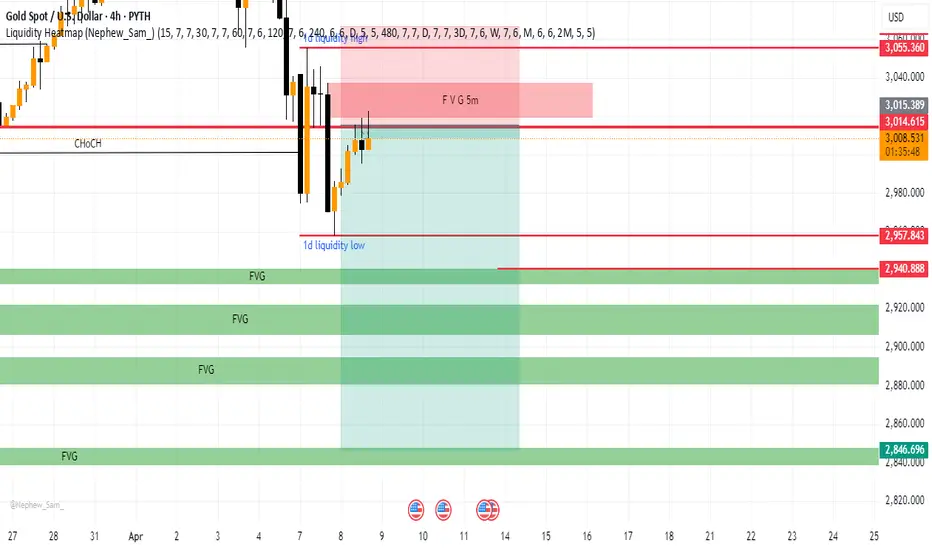
Gold (XAU/USD) Price Outlook:Gold (XAU/USD) Price Outlook:
🔸 Bearish Scenario:
If the price of gold breaks and closes below the key support level of 3016, it will indicate a strong bearish signal. This breakdown would suggest that selling pressure is increasing, and we could see a continued downward move toward the next support zone. The immediate target in this case would be around 3002, where buyers may attempt to step in. A sustained move below 3002 could open the door for further downside.
Key Levels to Watch:
Support: 3016 (break level)
Target: 3002/2978
Additional downside possible if 3002 fails to hold
🔸 Bullish Scenario:
On the other hand, if gold breaks and closes above the resistance level of 3030, it will signal bullish momentum and a possible continuation of the uptrend. This breakout could trigger buying interest, pushing the price higher toward the next resistance levels at 3052 and 3065. These levels will act as short-term targets for bulls.
Key Levels to Watch:
Resistance: 3030 (break level)
Bullish targets: 3052 and 3065
Further upside possible if momentum continues above 3065
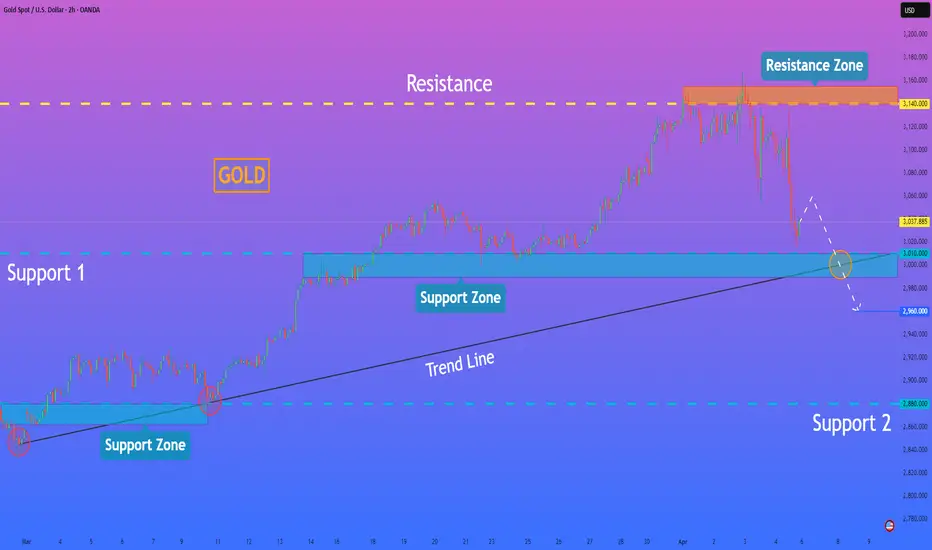
HelenP. I Gold may continue to fall and break support levelHi folks today I'm prepared for you Gold analytics. After failing to hold above the resistance zone between 3140 and 3155 points, Gold made a sharp reversal. The strong bearish reaction from this area marked the end of the previous bullish momentum and triggered an aggressive sell-off. That move broke several minor support levels and pushed the price all the way down to the current support zone between 3010 and 2990 points. Previously, Gold had shown a stable uptrend, consistently bouncing from the trend line and using it as a dynamic support. Each pullback was met with buying pressure, allowing the price to climb higher. However, this time, after reaching the 3140 resistance level, buyers were overwhelmed by strong selling activity. Currently, Gold is trading just above the key support zone and close to the trend line. This area has acted as a pivot level multiple times, but the latest price action shows hesitation from buyers and growing control from sellers. Given the recent sharp decline, the break from the resistance zone, and the pressure near the current support, I expect Gold to continue falling toward 2960 points — my current goal. If you like my analytics you may support me with your like/comment ❤️