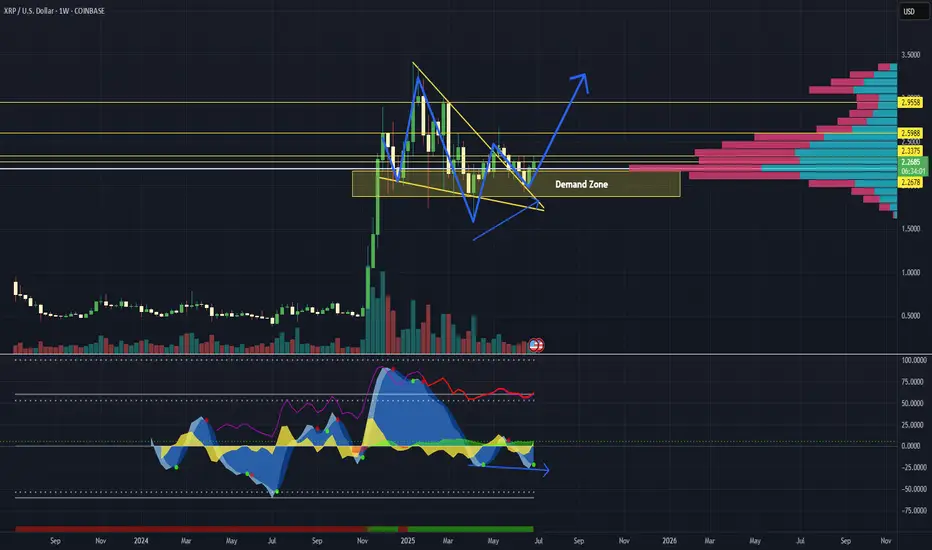
XRP: Ripple Ready to Unleash a Tsunami?Ripple (XRP) is coiling like a spring—ready to explode. After five clean re-tests of a powerful demand zone, buyers have repeatedly stepped in to defend key levels, launching 40–75% swings each time. Is this the moment it unleashes the wave?
🔍 Technical Breakdown:
✅ Demand Zone Strength
XRP is bouncing from a long-tested demand zone (5+ re-tests). Each bounce led to substantial upside momentum.
✅ Bull Flag Retest
XRP previously broke out of a large bull flag and has been holding the flag’s top trendline for over 40 days—acting as strong support.
✅ Higher Low Structure
Price formed a higher low (H/L) and has climbed steadily for two weeks—building bullish structure.
✅ Volume Profile
Price reclaimed ground above the high-volume node, signaling accumulation strength.
✅ Market Cipher B Divergence
A weekly hidden bullish divergence is present—not massive, but notable—hinting at momentum shift.
⚠️ What to Watch:
Volume is key: Current consolidation shows a decline in volume—a surge could ignite the breakout.
Confirmation for conservative traders: Wait for a break and hold above $2.33 with volume, or a retest of that level.
If past demand zone reactions repeat, a breakout could be imminent.
What do you think?
📈 As always—this is not financial advice. Do your own research.
🧭 Happy Hunting!
J-xrp
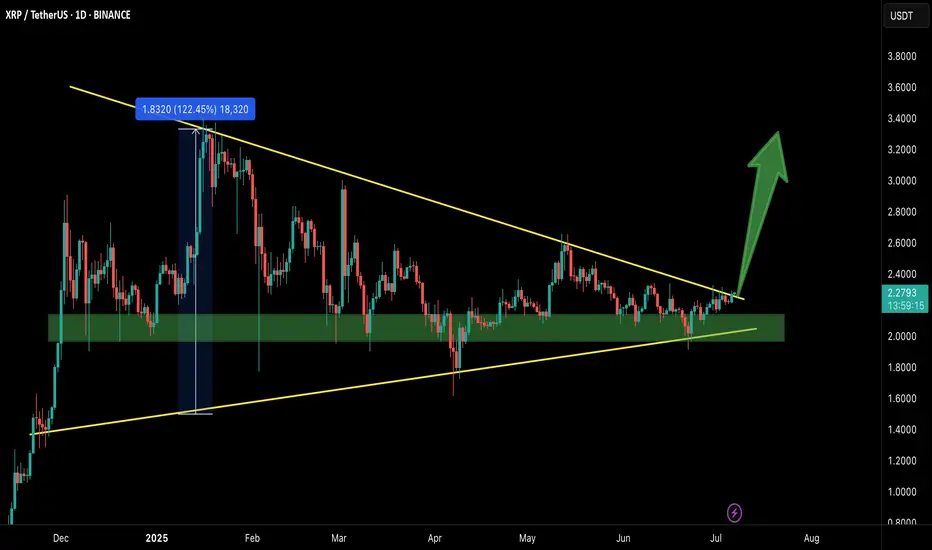
XRP/USDT| Targeting $3.3 to $3.7📝 Description:
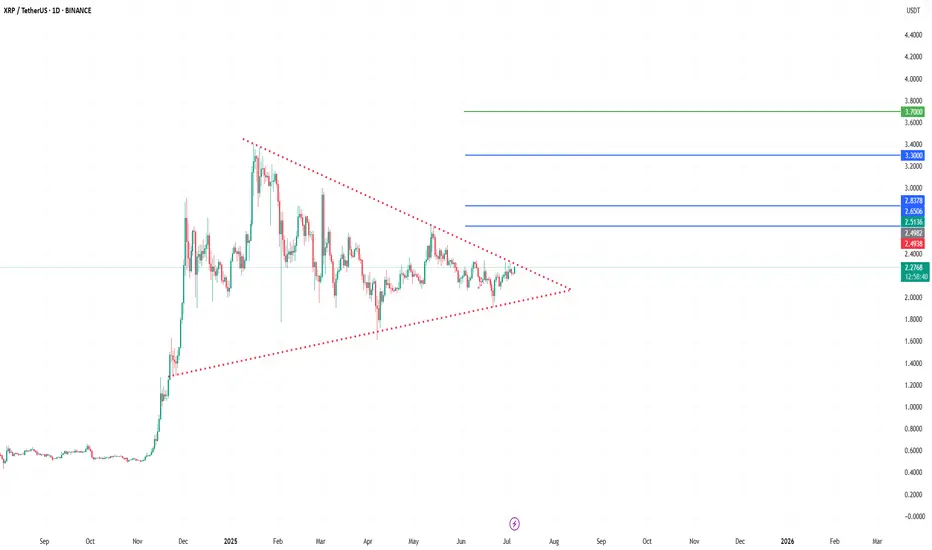
XRP has been consolidating inside a large symmetrical triangle on the daily chart since early 2025. Price is now approaching the apex, suggesting a potential breakout move is near.
🔹 Upper trendline resistance: ~$2.49
🔹 Lower trendline support: ~$1.90
🔹 Breakout level to watch: $2.45–$2.50
✅ If a breakout is confirmed with strong volume, potential upside targets include:
🎯 $3.30 – mid-range target
🎯 $3.70 – full breakout objective
A spike in volume will be key to confirming the move. Until the breakout is validated, this setup remains neutral.
📌 This is not financial advice – please do your own research before making any trading decisions.
💬 What’s your target for XRP if this breaks out?
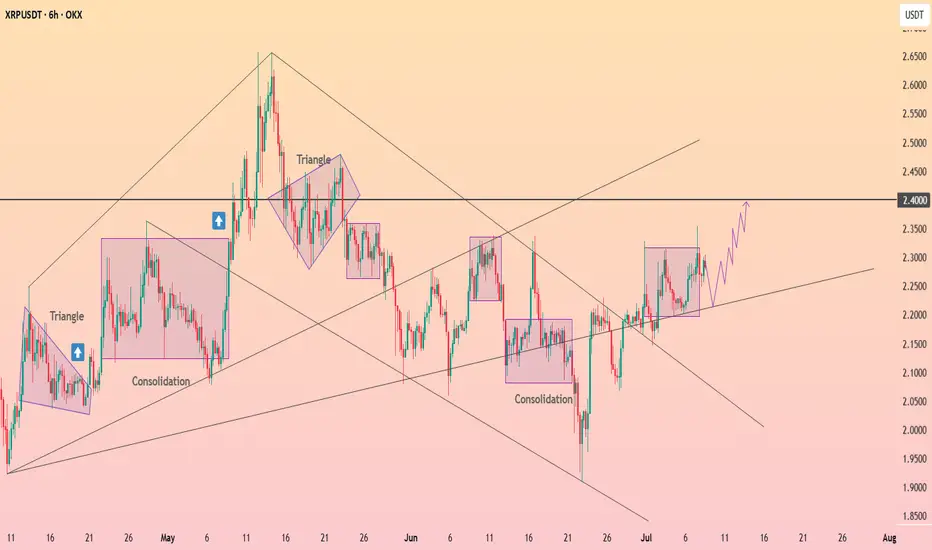
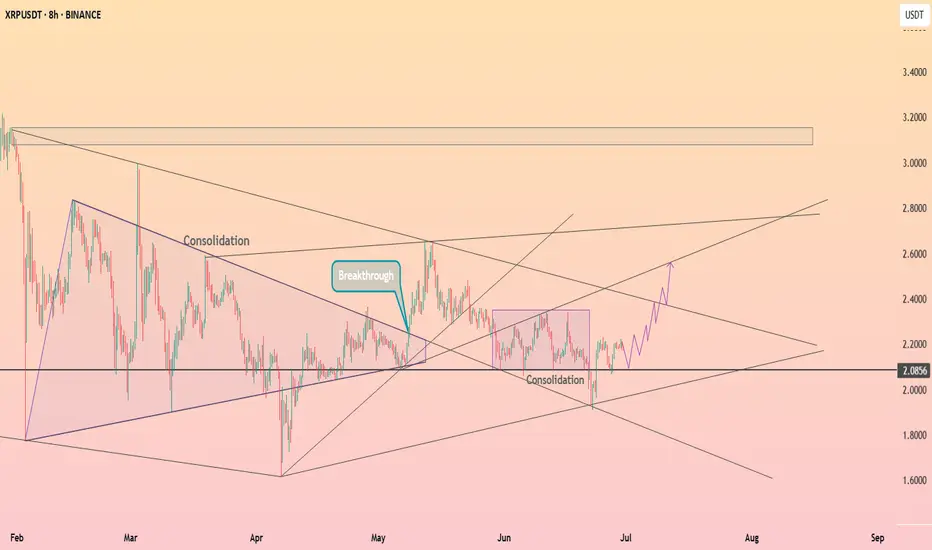
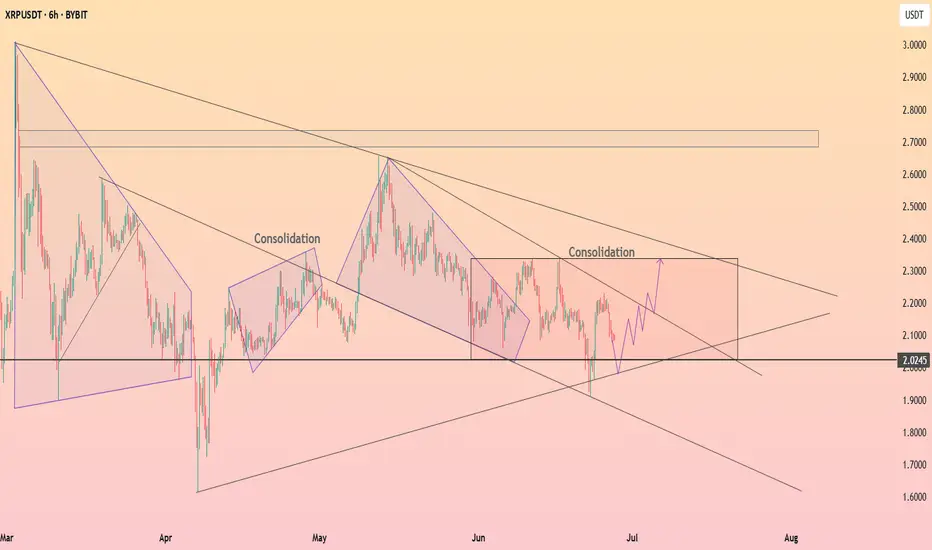
HolderStat┆XRPUSD targeting $2.4BINANCE:XRPUSDT is printing repeated consolidation zones and ascending structures. Price is currently rebounding above 2.20, eyeing a breakout toward 2.40. The bullish momentum persists with higher lows and breakout setups.
XRP - How they gonna know? They gonna know!Huuuhh XRP blind longs eh? But yeah you can but if i was I wouldn;t

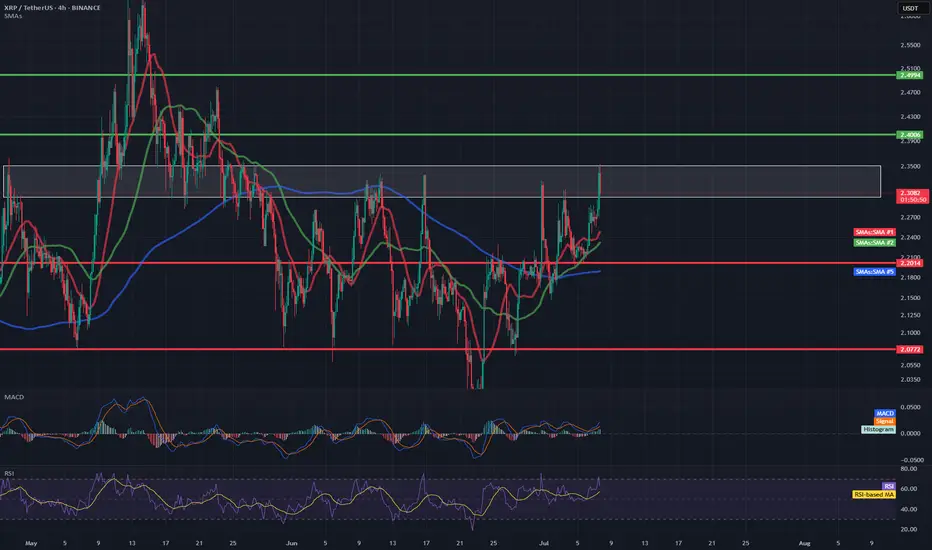
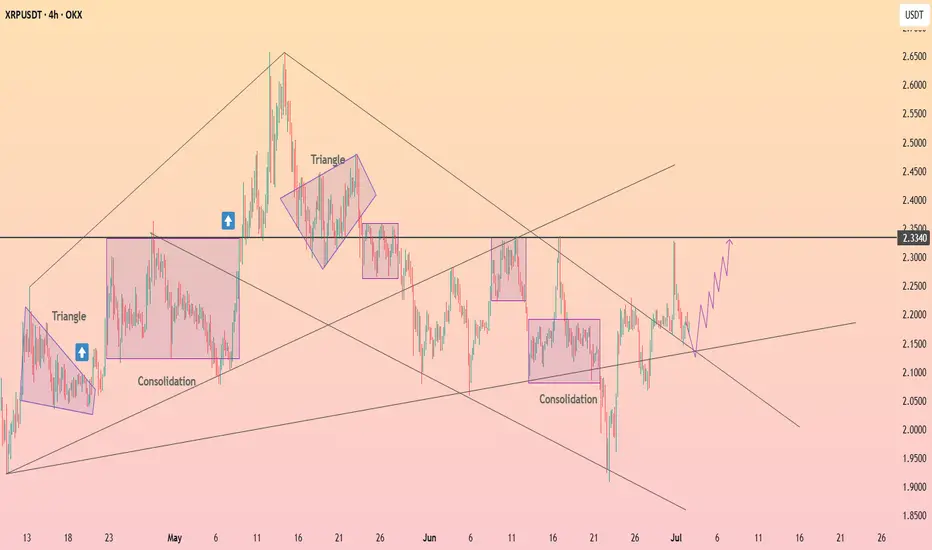
XRP/USDT 4H📊 1. Trend and moving averages
Red line (SMA 10) – short-term, currently rising, which suggests upward momentum.
Green line (SMA 20) – also in the upward trend and below the price – dynamic support.
Blue line (SMA 50/200) – probably SMA 50 or 200 – the price has broken through it from below and is currently above it – this is a pro-growth signal.
📌 Conclusion: In the short and medium term, a reversal of the trend to growth is visible.
📈 2. MACD (Moving Average Convergence Divergence)
The MACD line has crossed the signal line from below, which is a buy signal.
The MACD histogram is rising and is above zero – further confirmation of the upward trend.
📌 Conclusion: The upward momentum is increasing.
💪 3. RSI (Relative Strength Index)
RSI is currently at ~62, which means that:
We are still ahead of the overbought zone (70).
RSI is rising – it suggests bullish buyer pressure.
📌 Conclusion: There is still room for further growth before the market is overbought.
🔍 4. Market structure and resistance/support
The price is in the 2.30–2.35 USDT zone, which previously acted as resistance.
The closest resistance is around 2.38–2.40 USDT – the level from May, where the decline occurred.
The closest support is around 2.20 USDT (in line with the green SMA) and stronger at 2.05–2.10 USDT (earlier consolidations).
📌 Conclusion: Breaking 2.40 opens the way to a test of 2.50 and above.
🧠 Technical Summary
Aspect Rating
Trend (SMA) ✅ Up
MACD ✅ Buy
RSI ⚠️ Near overbought
Resistance/Support ⚠️ Resistance at 2.38–2.40
Movement Potential ✅ To 2.50 or higher
📌 Potential scenarios:
✅ Bullish (uptrend scenario)
A hold above 2.30 and a breakout of 2.40 could give an impulse for further gains towards 2.50–2.60.
Strong confirmation would be an increase in volume.
⚠️ Bearish (correction scenario)
A rejection from 2.38 and a drop below 2.20 could initiate a retest of support at 2.05 or even 1.95.
XRP/USDT – Breakout Confirmed!Hey Traders — if you're into high-conviction setups with real momentum, this one’s for you.
XRP has finally broken out from the massive symmetrical triangle on the 1D timeframe after holding the green support zone like a champ.
This structure has been compressing for months, and with this breakout, momentum could be shifting in favor of the bulls.
Entry: Current Market Price (CMP)
Add More: On dips above $2.20
Targets: $2.60 / $2.95 / $3.40 / $3.80
Stop Loss: $2.05
Leverage: 5x–10x
As long as price stays above the breakout zone, this setup holds strong potential. Keep a close eye for volume confirmation and follow-through.
Let’s see how this plays out. Will update as it unfolds.
XRP - Huge breakout incomingXRP price is retesting it's descending trendline, in the past price got rejected from this trendline multple times, however im expecting price to breakout from this trendline since we almost at the last 2 quarters of bull run.
We will enter the trade after candle closes above the trendline
Entry Price: 2.34
StopLoss: 1.89
TP1: 2.5981
TP2: 2.8543
TP3: 3.2796
TP4: 3.8676
Like and follow.
Cheers
GreenCrypto
XRP .. few weeks before next bull?A new low is possible before Bull run!
it may be huge or one candle ,,
don't take the fractal exactly as you see for every movement
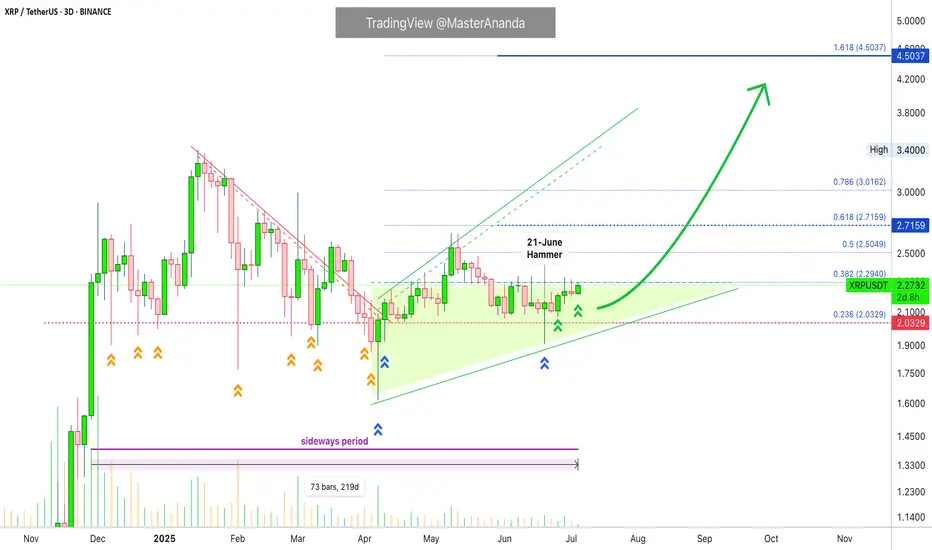
XRP $2 Support Updated, Tested 12 Times & When BullishThere is one number, a price level, that defines XRP's current situation. Either bearish or bullish depends on this number: $2.
As long as XRPUSDT trades above $2, we know the bulls have the upper hand and the bullish bias is confirmed.
If XRPUSDT moves and closes below $2, we know the bulls are losing momentum, the bears are gaining the upper hand and lower prices are possible.
What is the current situation?
XRP continues to trade above $2 and this price continues to be left behind, meaning, the bulls are winning.
Before 7-April, this level was tested over and over, again and again. After 7-April, only two challenges and the last one, 21-June, ended as a perfect bullish hammer. Now the action is moving higher toward resistance, growing not lower. $2 has been confirmed as support.
Now that support has been confirmed, we can expect additional growth. It can take some time, maybe a few days but the bulls are in control.
It can take some time, not that long, the market has been sideways for more than 7 months. This is a long-time and no more is needed. The consolidation period just reached its end.
The final low happened late last month, Crypto is set to grow; XRP will be doing great in a matter of days. Closer than anything you can think or expect, next week can be boom, sellers are exhausted. People are back to work.
Thank you for reading.
We are about to experience a growth explosion.
Namaste.
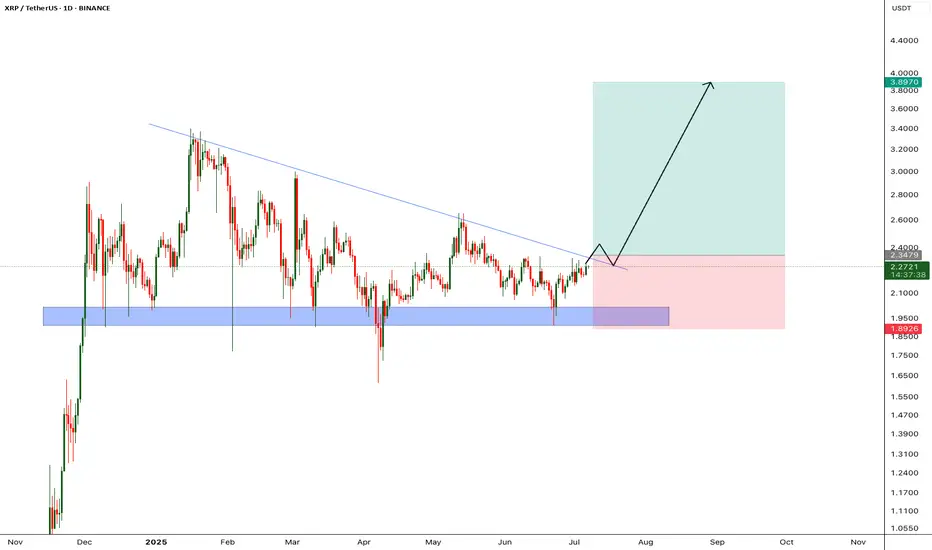
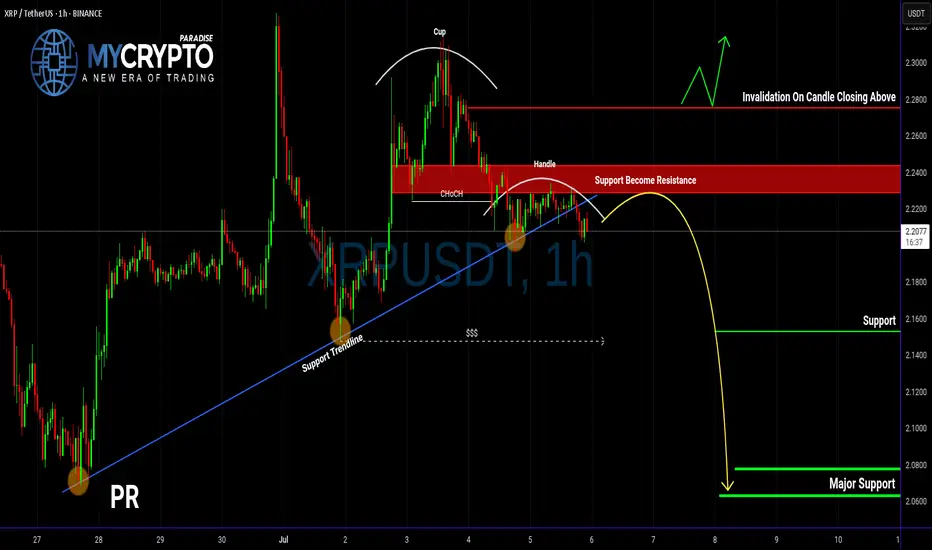
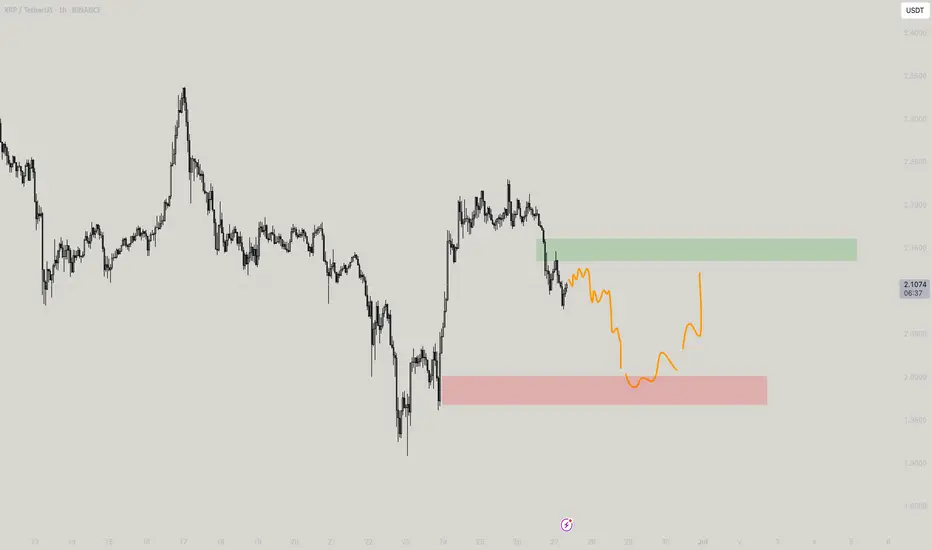
XRP Breakdown Ahead? Don’t Get Caught LongYello, Paradisers! Are you about to fall into a classic trap on XRP? The signs are stacking up, and if you're not careful, this move could catch a lot of traders on the wrong side of the market.
💎XRPUSDT is showing clear signs of weakness. A bearish CHoCH (Change of Character) has formed, and an inverse Cup & Handle pattern is currently playing out. On top of that, price action has decisively broken below the key support trendline. These signals together significantly increase the probability of a deeper bearish move in the coming days.
💎From the current price level, XRP is offering a 1:1 risk-to-reward setup. While this may attract more aggressive or short-term traders, the safer and more strategic approach is to wait for a proper pullback before entering. That would allow for a more favorable risk-to-reward and confirmation of the trend direction, reducing the likelihood of being caught in short-term noise.
💎It’s also crucial to watch the invalidation level. If XRP manages to break back above that zone and close a candle above it, this would invalidate the current bearish idea entirely. In such a case, it's better to stay patient and wait for clearer price action before making any decisions.
🎖Strive for consistency, not quick profits. Treat the market as a businessman, not as a gambler.
MyCryptoParadise
iFeel the success🌴
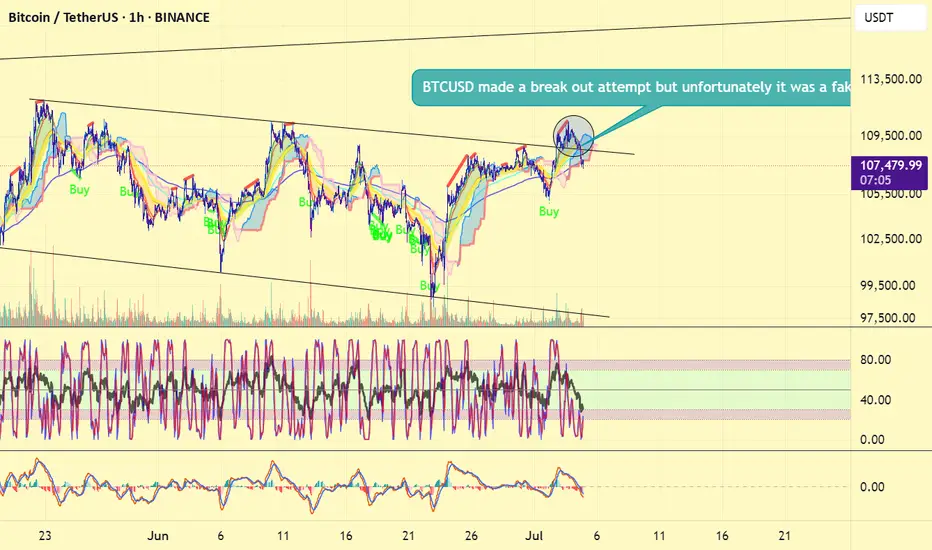
All this just before Fedwire implements ISO20022?#bitcoin #btc price attempted a breakout but today failed with dumps. There "may" be other attempts but while ISO20022 subject is approaching, isn' t it wise to think about #xrp and other ISO20022 licenced coins will overperform the others (BTC, ETH, SOL and all other non iso certified coins) in near future? Not financial advice.
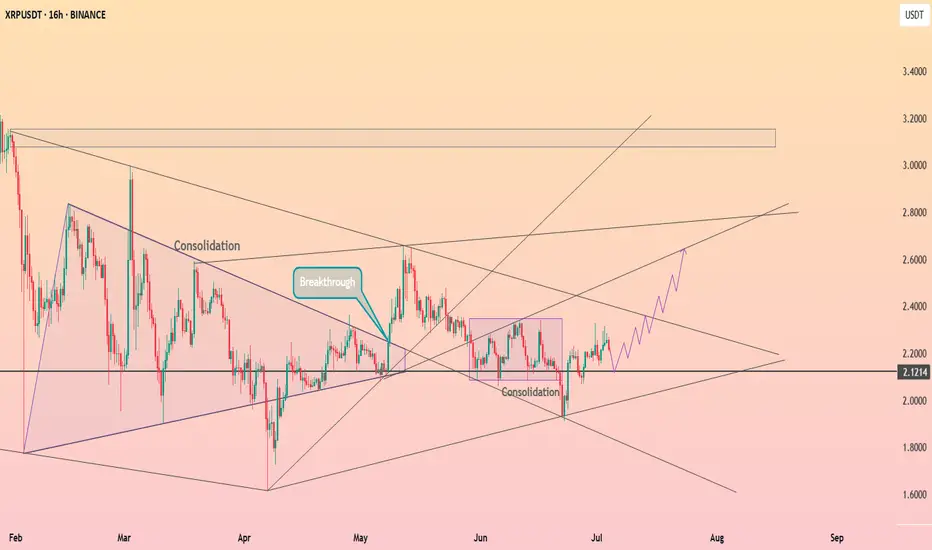
HolderStat┆XRPUSD forms an ascending structureBINANCE:XRPUSDT is forming a stair-step bullish pattern after breaking out of consolidation above 2.12. The current trajectory suggests continued movement toward 2.70, with multiple support bounces validating the structure. Price action remains favorable for bulls.
HolderStat┆XRPUSD forming the rising bottomBINANCE:XRPUSDT has broken above resistance and is consolidating above the breakout zone. This mirrors previous triangle–consolidation patterns that preceded upside moves. If momentum continues, a run toward 2.34 is in play.

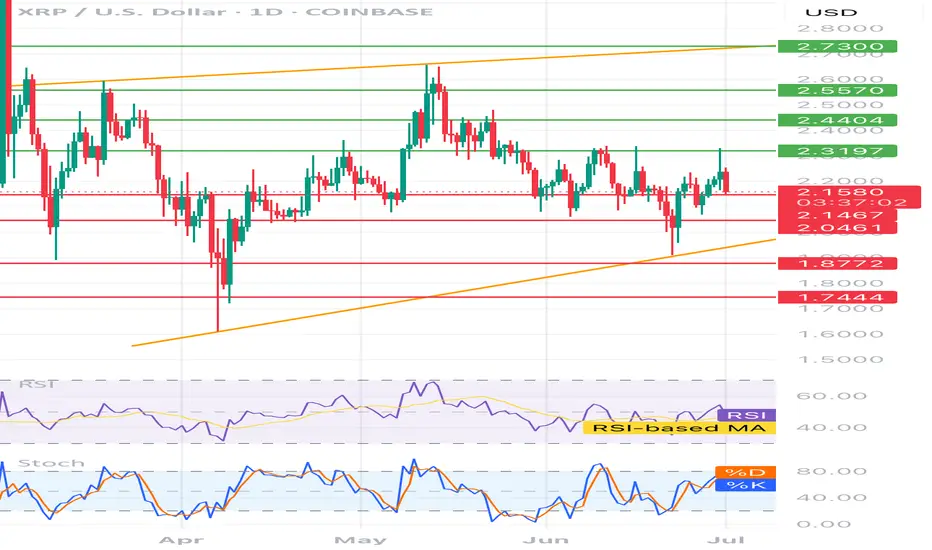
XRP/USD – Technical Analysis (1D)📊 XRP/USD – Technical Analysis (1D)
Current Price:
• Buy: 2.1554 USD
• Sell: 2.1553 USD
⸻
🧭 Trend & Structure
• Price is moving within a rising channel (orange lines).
• It’s currently trading closer to the lower trendline, suggesting potential support.
Resistance Levels (green lines):
• 2.3197
• 2.4404
• 2.5570
• 2.7300 (channel top)
Support Levels (red lines):
• 2.1467
• 2.0461
• 1.8772
• 1.7444 (key support)
⸻
📈 Indicators
RSI (Relative Strength Index)
• Hovering around the 50 level → neutral momentum.
• No strong divergence observed – RSI is moving with price.
Stochastic Oscillator
• %K has crossed %D upward → short-term bullish signal.
• Nearing the overbought zone (above 80) → a pullback could occur soon.
⸻
📌 Interpretation
• Price is testing the 2.15–2.16 zone, which has acted as both support and resistance in the past.
• A break above 2.32 could open the door toward 2.44 and 2.55 USD.
• A drop below 2.04 USD could lead to retesting 1.87 or even 1.74 USD.
• Overall trend: neutral to bullish, supported by the rising channel.
🎯 Trading Ideas
• Long Entry: Break and close above 2.32 USD with volume → targets: 2.44 / 2.55
• Short Entry: Breakdown below 2.04 USD → targets: 1.87 / 1.74
HolderStat┆XRPUSD before retest of the $2 levelBINANCE:XRPUSDT has rebounded from its 2.08 base and broken out of consolidation, aiming for the upper diagonal resistance near 2.40–2.60. With recurring bullish patterns and a history of strong follow-through after similar setups, momentum may build if 2.20 is cleared.
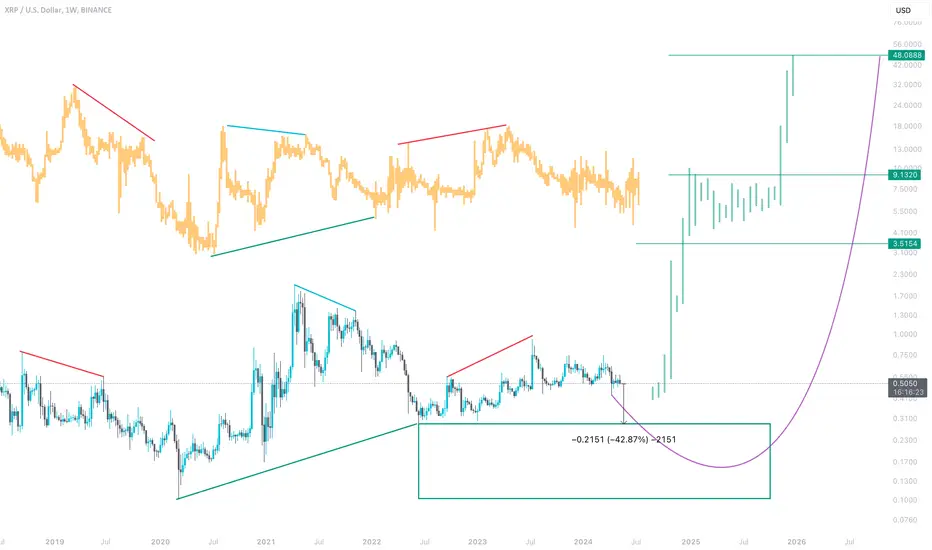
Xrp - The expected rally of +50%!Xrp - CRYPTO:XRPUSD - is still clearly bullish:
(click chart above to see the in depth analysis👆🏻)
Ever since Xrp rallied more than +550% in the end of 2024, we have been witnessing a quite expected consolidation. However Xrp still remains rather bullish and can easily retest the previous all time highs again. Maybe, we will even see another parabolic triangle breakout.
Levels to watch: $3.0, $10.0
Keep your long term vision!
Philip (BasicTrading)

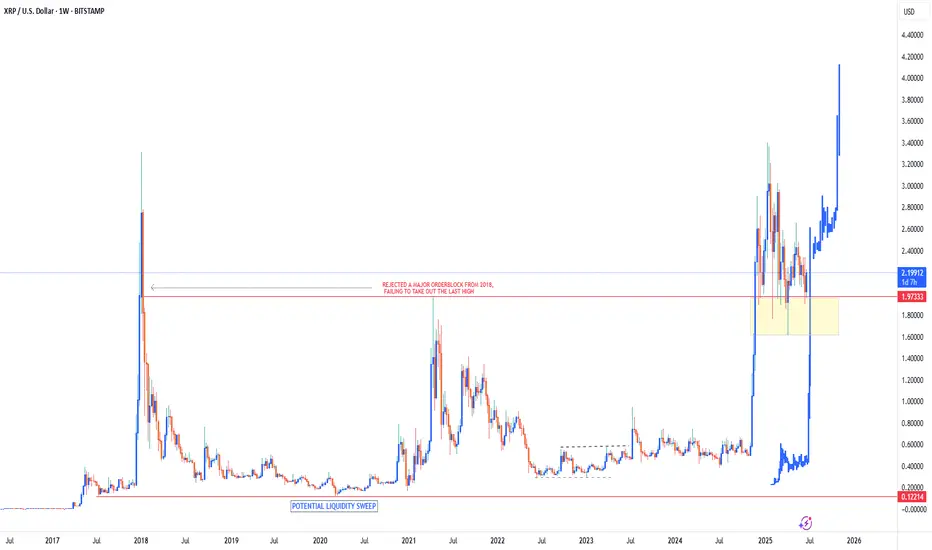
XRP Bullish to ATH of $4.10Since breaking out of its 6 year price range of $0.12 - $1.97 in November 2024, Ripple has remained within a bullish territory, sitting just above its support zone of $1.60 - $1.97.
As long as price can remain above this support zone I do believe that Ripple has much more upside to come in the next few YEARS. This definitely won’t be a fast move as there’s still a lot of legal situations involving XRP which is keeping price limited to the upside. But, as these legal battles come to an end & they will, it will slowly give XRP room to move to the upside.
I definitely see $4.1 as an achievable target for Ripple as the first target in the future. Once this price is reached, market structure & price action will give us a better indication of whether or not we can see high prices above the $4.1 target.
For now just be patient & let XRP play out in accordance with its external macro factors.
HolderStat┆XRPUSD consolidation of the assetBINANCE:XRPUSDT has bounced from the 2.02 level and is approaching the upper edge of a large consolidation structure. Multiple prior consolidation zones have led to breakouts, and the current bounce hints at continuation toward 2.30. A clean close above resistance would confirm bullish intent.
XRP - Do you want to slurp?Yeah who doesnt wants to slurp profits? I shall say the move down shall be taken first before the formation of the pattern to work in accordance with the moves! Hope its understood
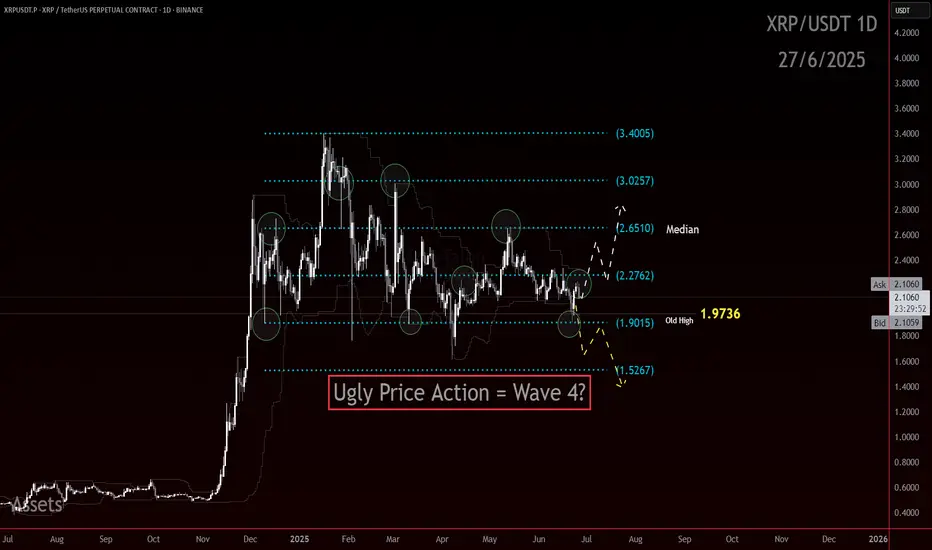
XRP UG-ah-LYXRP has been slowly chopping lower in a mess of overlapping candles. Lower highs and lower lows at the Highest degree. The trend is down and the Elliott Is ugly.
There is a chance here for the trend to shift, but that low needs to hold.
In Elliott Wave, ugly can be useful. An ugly pattern often screams correction. That is the working assumption right now. This structure could still be a complex wave four.
Even though the wave count has not been crystal clear, I am not flying blind. I am using support and resistance to track the structure and wait for clarity.
Here are the levels that matter right now:
3.4005 was the major high
3.0257 and 2.2762 are key reaction zones
2.6510 is the median and the first major line bulls need to beat
1.9736 is the old high that price continues to bounce from
1.9015 and 1.5267 are the potential downside reaction zones if the yellow path unfolds
If this is a correction, there is still potential to hold above 1.62 and send. If that level goes, the structure shifts fast to lower targets.
This is not the time to get brave without confirmation, mo.
Ugly price action can still resolve cleanly. But I want to see an impulsive move through one of these levels, followed by a corrective return to that level. That would offer a more ideal continuation in whichever direction price decides.
Let the level reactions speak first. I will act after.
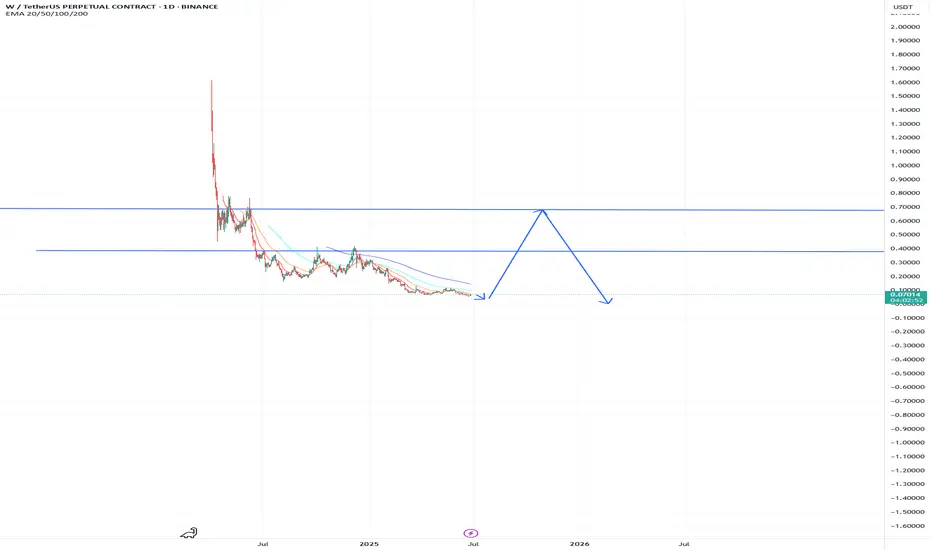
w partners with Ripple XRP.. alt season gemwhen alt season comes Q4 i expect $W to scam pump..
today it pumped 24% on the news with the partnership with Ripple / CRYPTOCAP:XRP
im waiting for a bottom around 3-4c to DCA in..
sell zone around 55-70c Q4
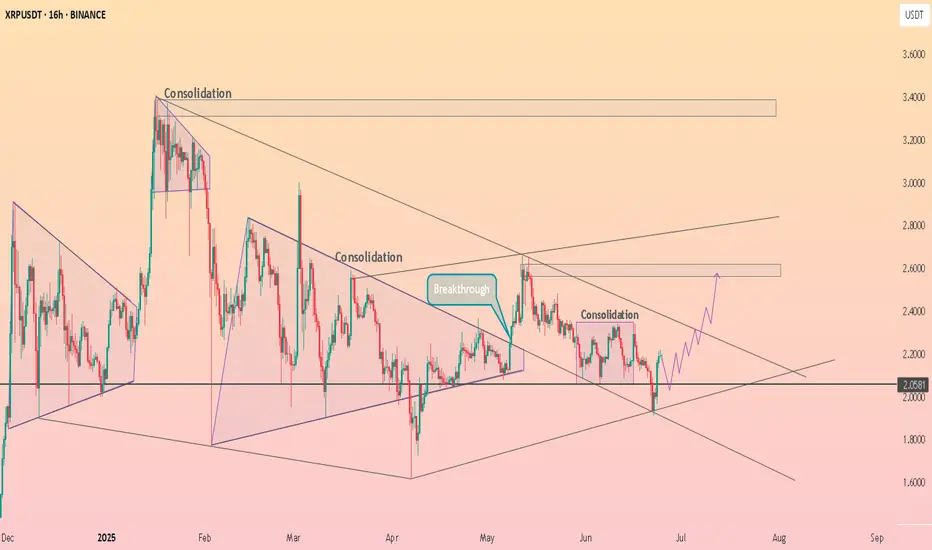
HolderStat┆XRPUSD held the supportBINANCE:XRPUSDT on the 16h chart is showing strength above $2.05 after breaking out from consolidation. The path is clear toward $2.30 and $2.60 as buyers regain control. The bullish pattern sequence continues to develop.