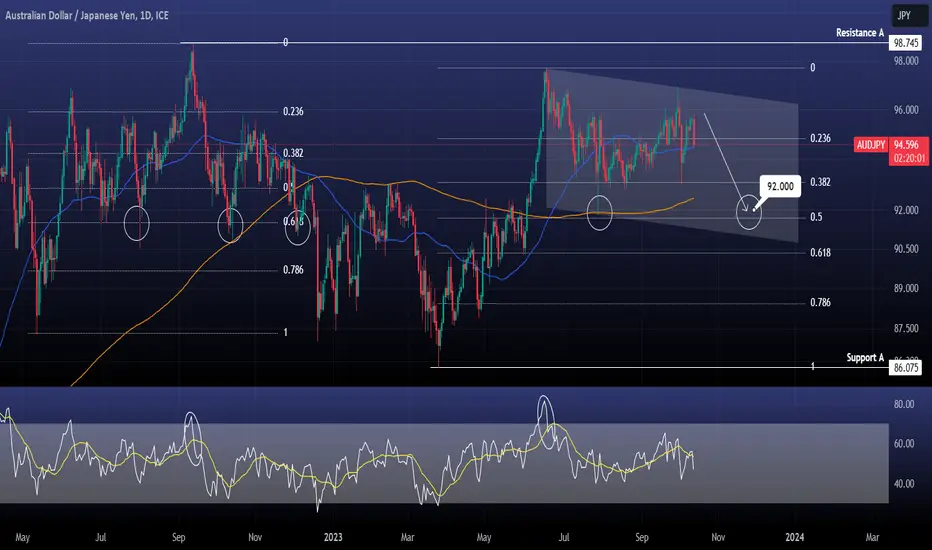
AUDJPY Sell pattern after Lower High rejection.The AUDJPY pair is testing the 1day MA50 today having formed Lower Highs since the June 19th peak.
If the 1day MA50 breaks, the MA200 should be put up for testing but it is more likely to test the July 28th Low as the same weak pattern did in 2022.
Sell and target 92.000 (over the 0.5 Fibonacci level).
Follow us, like the idea and leave a comment below!!
Japaneseyen
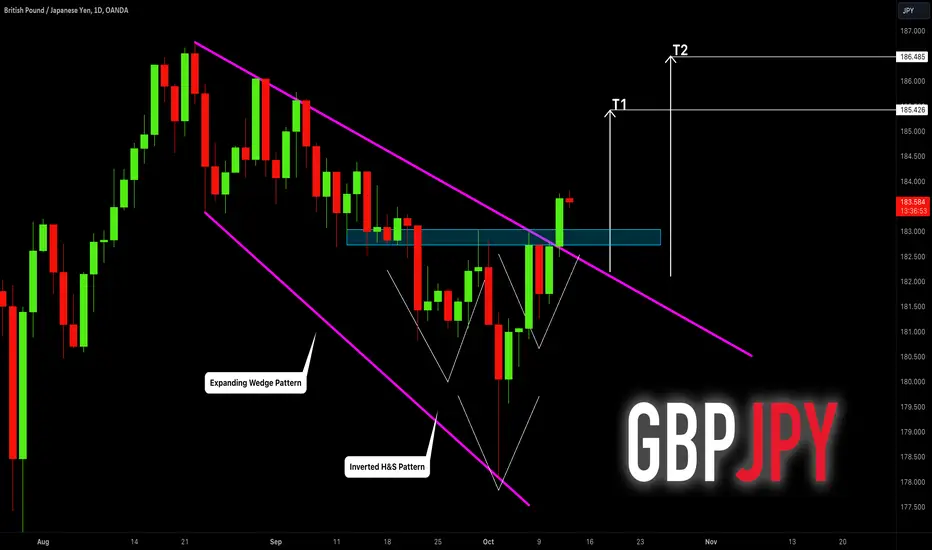
GBPJPY: Bullish Reversal Now Confirmed?! 🇬🇧🇺🇸
Take a look at GBPJPY.
I see strong signs of a bullish reversal on a daily time frame:
the price formed a huge inverted head and shoulders pattern,
a neckline of the pattern and a resistance line of an expanding wedge pattern
were successfully broken.
I anticipate a growth now.
Goals: 185.4 / 186.5
❤️Please, support my work with like, thank you!❤️
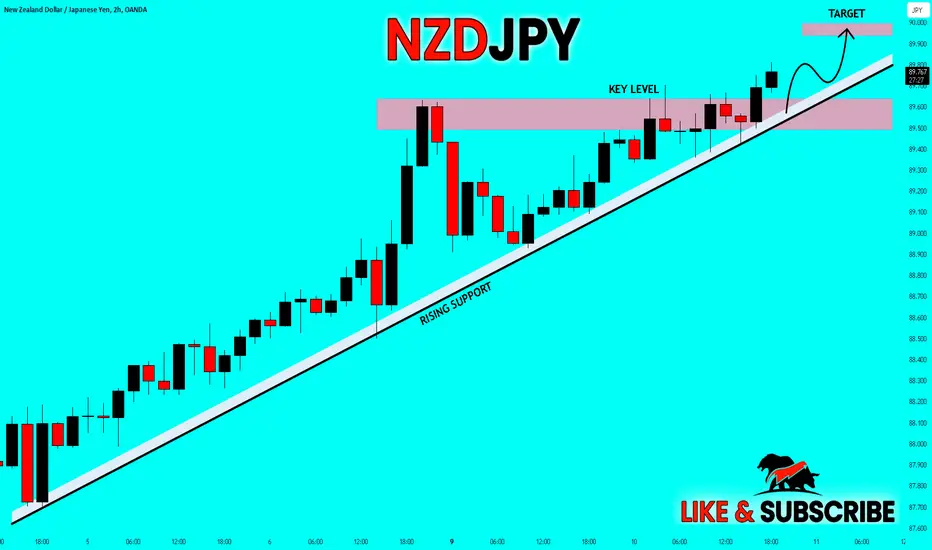
✅NZD_JPY GROWTH AHEAD|LONG🚀
✅NZD_JPY is trading in an
Uptrend long the rising
Support and the pair broke
The key horizontal level
Of 89.600 too which reinforces
Our bullish bias and I think that
We will see a further move up
LONG🚀
✅Like and subscribe to never miss a new idea!✅
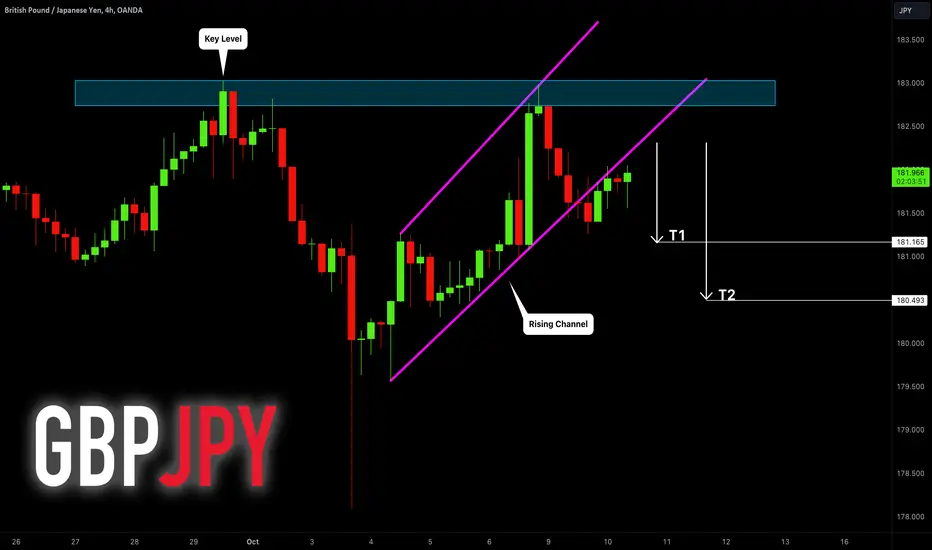
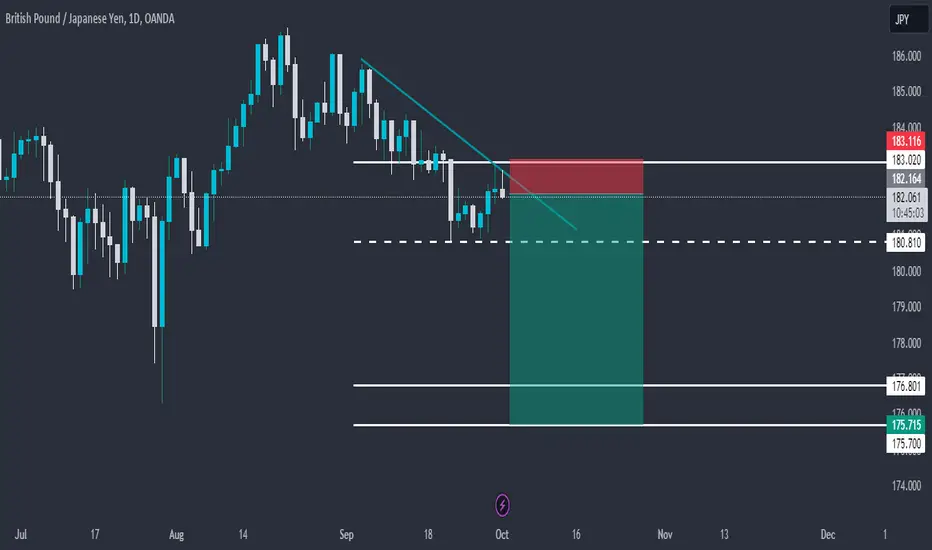
GBPJPY: Do You See a Bearish Pattern? 🇬🇧🇺🇸
After a test of a solid horizontal resistance, GBPJPY dropped
and violated a support line of a rising parallel channel.
To me, it is a strong bearish signal.
I would expect a bearish continuation at least to 181.16 level.
❤️Please, support my work with like, thank you!❤️
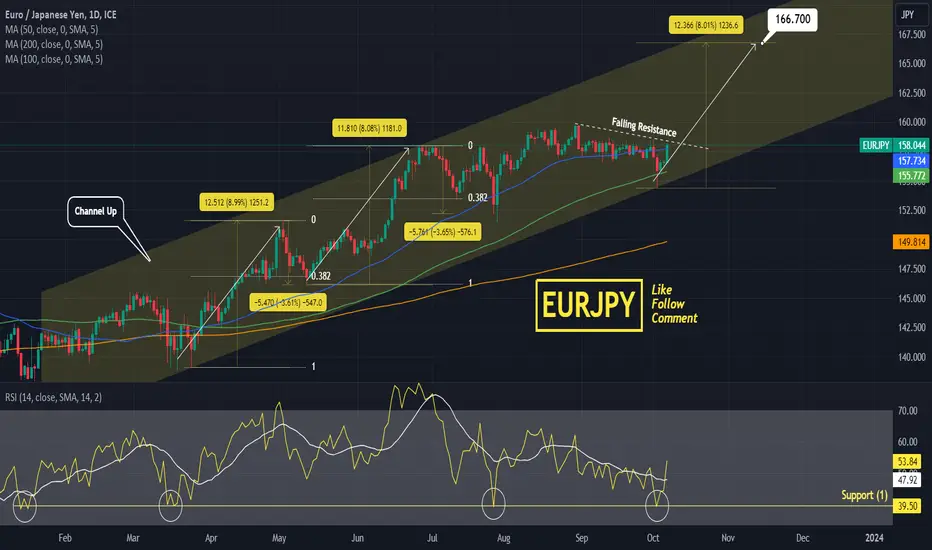
EURJPY Buy signal inside a strong Channel Up.EURJPY is trading inside a Channel Up starting from the beggining of the year.
The MA100 (1d) gave the necessary Support last week at the bottom of the Channel UP.
Trading Plan:
1. Buy once the price closes over the Falling Resistance.
Targets:
1. 166.700 (+8.00% rise as per the bullish leg prior).
Tips:
1. The RSI (1d) hit Support (1) and rebounded. This support level has priced the lows of July 27th, March 17th and January 17th.
Please like, follow and comment!!
Notes:
Past trading plan:
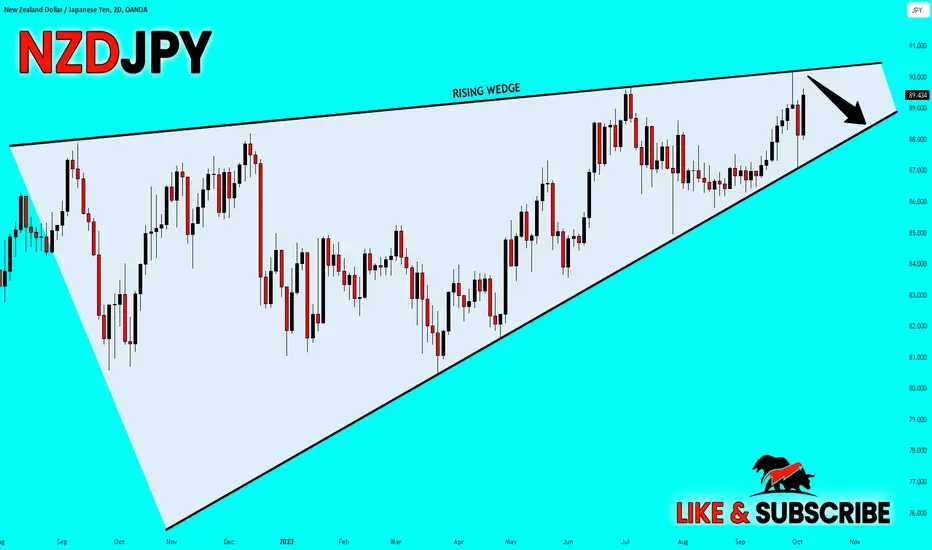
✅NZD_JPY SWING BEARISH PREDICTION🔥
✅NZD_JPY is trading in a
Massive rising wedge pattern
And the pair is now going up
To retest the rising resistance
Of the wedge from where
I think that we will see a
Pullback and a move down
To retest the rising support below
SHORT🔥
✅Like and subscribe to never miss a new idea!✅
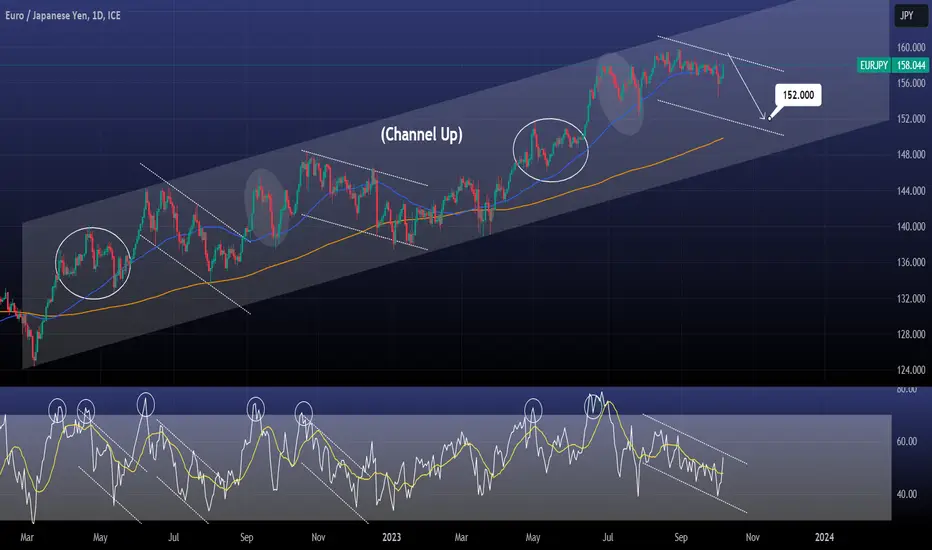
EURJPY 7month Channel Up looking for a correction.EURJPY is trading inside a Channel Up for the past 7 months, consolidating currently around the 1day MA50.
The Channel Down on the 1day RSI hints towards a possible price pull back, the same kind that took place in November-December and June-July 2022.
Both corrections touched the 1day MA200.
Sell and target 152.000 (projected contact with the 1day MA200).
Follow us, like the idea and leave a comment below!!
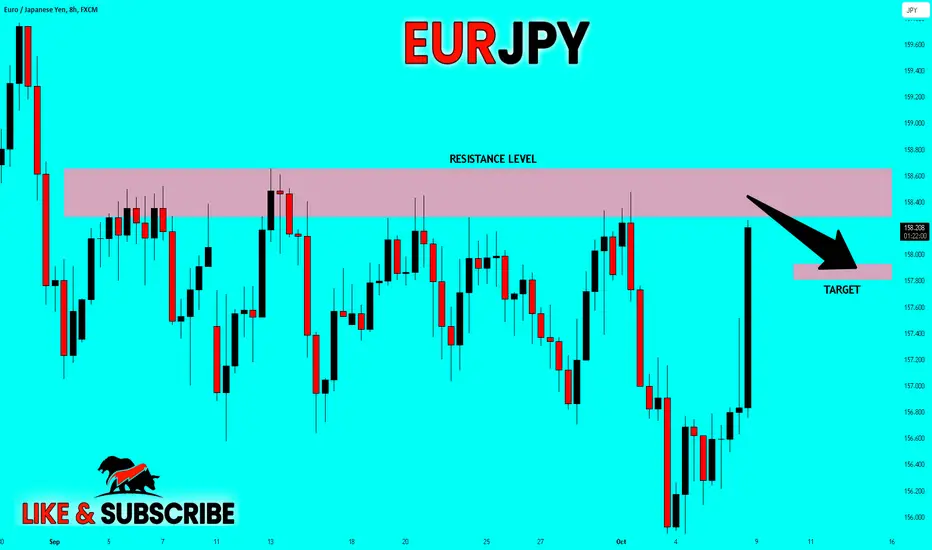
✅EUR_JPY SHORT FROM RESISTANCE🔥
✅EUR_JPY is going up now
But a strong resistance level is ahead at 158.548
Thus I am expecting a pullback
And a move down towards the target at 157.884
SHORT🔥
✅Like and subscribe to never miss a new idea!✅
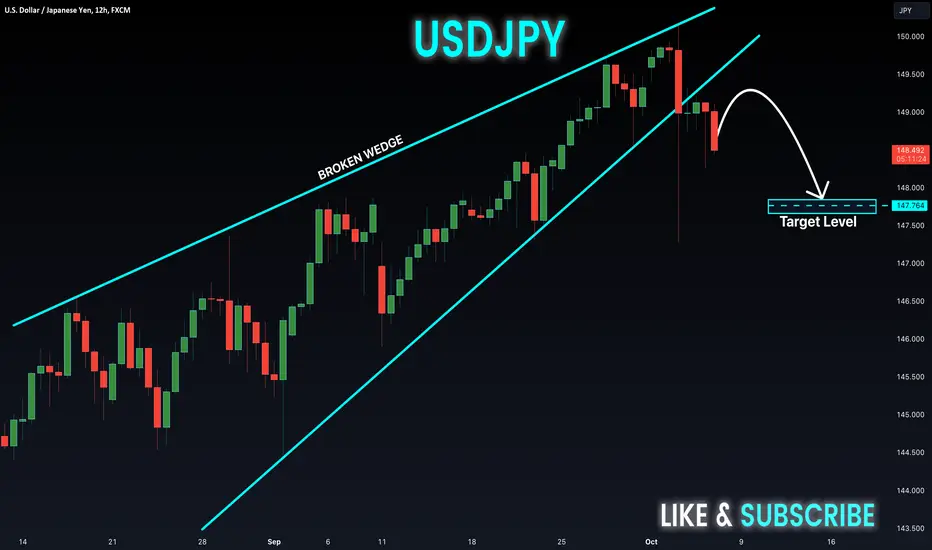
USDJPY - Bearish Rising Wedge 📉Hello Traders!
On Tuesday 3 Oct, The USDJPY Price Reached a Resistance Level (150.315 - 150.160).
-The Price Formed a Rising Wedge Pattern !
-The Support Line of The Wedge is Broken.
So, I Expect a Bearish Move📉
i'm waiting for retest...
-----------
TARGET: 146.630🎯
___________
if you agreed with this IDEA, please leave a LIKE, SUBSCRIBE or COMMENT!
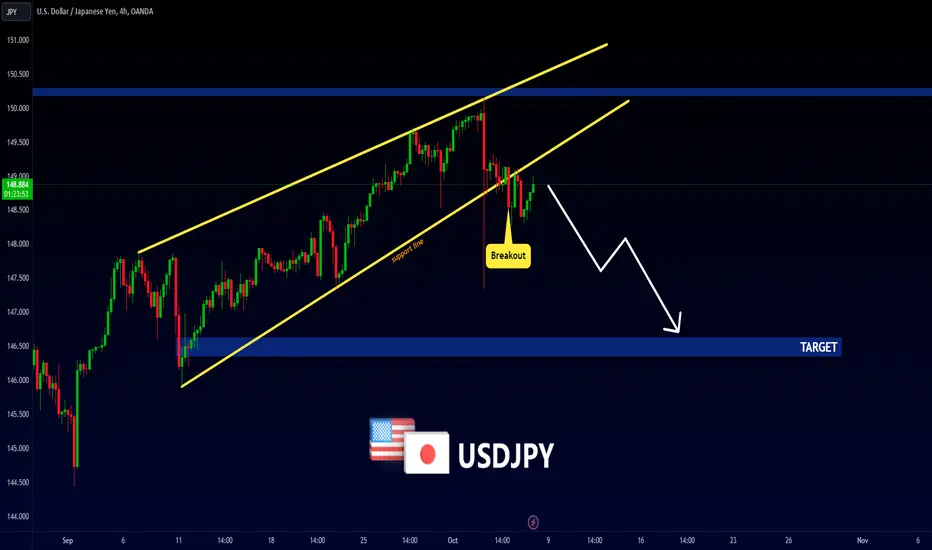
USD-JPY Bearish Bias! Sell!
Hello,Traders!
USD-JPY was trading in a
Narrowing rising wedge
But the a breakout happened
So we are now bearish biased
So I will be expecting a move down
Sell!
Like, comment and subscribe to help us grow!
Check out other forecasts below too!
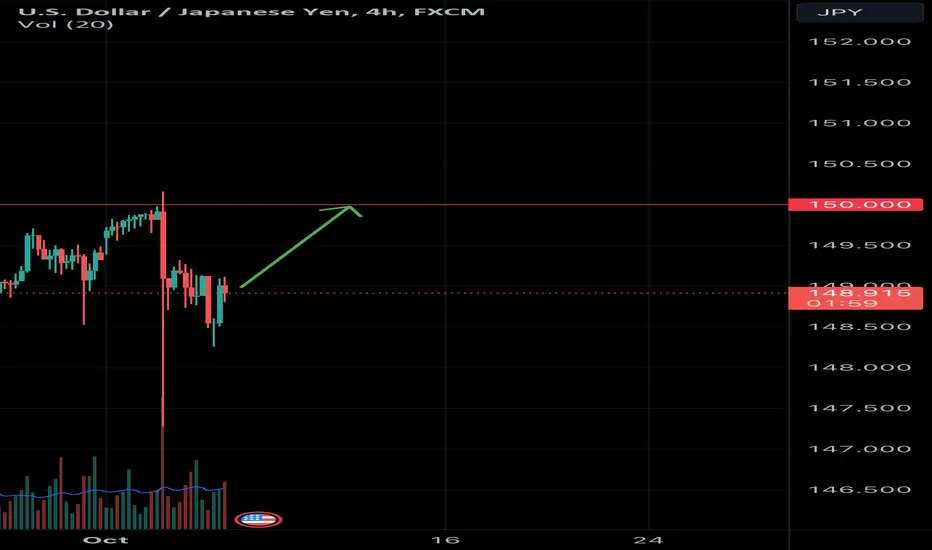
USDJPY to 150 by the end of the weekUSDJPY is going test 150 level again.
While dollar doing better, Probably usdjpy will go up.
Wait price to test 150 then get another review.
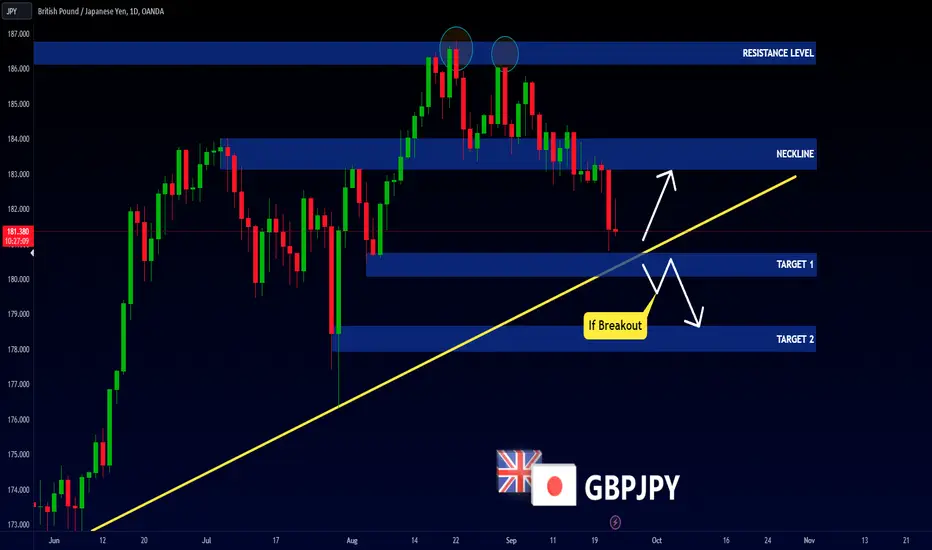
GBPJPY - Another Opportunity 📉
Hi Traders!
On Wednesday 16 The GBPJPY Price Reached A Monthly Resistance Level (186.098 - 186.805)
The Price Formed a Double Top Pattern.
The Neckline is Broken.
So, I Expect a Bearish Move📉
-----------
TARGET 1: 180.750🎯
TARGET 2: 178.700 (If the price breaks and closes Below Support Line)
___________
if you agreed with this IDEA, please leave a LIKE, SUBSCRIBE or COMMENT!
GBPJPY - BEARISH DOUBLE TOP PATTERN📉Hello Traders!
On Wednesday 16 The GBPJPY Price Reached A Monthly Resistance Level (186.098 - 186.805)
The Price Formed a Double Top Pattern.
The Neckline is Broken.
So, I Expect a Bearish Move📉
i'm waiting for retest...
-----------
TARGET 1: 180.750🎯
TARGET 2: 178.700🎯
___________
if you agreed with this IDEA, please leave a LIKE, SUBSCRIBE or COMMENT!

Yen Drops Below 150 Per Dollar - Exercise Caution in TradingThe Japanese yen has recently dropped below the critical threshold of 150 per dollar, primarily due to mounting concerns regarding intervention measures. In light of this situation, I strongly urge you to exercise caution and consider pausing yen trading until further clarification is obtained.
The sudden decline in the yen's value has raised concerns among market participants, as it suggests the possibility of intervention by the Japanese government or central bank. Intervention refers to deliberate actions taken by authorities to influence their currency's exchange rate, typically through buying or selling large amounts of their own currency in the foreign exchange market. Such interventions can have a profound impact on the currency's value and create significant volatility in the market.
Given the uncertainty surrounding the current situation, it is prudent to reassess our trading strategies and ensure that we are not unnecessarily exposed to potential risks. Therefore, I strongly recommend that you temporarily halt yen trading until we receive further guidance or clarification from reliable sources regarding any potential intervention measures.
In the meantime, I encourage you to closely monitor the latest news and market developments related to the yen. Stay informed about any official statements or actions from the Japanese government or central bank, as these can provide valuable insights into the future direction of the currency. Additionally, consider diversifying your portfolio to reduce reliance on yen-based assets until the situation stabilizes.
Please remember that our primary objective is to protect our investments and mitigate risk. By exercising caution and temporarily pausing yen trading, we can better position ourselves to navigate the current market uncertainties and make informed decisions when clarity emerges.
If you have any questions or require further guidance, please do not hesitate to reach out to me or our dedicated support team. We are here to assist you and ensure that you have the necessary information to make well-informed trading decisions.

AUD/JPY: Bullish Trend Pauses for a Pullback-- 30-Minute Chart
The AUD/JPY pair is currently trading in a narrow range on the 30-minute chart. The pair is facing resistance at the 94.20 level and support at the 94.00 level.
The RSI indicator is currently in overbought territory, suggesting that the pair may be due for a pullback. However, the MACD indicator is still generating bullish signals.
-- 4-Hour Chart
The AUD/JPY pair is currently trading in a bullish trend on the 4-hour chart. The pair is facing resistance at the 94.50 level and support at the 94.00 level.
The RSI indicator is currently in overbought territory, suggesting that the pair may be due for a pullback. However, the MACD indicator is still generating bullish signals.
-- Daily Chart
The AUD/JPY pair is currently trading in a bullish trend on the daily chart. The pair is facing resistance at the 95.00 level and support at the 94.00 level.
The RSI indicator is currently in overbought territory, suggesting that the pair may be due for a pullback. However, the MACD indicator is still generating bullish signals.
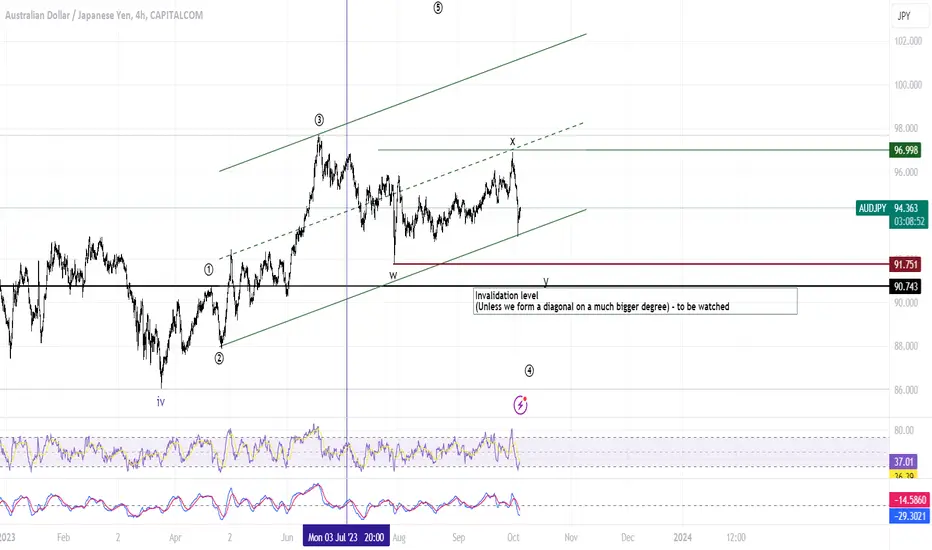
Elliott Wave Analysis
Based on Elliott Wave Theory, as marked on my chart, the AUD/JPY pair may be in the process of completing a five-wave upward Elliott wave pattern. If this is the case, the pair could experience a significant pullback in the near future.
AUD/JPY Fundamental and Technical Analysis for 4 October 2023 (30-min, 4-h, and Daily Charts)
Fundamental Analysis
The Australian dollar (AUD) is a commodity currency, meaning that its value is closely linked to the prices of commodities such as iron ore and coal. The Japanese yen (JPY) is a safe-haven currency, meaning that it tends to appreciate in value during times of market turmoil.
The AUD/JPY currency pair is often seen as a proxy for risk appetite. When investors are feeling optimistic about the global economy, they tend to buy the AUD/JPY pair. When investors are feeling cautious, they tend to sell the AUD/JPY pair.
Technical Analysis
30-Minute Chart
The AUD/JPY pair is currently trading in a narrow range on the 30-minute chart. The pair is facing resistance at the 94.20 level and support at the 94.00 level.
The RSI indicator is currently in overbought territory, suggesting that the pair may be due for a pullback. However, the MACD indicator is still generating bullish signals.
4-Hour Chart
The AUD/JPY pair is currently trading in a bullish trend on the 4-hour chart. The pair is facing resistance at the 94.50 level and support at the 94.00 level.
The RSI indicator is currently in overbought territory, suggesting that the pair may be due for a pullback. However, the MACD indicator is still generating bullish signals.
Daily Chart
The AUD/JPY pair is currently trading in a bullish trend on the daily chart. The pair is facing resistance at the 95.00 level and support at the 94.00 level.
The RSI indicator is currently in overbought territory, suggesting that the pair may be due for a pullback. However, the MACD indicator is still generating bullish signals.
Elliott Wave Analysis
Based on Elliott Wave Theory, the AUD/JPY pair may be in the process of completing a five-wave upward Elliott wave pattern. If this is the case, the pair could experience a significant pullback in the near future.
Conclusion
Overall, the AUD/JPY pair is in a bullish trend on all three timeframes. However, the RSI indicator is currently in overbought territory on all three timeframes, suggesting that the pair may be due for a pullback.
Traders should watch the key support and resistance levels mentioned above carefully. A break above the 94.50 level on the 4-hour chart would confirm the continuation of the bullish trend. A break below the 94.00 level on the 4-hour chart would suggest a pullback is underway.
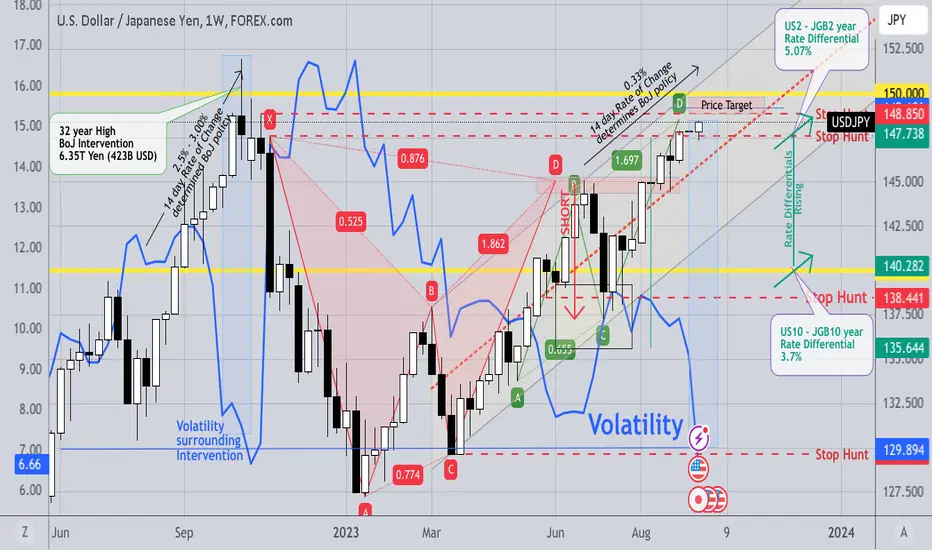
USDJPY; Zen and the art of economic cycle maintenanceThe Yen and thus, the Bank of Japan, is in a rather precarious position.
(Then again, when was the last time they weren't - in a precarious position?? ... .)
Admittedly, our Japanese is somewhat rusty lately but nowhere in the monetary manual did we find where it says: "Lending rates must be fixed at <0% or >10%, at all times!"
So, when the BoJ hangs it's hat on some arbitrary metric, such as the volatility in the USDJPY in this case, to guide it's policy and a potential departure from the negative interest rates (more so than based on the underlying economic data - CPI, PPI, unemployment, etc.) and then said volatility collapses, almost immediately?! ... One could only speculate on the complex range of emotions, induced in the BoJ's leadership (WTF?!, etc.). So,now what? ...
These previously unlikely turn of events suddenly provide a strong bias towards a (top-side) volatility spike, in the event of which a forced monetary intervention by the BoJ in the very near future becomes a virtually foregone conclusion!
On an additional note; Given the current US-Japanese rate differentials (as well as other factors) the USDJPY remains the least "over valued" among all the Yen crosses - making it a less than ideal such metric. Try on the CHFJPY or even the EURJPY as an exercise in absurd over valuation, for example. The likes of which have solid, almost identical, precedents in the late 1970 European central bank policies, most ending "in tears" and none more than Switzerland's SNB's, which slid into one of it's deepest depressions by the beginning of the 1980s!
This weeks technical picture (including Fridays close) further underlines this, by now much shifted, bias toward a top-side break out, potentially pushing prices well past the key 150.00 level, rather quickly. (E.g., certainly do Not be short the USDJPY, here! - To say the least.)
Current Rate Differentials between the Bank of Japan and ...
--------------------------------------------------------------------------------
- in Basis Points - ("most over valued" ranking)
- CHFJPY (Switerland) --- +250 - (#1)
- SKJPY (Sweden) --- +375
- AUDJPY (Australia) --- +400
- NOKJPY (Norway) --- +400
- EURJPY (EU) --- +450 - (#5)
- CADJPY (Canada) --- +475
- GBPJPY (G. Britain) --- +515
- NZDJPY (N Zealand) --- +525
- USDJPY (US) --- +525
- MXNJPY (Mexico) --- +11.25 - (#4)
- ZARJPY (S. Africa) --- +11.75 - (#2)
- HUFJPY (Hungary) --- +13.00 - (#3)
---------------------------------------------------------------------
p.s. This here is also the new Yen Thread!/b]
WOW USDJPY! What The Hell is Going On?! 🇺🇸🇯🇵
Important update for USDJPY.
Multiple time frame analysis.
Price action.
Trading recommendations.
Thoughts.
❤️Please, support this video with like and comment!❤️

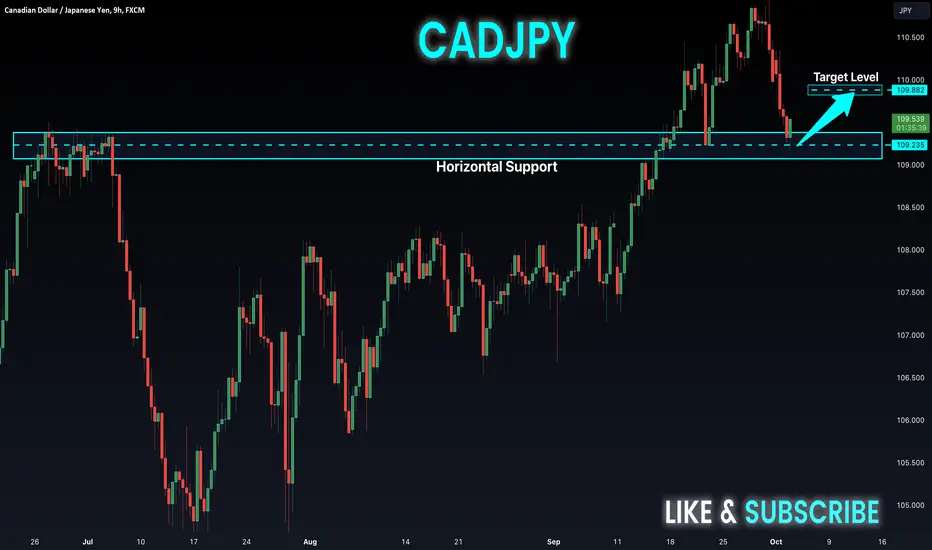
CAD-JPY Potential Rebound! Buy!
Hello,Traders!
CAD-JPY was making a
Local correction but then
The pair hit a horizontal
Support of 109.235
And we are already seeing
A bullish reaction so I think
That we will see further growth
Buy!
Like, comment and subscribe to help us grow!
Check out other forecasts below too!
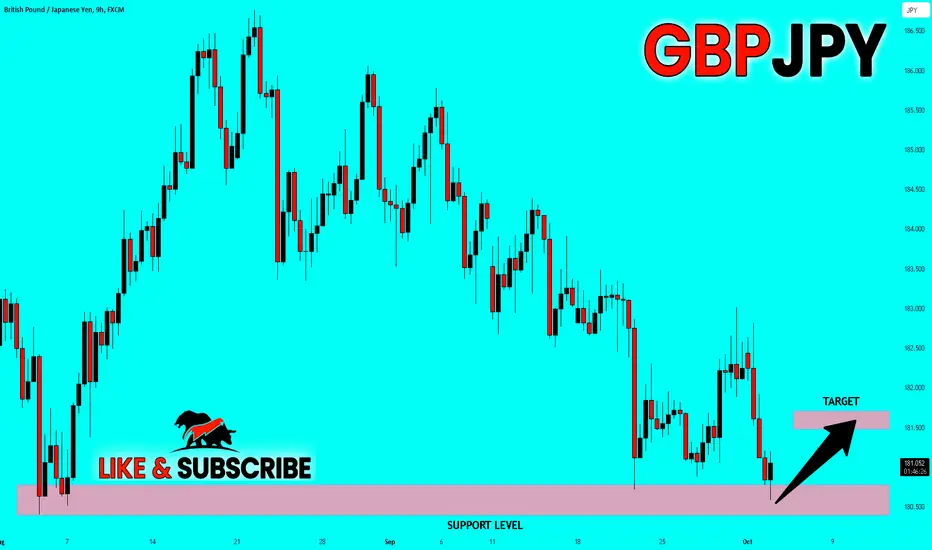
✅GBP_JPY LOCAL LONG🚀
✅GBP_JPY went down to retest a horizontal support of 180.500
Which makes me locally bullish biased
And I think that a move up
From the level is to be expected
Towards the target above at 181.500
LONG🚀
✅Like and subscribe to never miss a new idea!✅
———————————————————————————————
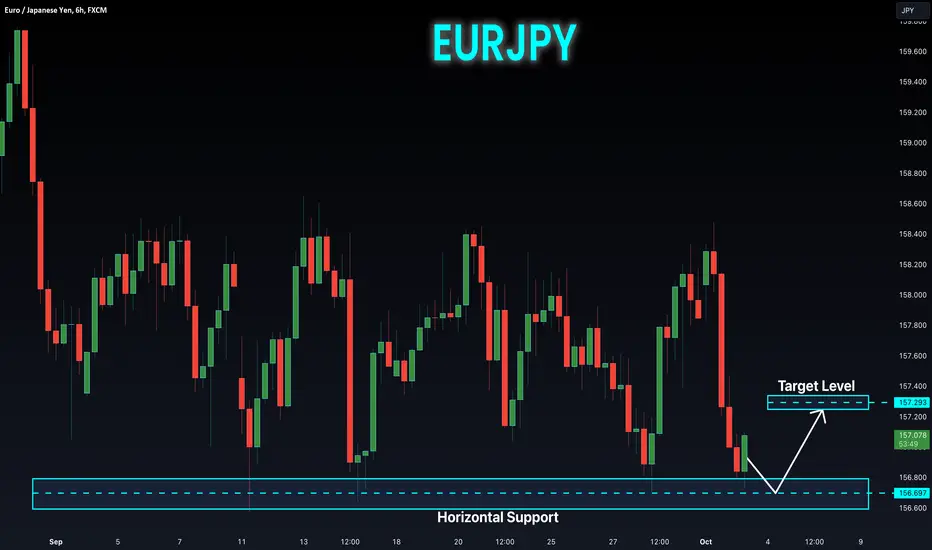
EUR-JPY Long From Support! Buy!
Hello,Traders!
EUR-JPY fell down to
Retest the horizontal
Support of 156.668
And we are already
Seeing a local bullish
Reaction so I think that
The pair will go up
Buy!
Like, comment and subscribe to help us grow!
Check out other forecasts below too!
GBPJPY Bears in Sight as Japan Mulls Currency Intervention
Bearish GBPJPY as Japan's key economic ministers warn of currency intervention
Japan's key economic ministers have warned of currency market intervention, keeping investors wary of a further sell-off in the yen and weighing on the GBPJPY exchange rate.
The yen has weakened sharply against the dollar in recent months, hitting its weakest level in nearly a year on Monday. This has been driven by a number of factors, including the Bank of Japan's commitment to ultra-low interest rates, while the US Federal Reserve has been raising rates aggressively.
The recent warning from Japanese ministers has raised the prospect of further intervention to weaken the yen. This would be bad news for the GBPJPY exchange rate, as it would make Japanese exports more competitive and make British imports more expensive.
As of October 10, 2023, GBPJPY is trading at 182. If Japanese authorities do intervene to weaken the yen, this could push GBPJPY down towards 175 or even lower.
Traders should be cautious of long positions in GBPJPY in the near term, as the risk of intervention is high.
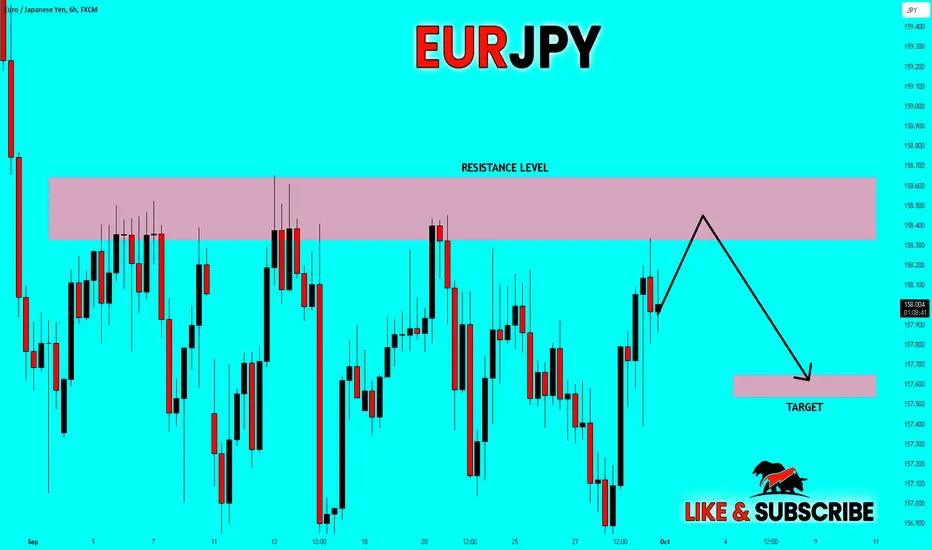
✅EUR_JPY SHORT FROM RESISTANCE🔥
✅EUR_JPY went up to retest a horizontal resistance level of 158.500
Which makes me locally bearish biased
And I think that a move down
From the level is to be expected
Towards the target below at 157.631
SHORT🔥
✅Like and subscribe to never miss a new idea!✅
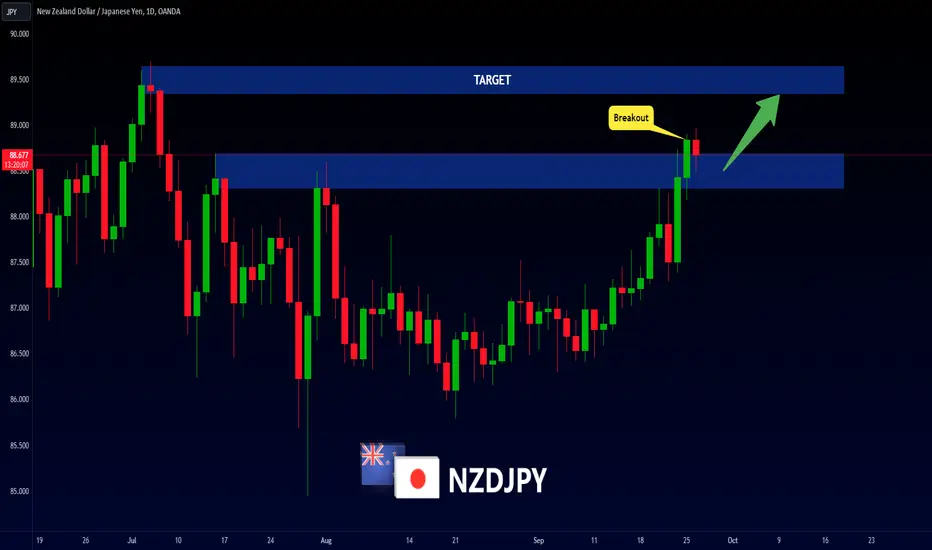
NZDJPY - New Breakout 📈Hello Traders!
On The Daily Time Frame, The NZDJPY Broke a Strong Resistance Level (88.310-88.693)
Currently, This Resistance Level Becomes New Support Level.
So, I Expect a Bullish Move📈
i'm waiting for retest...
-----------
TARGET: 89.350🎯
___________
if you agreed with this IDEA, please leave a LIKE, SUBSCRIBE or COMMENT!