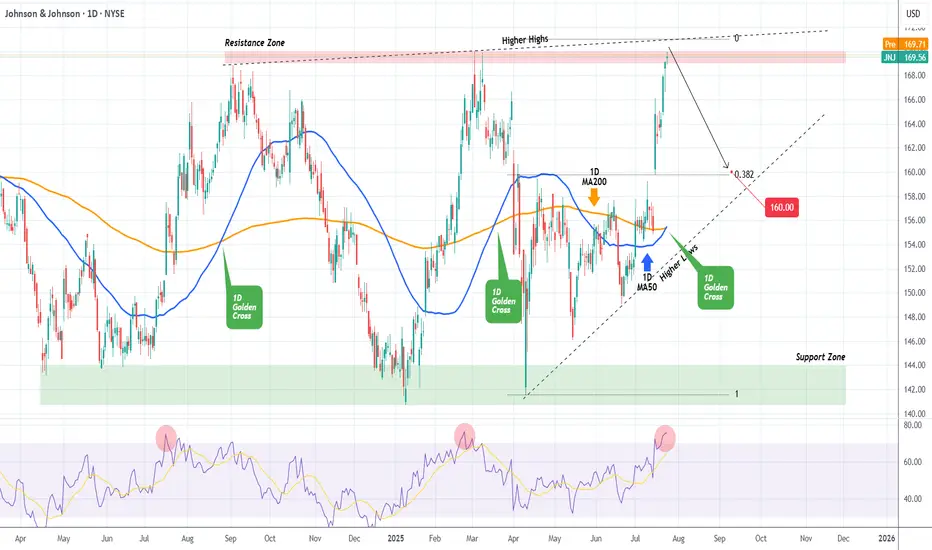
JOHNSON & JOHNSON Sell opportunity on a Double Resistance.It's been 9 months (October 11 2024, see chart below) since our last Johnson & Johnson (JNJ) analysis, where we gave a very timely sell signal that surgically hit our $141.00 Target:
The Channel Down has since broke to the upside and a new Higher Lows structure has emerged but with a clear Resistance Zone for the time being. At the same time, the price is also just below the Higher Highs trend-line that started on the September 04 2024 High.
With the 1D RSI overbought (same as on February 25 2025), we don't give the upside much room to go, so we turn bearish here, targeting the 0.382 Fibonacci extension and Higher Lows trend-line at $160.00.
-------------------------------------------------------------------------------
** Please LIKE 👍, FOLLOW ✅, SHARE 🙌 and COMMENT ✍ if you enjoy this idea! Also share your ideas and charts in the comments section below! This is best way to keep it relevant, support us, keep the content here free and allow the idea to reach as many people as possible. **
-------------------------------------------------------------------------------
💸💸💸💸💸💸
👇 👇 👇 👇 👇 👇
Jnjsignals
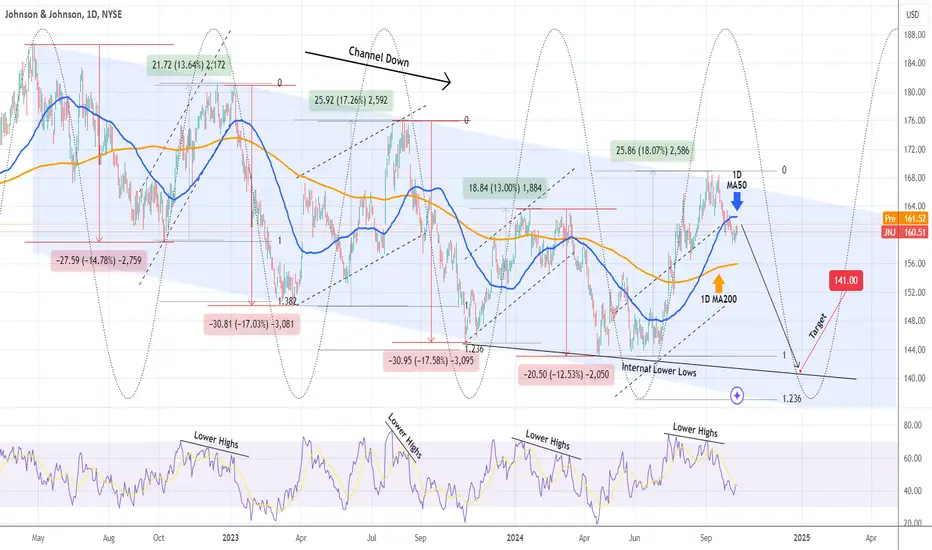
JOHNSON & JOHNSON Excellent confirmed sell signalJohnson & Johnson (JNJ) gave us the most optimal buy entry on our last call (April 17, see chart below) and easily hit our 157.50 Target:
Having been rejected early in September exactly at the top (Lower Highs trend-line) of the 2-year Channel Down and now establishing price action below its 1D MA50 (blue trend-line), this is a confirmed sell signal and the start of the Channel's 5th Bearish Leg. The RSI Lower Highs are common on all previous Channel tops.
Our Target is 141.00, which is on the Internal Lower Lows trend-line (formed by the last 2 Lower Lows) and still above the 1.236 Fibonacci extension.
-------------------------------------------------------------------------------
** Please LIKE 👍, FOLLOW ✅, SHARE 🙌 and COMMENT ✍ if you enjoy this idea! Also share your ideas and charts in the comments section below! This is best way to keep it relevant, support us, keep the content here free and allow the idea to reach as many people as possible. **
-------------------------------------------------------------------------------
💸💸💸💸💸💸
👇 👇 👇 👇 👇 👇
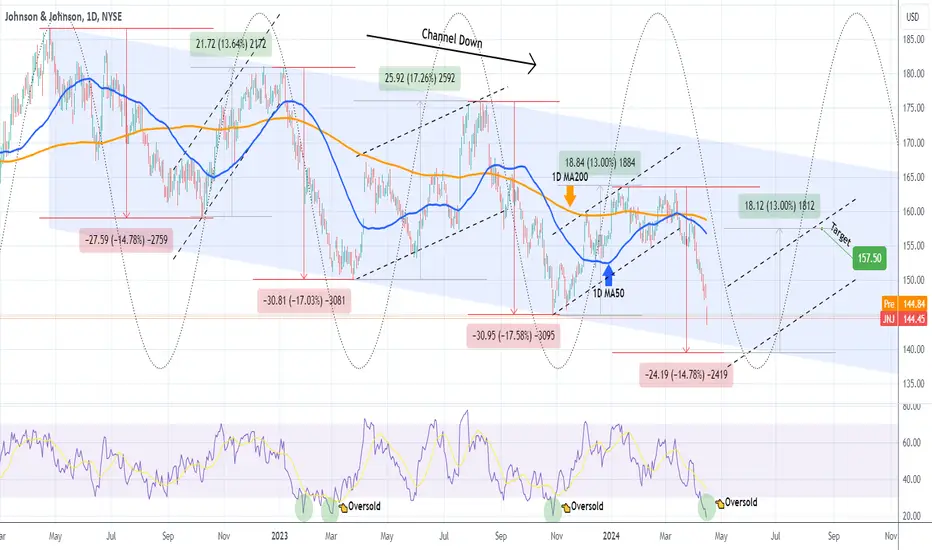
JOHNSON & JOHNSON Time to start buying.Johnson & Johnson (JNJ) quickly hit the $147.00 Target that we set on our very recent sell call (April 03, see chart below) and is now approaching the bottom of the massive 2-year Channel Down:
Even though based on the very reliable and consistent Sine Waves, the bottom might be a process that can take up to 2-months, the stock is low enough for medium-term investors to start considering adding buys.
On top of that, the 1D RSI is highly oversold below 20.00, the lowest it has been in more than 4 years (since February 28 2020)! As a result and since the Bearish Legs of this Channel Down have ranged within -14.78% and -17.58%, we are turning bullish on this stock, targeting $157.50 (minimum +13.00% rise as with January 22 2024 High).
-------------------------------------------------------------------------------
** Please LIKE 👍, FOLLOW ✅, SHARE 🙌 and COMMENT ✍ if you enjoy this idea! Also share your ideas and charts in the comments section below! This is best way to keep it relevant, support us, keep the content here free and allow the idea to reach as many people as possible. **
-------------------------------------------------------------------------------
💸💸💸💸💸💸
👇 👇 👇 👇 👇 👇
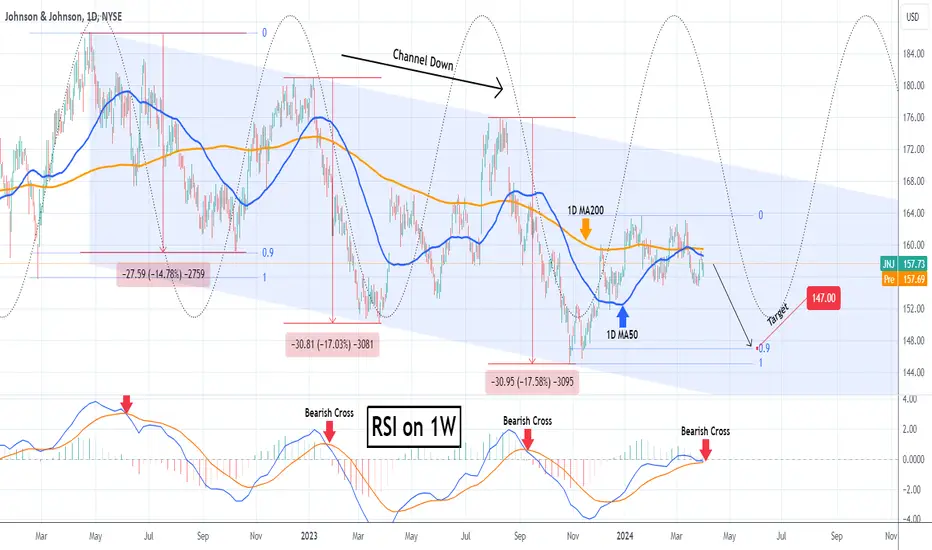
JOHNSON & JOHNSON More pain along the way. SELL.Johnson & Johnson (JNJ) got rejected on its 1D MA200 (orange trend-line) - 1D MA50 (blue trend-line) Resistance Zone. It has been practically trading sideways since the start of the year and based on the Sine Waves, that priced the new Top (Lower Highs trend-line) of the 2-year Channel Down pattern.
The expected completion of a Bearish Cross this week on the 1W RSI, will confirm the Sell Signal, as all 3 previous Bearish Cross sequences were forme just after a Top. Though their declines ranged from -17.58% to -14.78%, we will use the October 10 2022 Low as an example and target the 0.9 Fibonacci retracement level at 147.00 as since the Bullish Leg was limited, we expect an equally less aggressive Bearish Leg towards the bottom of the Sine Waves.
-------------------------------------------------------------------------------
** Please LIKE 👍, FOLLOW ✅, SHARE 🙌 and COMMENT ✍ if you enjoy this idea! Also share your ideas and charts in the comments section below! This is best way to keep it relevant, support us, keep the content here free and allow the idea to reach as many people as possible. **
-------------------------------------------------------------------------------
💸💸💸💸💸💸
👇 👇 👇 👇 👇 👇
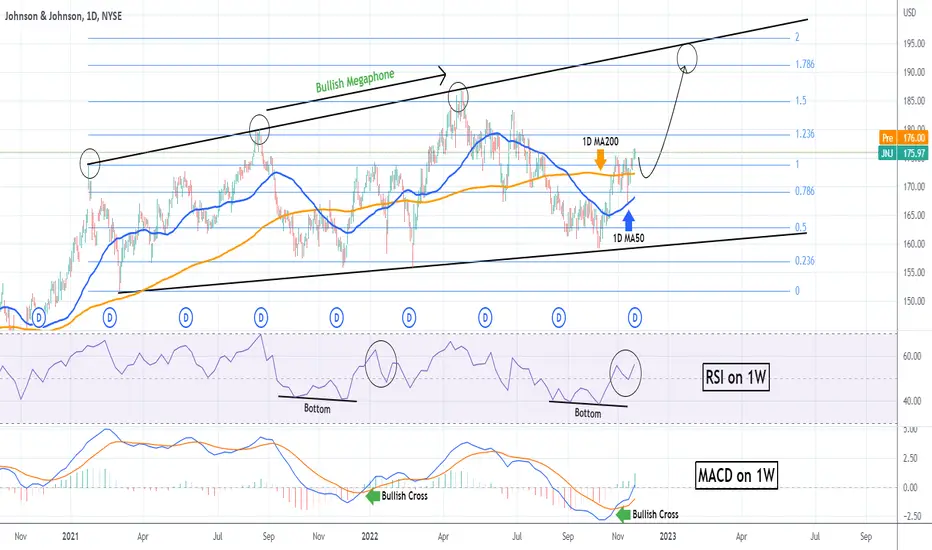
JOHNSON & JOHNSON Can reach $190 by FebruaryJohnson & Johnson (JNJ) has been trading within a long-term Bullish Megaphone pattern since the January 26 2021 High. The pattern has been having very structured Higher Highs and Higher Lows.
At the moment the stock is on a bullish leg, after rebounding exactly on the 1D MA50 (blue trend-line) on November 11 and is also above the 1D MA200 (orange trend-line). The 1W MACD is on a Bullish Cross and the 1W RSI rebounded off a Lower Lows (Double) Bottom formation. The exact same sequence was last seem early this year on January. After one last pull-back, the stock then rallied to the top (Higher Highs trend-line) of the Bullish Megaphone.
The Higher Highs seem to be following the 1.236 - 1.5 - 1.786 Fibonacci sequence and so do the Lows (0.236 - 0.5 - 0.786). The 1.786 Fib extension is a little over $190.00 and that is our current long target on JNJ.
-------------------------------------------------------------------------------
** Please LIKE 👍, SUBSCRIBE ✅, SHARE 🙌 and COMMENT ✍ if you enjoy this idea! Also share your ideas and charts in the comments section below! This is best way to keep it relevant, support me, keep the content here free and allow the idea to reach as many people as possible. **
-------------------------------------------------------------------------------
You may also TELL ME 🙋♀️🙋♂️ in the comments section which symbol you want me to analyze next and on which time-frame. The one with the most posts will be published tomorrow! 👏🎁
-------------------------------------------------------------------------------
👇 👇 👇 👇 👇 👇
💸💸💸💸💸💸
👇 👇 👇 👇 👇 👇