Analysis for the CPI News
Good Morning Traders,
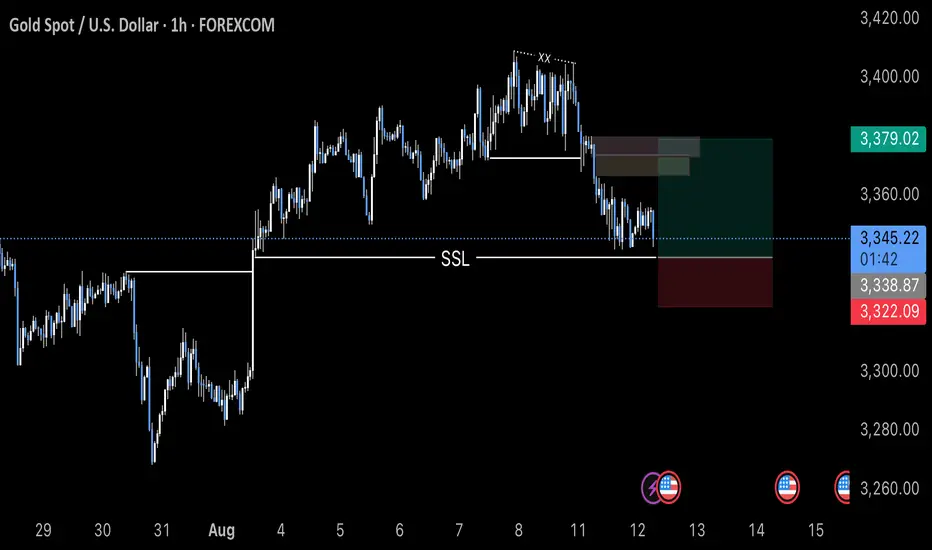
Here is my analysis for the CPI News, as you seen the waterfall of gold, price has filled the FVG according to the D1 time frame, there is SSL, the price can hit the SSL and can fly during the news impact, here is our trade entry, Stop loss and Target.
Good Luck Mates!!
Jointelegram
GBPUSD – DAILY FORECAST Q3 | W32 | D4 | Y25📊 GBPUSD – DAILY FORECAST
Q3 | W32 | D4 | Y25
Daily Forecast 🔍📅
Here’s a short diagnosis of the current chart setup 🧠📈
Higher time frame order blocks have been identified — these are our patient points of interest 🎯🧭.
It’s crucial to wait for a confirmed break of structure 🧱✅ before forming a directional bias.
This keeps us disciplined and aligned with what price action is truly telling us.
📈 Risk Management Protocols
🔑 Core principles:
Max 1% risk per trade
Only execute at pre-identified levels
Use alerts, not emotion
Stick to your RR plan — minimum 1:2
🧠 You’re not paid for how many trades you take, you’re paid for how well you manage risk.
🧠 Weekly FRGNT Insight
"Trade what the market gives, not what your ego wants."
Stay mechanical. Stay focused. Let the probabilities work.
FX:GBPUSD

BEST XAUUSD M30 BUY AND SELL SETUP FOR TODAY Gold has shown a strong bullish push, breaking above recent consolidation and approaching a key resistance zone around $3,376. ⚔️ This area will be decisive — if price holds above it and confirms support, we could see a further rally toward $3,404. 📈✨ However, failure to sustain above this level could trigger a bearish rejection, pulling the market back toward the $3,330–$3,340 range. 📉🔄 Traders should wait for clear price action confirmation before entering. React, don’t predict! 🎯🧠

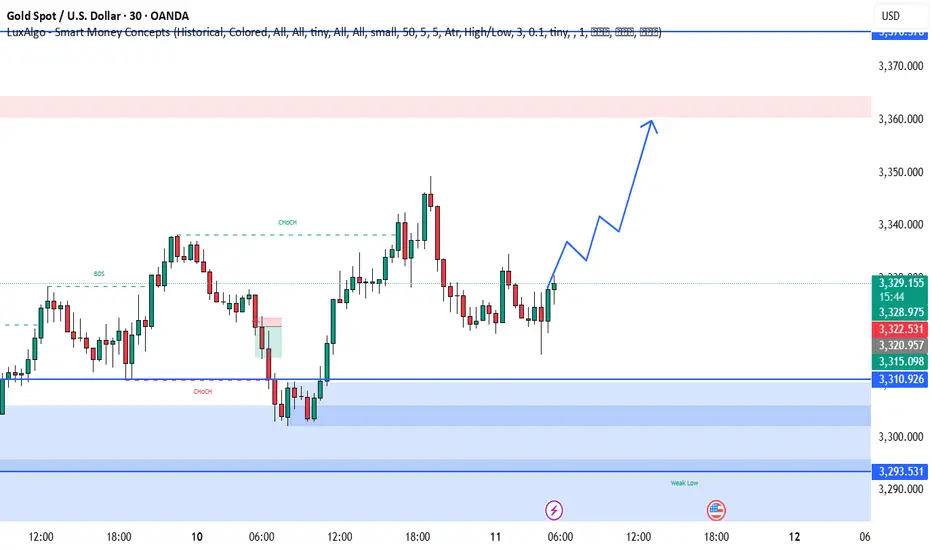
BEST XAUUSD M30 BUY SETUP FOR TODAYPrice is showing signs of bullish strength after reclaiming key demand zones near 3,310.926–3,315.098 🟦. The recent CHoCH (Change of Character) and strong bullish reaction from the demand block suggests a potential move toward the 3,360 resistance area 🔼. Buyers are likely stepping in with momentum, aiming for a break above previous highs 📉➡️📈. As long as price stays above the 3,315 support, the bullish scenario remains valid — watch for continuation toward higher highs. 🚀💹
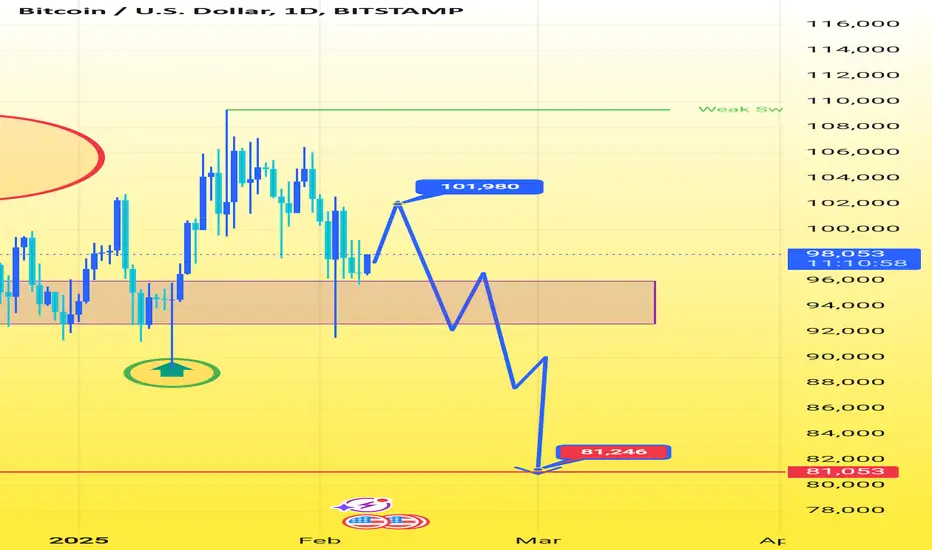
BTC/USD Trap to bullish Trend Still This chart shows *Bitcoin (BTC/USD)* on a daily time frame with a *bullish* outlook.
- *Current price*: 97,924
- *Target 1*: 101,980
- *Support level*: Around *81,053*
The price has recently made a correction from the highs, and there's a potential for a *bounce back* towards *101,980*. The support zone around *81,053* suggests a possible area for a reversal if the price drops. Traders should be cautious of any potential downside movement towards this level, but the overall trend appears to be *bullish* towards the target.
*Key points*:
- *Resistance* around 101,980
- *Strong support* near 81,053
- *Bullish scenario* in the short term
This setup suggests a potential price rise back towards *101,980*, with key support at *81,053* in case of a downturn. Always consider proper risk management and stay updated with market movements.
EUR/USD TRADE SETUPwe are looking market droped since 2021 year, so now we are look soon bulish Momentum will be coming.

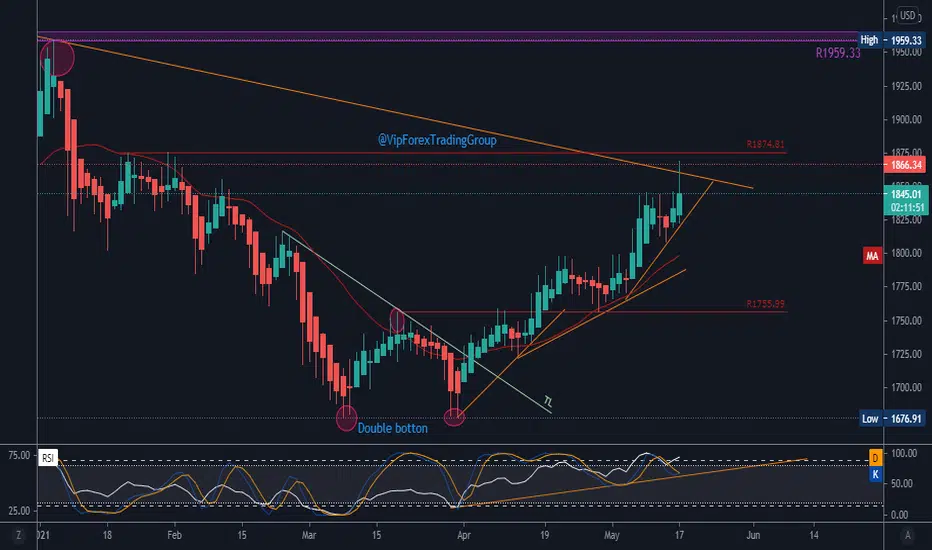
Double bottom - GOLD will break 1874 to 1960 ?As we can see on Daily Chart , double top get to 1676.91 then double bottom which lunched gold from 1680 to 1868, almost 200usd per ounce in 1 month and half
We`ll see if breaks 1874 to continue to 1960 area.
Please like ,follow and comment.
Thanks.
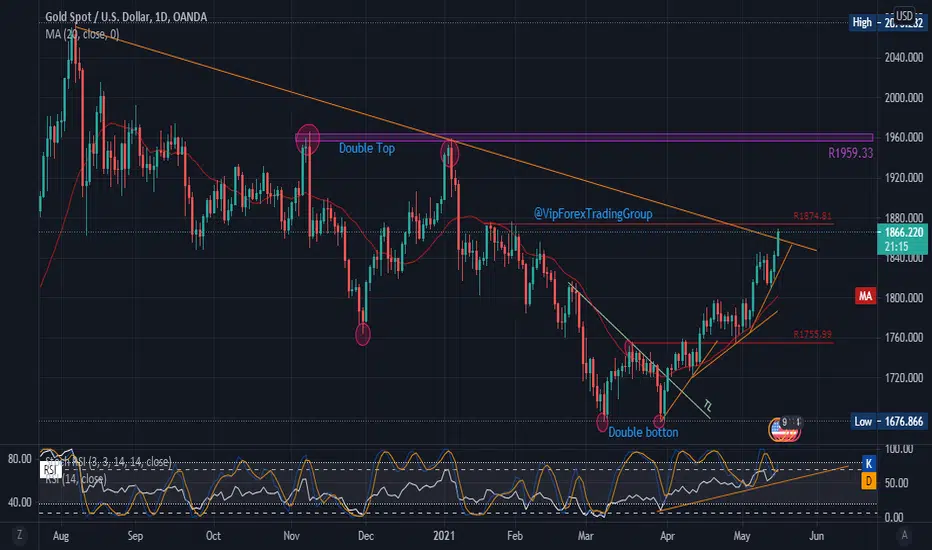
Double botton - GOLD will break 1874 to 1960 ?
As we can see on Daily Chart, double top get to 1676.91 then double botton which lunched gold from 1680 to 1868, almost 200usd per ounce in 1 month and half
We`ll see if breaks 1874 to continue to 1960 area.
Please like ,follow and comment.
Thanks.