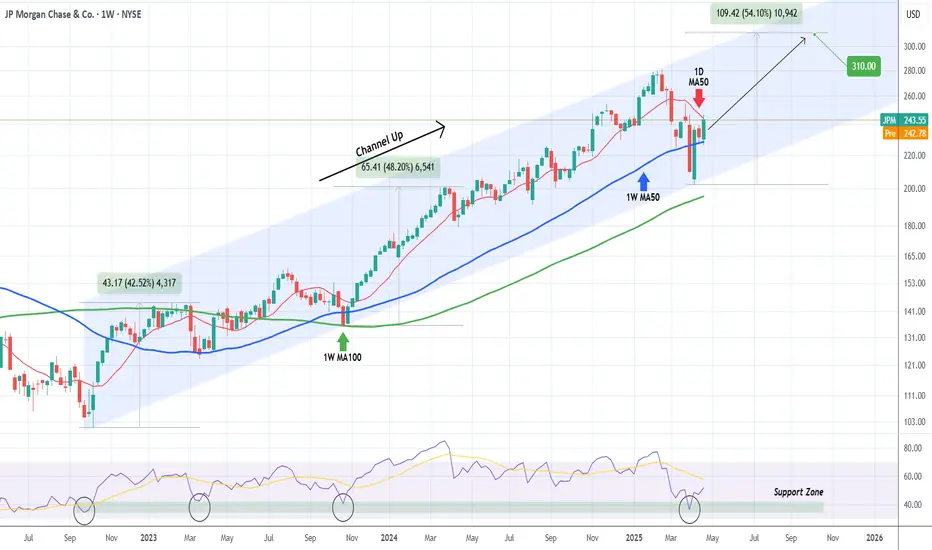
JP MORGAN's long-term bullish trend restored above the 1D MA50.JP Morgan Chase (JPM) broke above its 1D MA50 (red trend-line) last week for the first time since the first week of March and technically put an official end to the 3-month 'Trade War' correction.
This correction has technically been the Bearish Leg of the 2.5-year Channel Up. Every time the 1D MA50 broke and closed a 1W candle above it, the stock started the new Bullish Leg of the pattern. The last Bullish Leg was +6% (+48% against +42%) stronger than the previous one before the first pull-back to the 1D MA50 again.
As a result, we expect to see $310 (+54%) before this year is over.
-------------------------------------------------------------------------------
** Please LIKE 👍, FOLLOW ✅, SHARE 🙌 and COMMENT ✍ if you enjoy this idea! Also share your ideas and charts in the comments section below! This is best way to keep it relevant, support us, keep the content here free and allow the idea to reach as many people as possible. **
-------------------------------------------------------------------------------
💸💸💸💸💸💸
👇 👇 👇 👇 👇 👇
Jpmsignals
JP MORGAN won't give a better buy opportunity in 2025.Last time we looked at JP Morgan Chase (JPM) on November 27 2024 (see chart below), it gave us a clear sell signal that went straight to our $236 Target:
Now that the price rebounded not only on the 1D MA200 (orange trend-line) but also on the bottom (Higher Lows trend-line) of the long-term Channel Up, we are switching back to buying a we even got the first pull-back on the 1D MA50 (blue trend-line).
Given that the 1D RSI also rebounded from oversold (<30.00) territory like the October 27 2023 Low did, we expect a similar Bullish Leg to follow and thus our Target is $330 at the top of the Channel Up.
-------------------------------------------------------------------------------
** Please LIKE 👍, FOLLOW ✅, SHARE 🙌 and COMMENT ✍ if you enjoy this idea! Also share your ideas and charts in the comments section below! This is best way to keep it relevant, support us, keep the content here free and allow the idea to reach as many people as possible. **
-------------------------------------------------------------------------------
💸💸💸💸💸💸
👇 👇 👇 👇 👇 👇

JP MORGAN -15% correction very likely.JP Morgan Chase (JPM) has been trading within a Channel Up since the October 12 2022 market bottom. Friday's high is technically at the top (Higher Highs trend-line) of that Channel Up. The 1D RSI sequence is similar to the one that led March 06 2023 High and subsequent correction.
As you can see, every Higher High rejection (two so far on that pattern) has corrected by around -15%. As a result, we expect a minimum pull-back, below the 1D MA50 (blue trend-line) and towards the 1D MA200 (orange trend-line) of -14.77%, giving us a target of 173.00. That would be exactly on the 0.382 Fibonacci retracement level of the last Higher Low of the Channel Up, similar to March 23 2023.
-------------------------------------------------------------------------------
** Please LIKE 👍, FOLLOW ✅, SHARE 🙌 and COMMENT ✍ if you enjoy this idea! Also share your ideas and charts in the comments section below! This is best way to keep it relevant, support us, keep the content here free and allow the idea to reach as many people as possible. **
-------------------------------------------------------------------------------
💸💸💸💸💸💸
👇 👇 👇 👇 👇 👇

JP MORGAN Approaching the ideal sell level.JP Morgan Chase (JPM) has been trading within a Channel Up pattern since the October 12 2022 market bottom. Currently it is on a relentless rally since the October 27 2023 Higher Low, which is technically the Bullish Leg towards the Channel's top and new Higher High.
The peak points of the previous two main Bullish Legs of the Channel Up, took place when the 1D RSI formed Lower Highs against the price's Higher Highs, which is a technical Bearish Divergence. Since the price is currently so close to the top of the Channel Up, we will wait for the RSI to form that Lower High sequence and enter a confirmed sell. Our target will be 163.00, which is a projected contact with the 1D MA50 (blue trend-line) and the 0.382 Fibonacci Channel level, which has always been reached during Bearish Legs.
-------------------------------------------------------------------------------
** Please LIKE 👍, FOLLOW ✅, SHARE 🙌 and COMMENT ✍ if you enjoy this idea! Also share your ideas and charts in the comments section below! This is best way to keep it relevant, support us, keep the content here free and allow the idea to reach as many people as possible. **
-------------------------------------------------------------------------------
💸💸💸💸💸💸
👇 👇 👇 👇 👇 👇

JP MORGAN Ahead of a Golden Cross. Strong bullish signal!JP Morgan Chase & Co. (JPM) has basically turned sideways since November 11 (despite the marginal November 25 Higher High) putting a pause to the enormous 1-month rally since the October 12 bottom.
The big news on this chart is that the 1D MA50 (blue trend-line) is about to cross above the 1D MA200 (orange trend-line) to form the infamous pattern of the Golden Cross on the 1D time-frame. This is technically very bullish and in fact the last time we saw this formation was on November 13 2020, almost 2 years ago!
As with today, the price was again just below the 0.5 Fibonacci retracement level, just a few days before the Golden Cross formation and after it was completed, started one of the strongest rallies in recent times, making a new All Time High on January 12 2021, essentially just 2 months after.
Now obviously that was the era of 'cheap money', when the Fed printed trillions of USD in a very short period of time to support the economy during the COVID lockdowns. We can't expect the stock to rally as fast and as aggressively but still, as long as the Golden Cross is formed and the 1D MA50 supports, we can target one Fibonacci level at a time.
Notice how similar the 2020 COVID recovery is with the 2022 (today) one. The 1W MA200 is in a symmetrical place, the 1D RSI was pulling back on the same fractal and the 1W MACD rebounded on the same level.
-------------------------------------------------------------------------------
** Please LIKE 👍, SUBSCRIBE ✅, SHARE 🙌 and COMMENT ✍ if you enjoy this idea! Also share your ideas and charts in the comments section below! This is best way to keep it relevant, support me, keep the content here free and allow the idea to reach as many people as possible. **
-------------------------------------------------------------------------------
You may also TELL ME 🙋♀️🙋♂️ in the comments section which symbol you want me to analyze next and on which time-frame. The one with the most posts will be published tomorrow! 👏🎁
-------------------------------------------------------------------------------
💸💸💸💸💸💸
👇 👇 👇 👇 👇 👇
