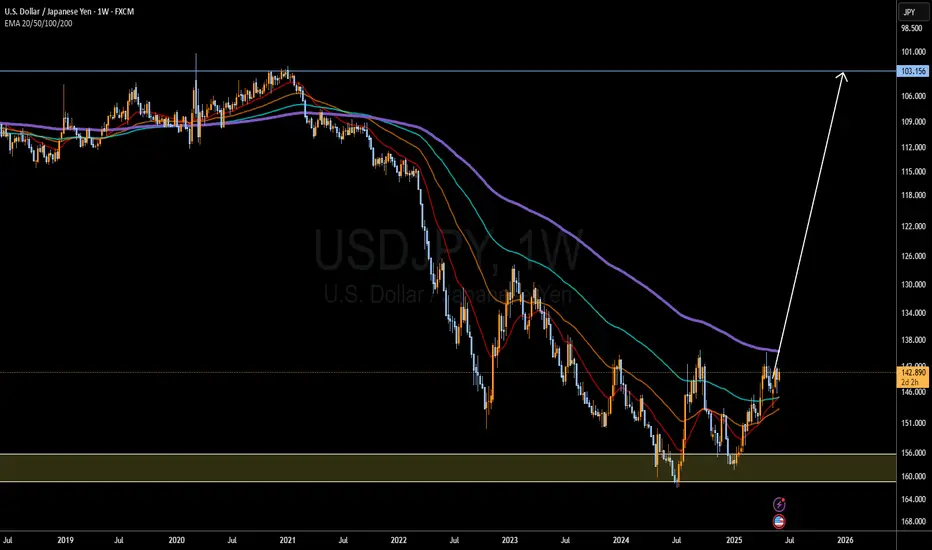
Japanese Yen to Da Moon!I compared the yen to every single currency pair and USDJPY is the most volatile. BOJ will raise interest rates to 0.75%-1% by late 2025/early 2026. And IF the FED chooses to lower rates that will further exacerbate Yen strength.
103.156 TP, but TBH I see price breaking well past that point and yen will make new all time highs. The dollar will get desecrated across all currencies, the yen will destroy it the hardest. Most likely BTC will also peak around this same time period and youll see and end to the bull cycle and we will enter BTC bear cycle but that is beside the point.
Potential Black Swan Event: the US enters into a recessionary environment, while I dont think this is likely bc everyone is saying that, it will be possible if we see a further escalation in the Ukraine conflict or if the US chooses to enter war with Iran. War is the only situation I see potential US recession.
I predicted then yen would get dusted during COVID, now I predict yen will make never seen before gains for the next 5 years minimum. Let's see how this plays out.
Jpy
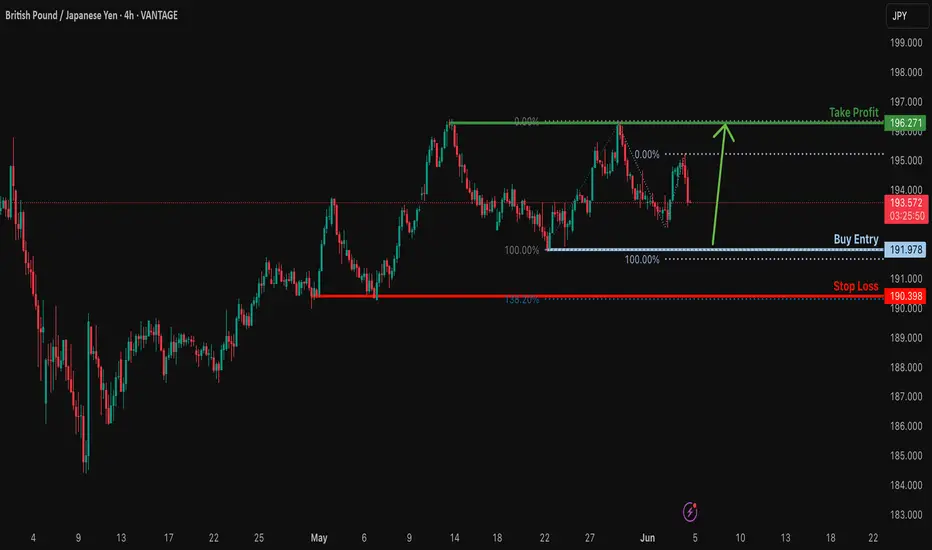
Bullish bounce?GBP/JPY is falling towards the support level which is a pullback support that is slightly above the 100% Fibonacci projection and could bounce from this level to our take profit.
Entry: 191.97
Why we like it:
There is a pullback support level that is slightly above the 100% Fibonacci projection.
Stop loss: 190.39
Why we like it:
There is a pullback support level that lines up with the 138.2% Fibonacci extension.
Take profit: 196.27
Why we like it:
There is a pullback resistance level.
Enjoying your TradingView experience? Review us!
Please be advised that the information presented on TradingView is provided to Vantage (‘Vantage Global Limited’, ‘we’) by a third-party provider (‘Everest Fortune Group’). Please be reminded that you are solely responsible for the trading decisions on your account. There is a very high degree of risk involved in trading. Any information and/or content is intended entirely for research, educational and informational purposes only and does not constitute investment or consultation advice or investment strategy. The information is not tailored to the investment needs of any specific person and therefore does not involve a consideration of any of the investment objectives, financial situation or needs of any viewer that may receive it. Kindly also note that past performance is not a reliable indicator of future results. Actual results may differ materially from those anticipated in forward-looking or past performance statements. We assume no liability as to the accuracy or completeness of any of the information and/or content provided herein and the Company cannot be held responsible for any omission, mistake nor for any loss or damage including without limitation to any loss of profit which may arise from reliance on any information supplied by Everest Fortune Group.
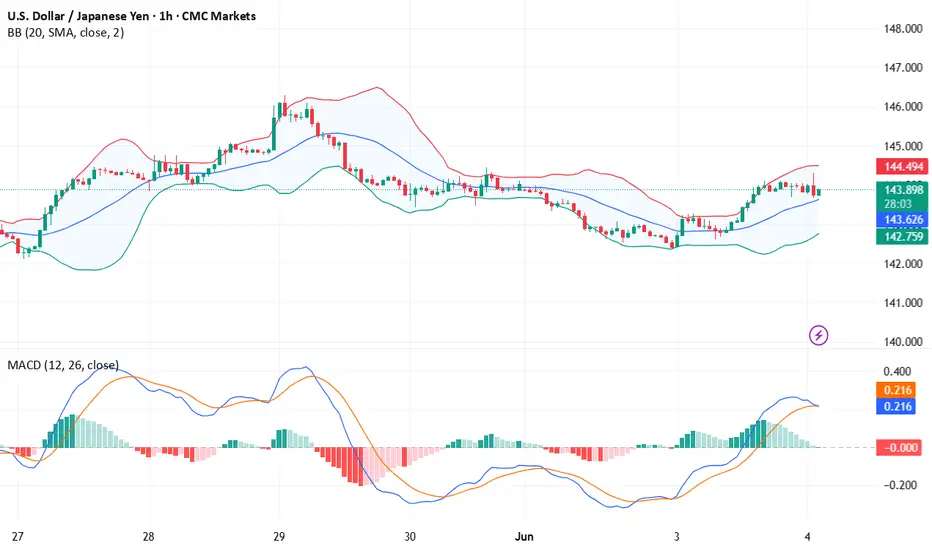
USD/JPY(20250604)Today's AnalysisMarket news:
Fed Logan: We should focus on achieving the 2% inflation target rather than trying to make up for past inflation shortfalls; Bostic: We still think there may be a rate cut this year.
Technical analysis:
Today's buying and selling boundaries:
143.47
Support and resistance levels:
145.19
144.55
144.13
142.81
142.39
141.75
Trading strategy:
If the price breaks through 144.13, consider buying in, with the first target price of 144.55
If the price breaks through 143.47, consider selling in, with the first target price of 142.81
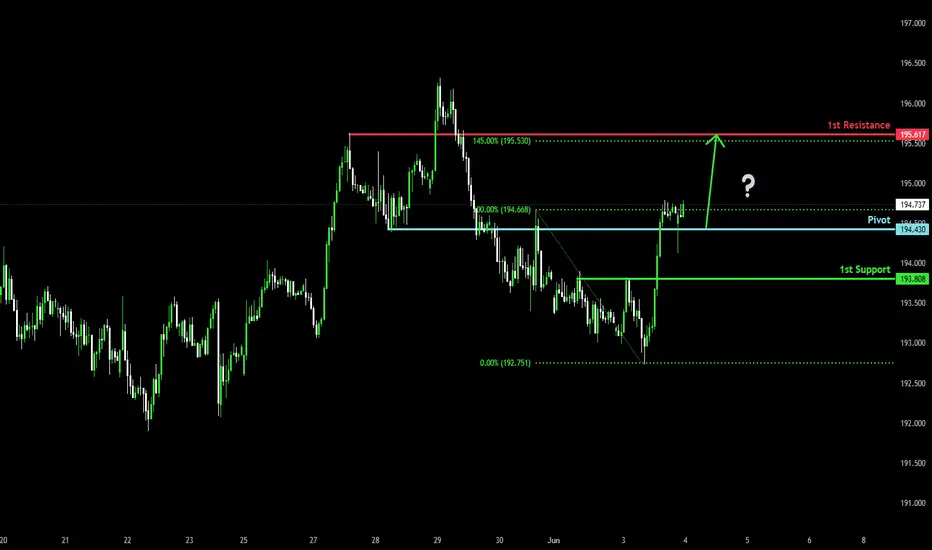
Potential bullish rise?GBP/JPY has reacted off the pivot and could rise to the 145% Fibonacci resistance.
Pivot: 194.43
1st Support: 193.80
1st Resistance: 195.61
Risk Warning:
Trading Forex and CFDs carries a high level of risk to your capital and you should only trade with money you can afford to lose. Trading Forex and CFDs may not be suitable for all investors, so please ensure that you fully understand the risks involved and seek independent advice if necessary.
Disclaimer:
The above opinions given constitute general market commentary, and do not constitute the opinion or advice of IC Markets or any form of personal or investment advice.
Any opinions, news, research, analyses, prices, other information, or links to third-party sites contained on this website are provided on an "as-is" basis, are intended only to be informative, is not an advice nor a recommendation, nor research, or a record of our trading prices, or an offer of, or solicitation for a transaction in any financial instrument and thus should not be treated as such. The information provided does not involve any specific investment objectives, financial situation and needs of any specific person who may receive it. Please be aware, that past performance is not a reliable indicator of future performance and/or results. Past Performance or Forward-looking scenarios based upon the reasonable beliefs of the third-party provider are not a guarantee of future performance. Actual results may differ materially from those anticipated in forward-looking or past performance statements. IC Markets makes no representation or warranty and assumes no liability as to the accuracy or completeness of the information provided, nor any loss arising from any investment based on a recommendation, forecast or any information supplied by any third-party.
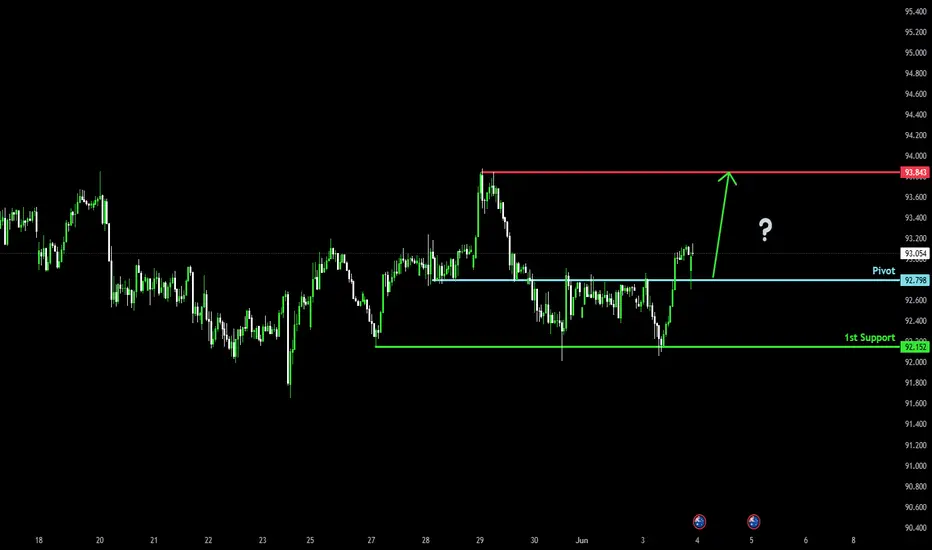
Bullish bounce?AUD/JPY has bounced off the pivot and could rise to the 1st resistance.
Pivot: 92.79
1st Support: 92.15
1st Resistance: 93.84
Risk Warning:
Trading Forex and CFDs carries a high level of risk to your capital and you should only trade with money you can afford to lose. Trading Forex and CFDs may not be suitable for all investors, so please ensure that you fully understand the risks involved and seek independent advice if necessary.
Disclaimer:
The above opinions given constitute general market commentary, and do not constitute the opinion or advice of IC Markets or any form of personal or investment advice.
Any opinions, news, research, analyses, prices, other information, or links to third-party sites contained on this website are provided on an "as-is" basis, are intended only to be informative, is not an advice nor a recommendation, nor research, or a record of our trading prices, or an offer of, or solicitation for a transaction in any financial instrument and thus should not be treated as such. The information provided does not involve any specific investment objectives, financial situation and needs of any specific person who may receive it. Please be aware, that past performance is not a reliable indicator of future performance and/or results. Past Performance or Forward-looking scenarios based upon the reasonable beliefs of the third-party provider are not a guarantee of future performance. Actual results may differ materially from those anticipated in forward-looking or past performance statements. IC Markets makes no representation or warranty and assumes no liability as to the accuracy or completeness of the information provided, nor any loss arising from any investment based on a recommendation, forecast or any information supplied by any third-party.
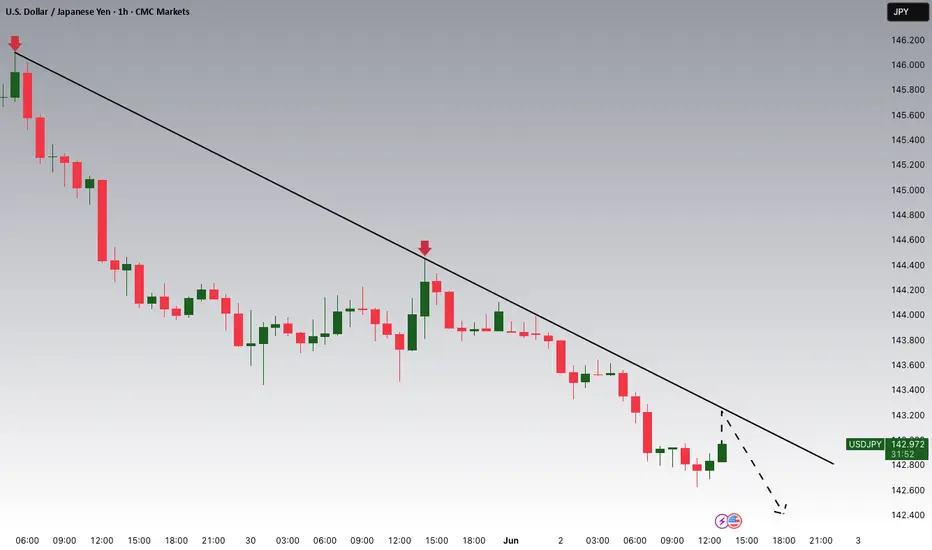
USDJPY Potential DownsidesHey Traders, in today's trading session we are monitoring USDJPY for a selling opportunity around 143.200 zone, USDJPY is trading in a downtrend and currently is in a correction phase in which it is approaching the trend at 143.200 support and resistance area.
Trade safe, Joe.
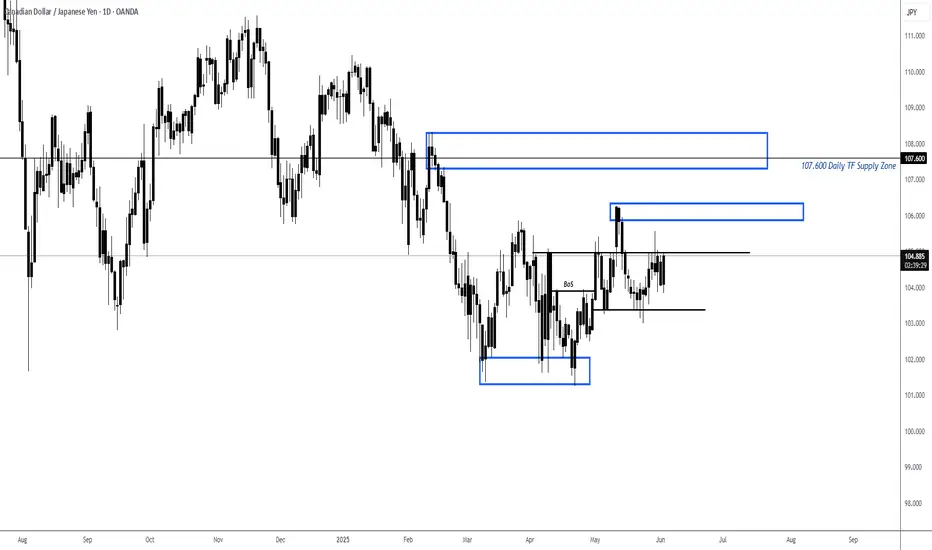
CADJPY LongPrice recently broke structure to the upside (BoS), confirming a bullish shift in momentum after forming a double bottom around the 101.50–102.00 region.
Currently, price is consolidating beneath the 104.90–105.00 resistance area, with a clear lower timeframe supply zone just above. If bulls sustain pressure, we could see a short-term rally toward the 106.00 zone, where the next supply awaits.
However, the key level to watch is 107.600, aligning with a major Daily Timeframe Supply Zone. This zone may act as a strong reversal point or profit-taking area for swing traders.
Bearish reversal off 50% Fibonacci resistance?USD/JPY is rising towards the pivot, which aligns with the 50% Fibonacci retracement and could reverse to the 1st support, a pullback level.
Pivot: 144.37
1st Support: 141.94
1st Resistance: 146.17
Risk Warning:
Trading Forex and CFDs carries a high level of risk to your capital and you should only trade with money you can afford to lose. Trading Forex and CFDs may not be suitable for all investors, so please ensure that you fully understand the risks involved and seek independent advice if necessary.
Disclaimer:
The above opinions given constitute general market commentary, and do not constitute the opinion or advice of IC Markets or any form of personal or investment advice.
Any opinions, news, research, analyses, prices, other information, or links to third-party sites contained on this website are provided on an "as-is" basis, are intended only to be informative, is not an advice nor a recommendation, nor research, or a record of our trading prices, or an offer of, or solicitation for a transaction in any financial instrument and thus should not be treated as such. The information provided does not involve any specific investment objectives, financial situation and needs of any specific person who may receive it. Please be aware, that past performance is not a reliable indicator of future performance and/or results. Past Performance or Forward-looking scenarios based upon the reasonable beliefs of the third-party provider are not a guarantee of future performance. Actual results may differ materially from those anticipated in forward-looking or past performance statements. IC Markets makes no representation or warranty and assumes no liability as to the accuracy or completeness of the information provided, nor any loss arising from any investment based on a recommendation, forecast or any information supplied by any third-party.

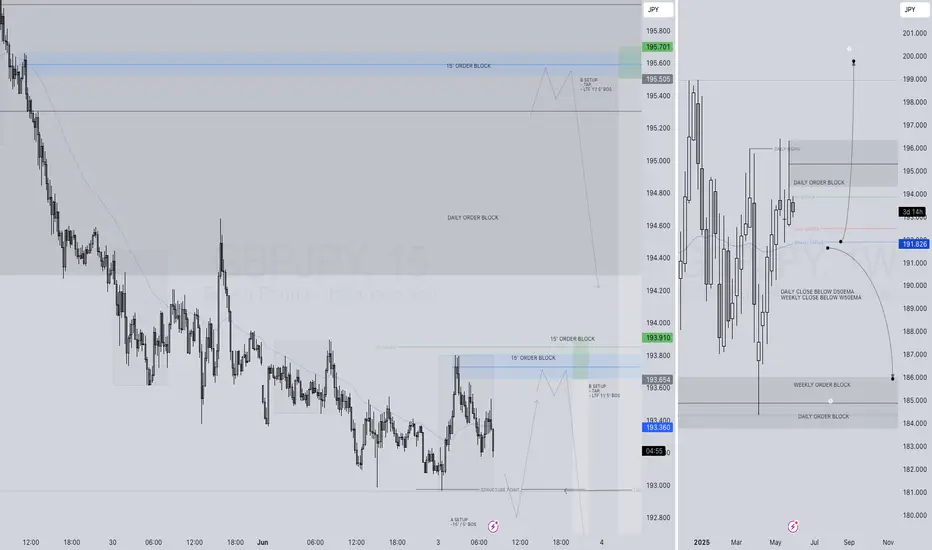
GBPJPY LONG FORECAST Q2 W23 D3 Y25GBPJPY LONG FORECAST Q2 W23 D3 Y25
Professional Risk Managers👋
Welcome back to another FRGNT chart update📈
Diving into some Forex setups using predominantly higher time frame order blocks alongside confirmation breaks of structure.
Let’s see what price action is telling us today!
💡Here are some trade confluences📝
✅Daily order block
✅15' order block
✅Intraday breaks of structure
✅4H 50 EMA rejection
🔑 Remember, to participate in trading comes always with a degree of risk, therefore as professional risk managers it remains vital that we stick to our risk management plan as well as our trading strategies.
📈The rest, we leave to the balance of probabilities.
💡Fail to plan. Plan to fail.
🏆It has always been that simple.
❤️Good luck with your trading journey, I shall see you at the very top.
🎯Trade consistent, FRGNT X
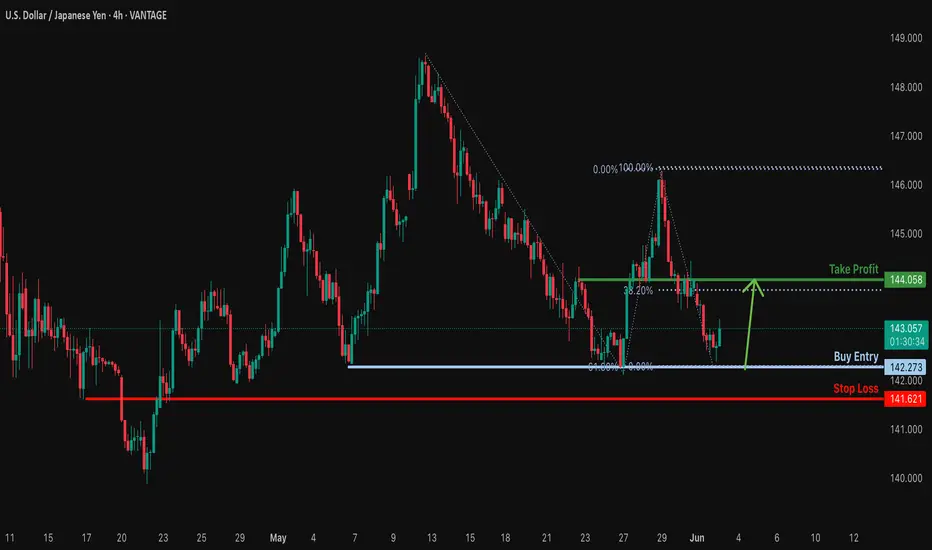
Bullish bounce off pullback support?USD/JPY has bounced off the support level which is a pullback support that lines up with the 61.8% Fibonacci projection and could rise from this level to our take profit.
Entry: 142.27
Why we like it:
There is a pullback support level that lines up with the 61.8% Fibonacci projection.
Stop loss: 141.62
Why we like it:
There is a pullback support level.
Take profit: 144.05
Why we like it:
There is a pullback resistance that lines up with the 38.25 fibonacci retracement.
Enjoying your TradingView experience? Review us!
Please be advised that the information presented on TradingView is provided to Vantage (‘Vantage Global Limited’, ‘we’) by a third-party provider (‘Everest Fortune Group’). Please be reminded that you are solely responsible for the trading decisions on your account. There is a very high degree of risk involved in trading. Any information and/or content is intended entirely for research, educational and informational purposes only and does not constitute investment or consultation advice or investment strategy. The information is not tailored to the investment needs of any specific person and therefore does not involve a consideration of any of the investment objectives, financial situation or needs of any viewer that may receive it. Kindly also note that past performance is not a reliable indicator of future results. Actual results may differ materially from those anticipated in forward-looking or past performance statements. We assume no liability as to the accuracy or completeness of any of the information and/or content provided herein and the Company cannot be held responsible for any omission, mistake nor for any loss or damage including without limitation to any loss of profit which may arise from reliance on any information supplied by Everest Fortune Group.
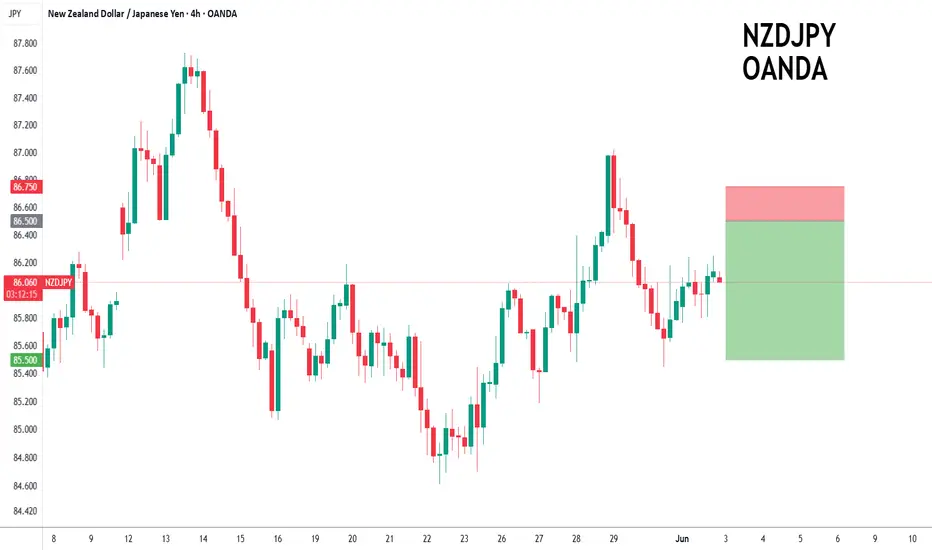
NZDJPY to find sellers at previous resistance?NZDJPY - 24h expiry
Trading has been mixed and volatile. Price action looks to be forming a top. We look for a temporary move higher. Preferred trade is to sell into rallies. Bespoke resistance is located at 86.50.
We look to Sell at 86.50 (stop at 86.75)
Our profit targets will be 85.50 and 85.25
Resistance: 86.30 / 86.70 / 87.00
Support: 85.50 / 85.20 / 84.80
Risk Disclaimer
The trade ideas beyond this page are for informational purposes only and do not constitute investment advice or a solicitation to trade. This information is provided by Signal Centre, a third-party unaffiliated with OANDA, and is intended for general circulation only. OANDA does not guarantee the accuracy of this information and assumes no responsibilities for the information provided by the third party. The information does not take into account the specific investment objectives, financial situation, or particular needs of any particular person. You should take into account your specific investment objectives, financial situation, and particular needs before making a commitment to trade, including seeking advice from an independent financial adviser regarding the suitability of the investment, under a separate engagement, as you deem fit.
You accept that you assume all risks in independently viewing the contents and selecting a chosen strategy.
Where the research is distributed in Singapore to a person who is not an Accredited Investor, Expert Investor or an Institutional Investor, Oanda Asia Pacific Pte Ltd (“OAP“) accepts legal responsibility for the contents of the report to such persons only to the extent required by law. Singapore customers should contact OAP at 6579 8289 for matters arising from, or in connection with, the information/research distributed.
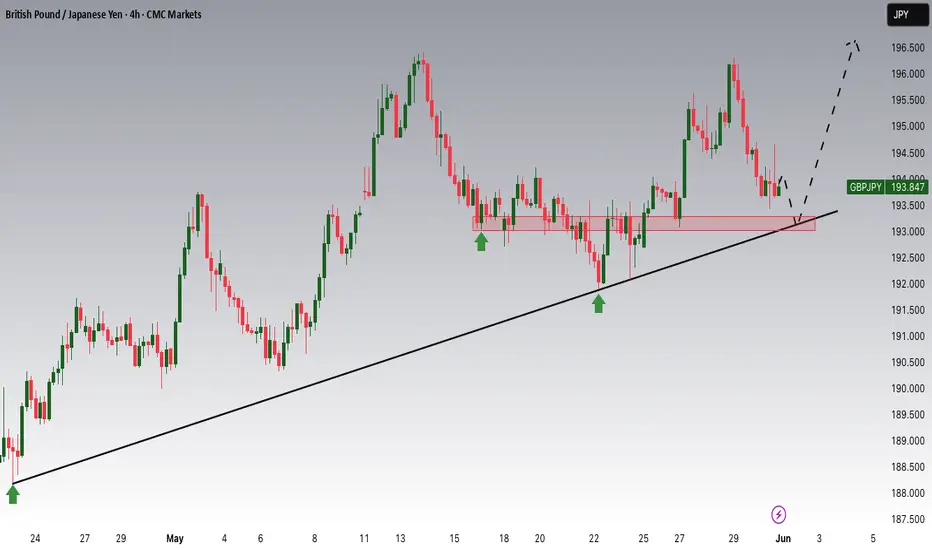
GBPJPY Potential UpsidesHey Traders, in the coming week we are monitoring GBPJPY for a buying opportunity around 193.300 zone, GBPJPY is trading in an uptrend and currently is in a correction phase in which it is approaching the trend at 193.300 support and resistance area.
Trade safe, Joe.
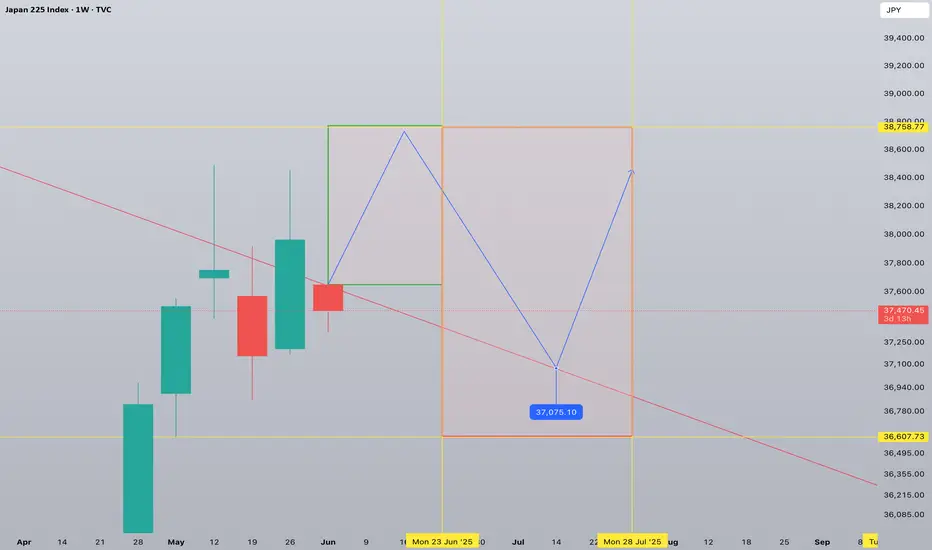
NIKKEI 1W forecast until end of July 2025Broadening wedge formation on the table - a lot of sideways movement within the range of 38,758 and 36,607
Upward momentum will last for a couple of weeks more. The most likely top is 38,758
Starting from second half of June 2025 we may see a start of correction strong, but healthy. Correction/rest bottom is expected in mid July at 37,075 and should not fall deeper than 36,607
Second half of July the index would probably try to climb up to 58,758 with doubtful success.
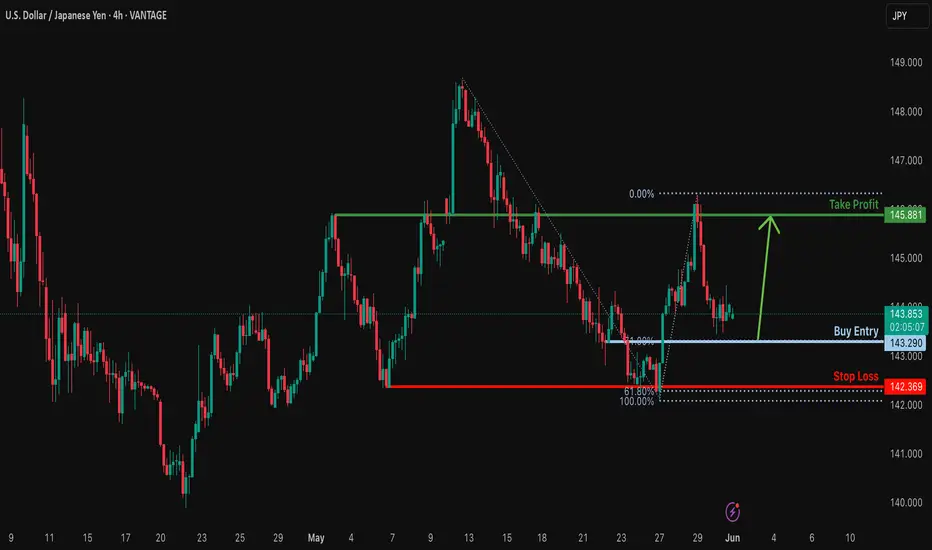
Bullish bounce?USD/JPY is falling towards the support level which id a pullback support that lines up with the 71% Fibonacci retracement and could bounce from this level to our take profit.
Entry: 143.29
Why we lke it:
There is a pullback support level that aligns with the 71% Fibonacci retracement.
Stop loss:142.36
Why we like it:
There is a pullback support level that lines up with the 61.8% Fibonacci projection.
Take profit: 145.88
Why we like it:
There is a pullback resistance level.
Enjoying your TradingView experience? Review us!
Please be advised that the information presented on TradingView is provided to Vantage (‘Vantage Global Limited’, ‘we’) by a third-party provider (‘Everest Fortune Group’). Please be reminded that you are solely responsible for the trading decisions on your account. There is a very high degree of risk involved in trading. Any information and/or content is intended entirely for research, educational and informational purposes only and does not constitute investment or consultation advice or investment strategy. The information is not tailored to the investment needs of any specific person and therefore does not involve a consideration of any of the investment objectives, financial situation or needs of any viewer that may receive it. Kindly also note that past performance is not a reliable indicator of future results. Actual results may differ materially from those anticipated in forward-looking or past performance statements. We assume no liability as to the accuracy or completeness of any of the information and/or content provided herein and the Company cannot be held responsible for any omission, mistake nor for any loss or damage including without limitation to any loss of profit which may arise from reliance on any information supplied by Everest Fortune Group.
Bullish bounce off pullback support?USD/JPY is falling towards the pivot which acts as a pullback support and could bounce to the 1st resistance.
Pivot: 141.94
1st Support: 140.24
1st Resistance: 148.56
,Risk Warning:
Trading Forex and CFDs carries a high level of risk to your capital and you should only trade with money you can afford to lose. Trading Forex and CFDs may not be suitable for all investors, so please ensure that you fully understand the risks involved and seek independent advice if necessary.
Disclaimer:
The above opinions given constitute general market commentary, and do not constitute the opinion or advice of IC Markets or any form of personal or investment advice.
Any opinions, news, research, analyses, prices, other information, or links to third-party sites contained on this website are provided on an "as-is" basis, are intended only to be informative, is not an advice nor a recommendation, nor research, or a record of our trading prices, or an offer of, or solicitation for a transaction in any financial instrument and thus should not be treated as such. The information provided does not involve any specific investment objectives, financial situation and needs of any specific person who may receive it. Please be aware, that past performance is not a reliable indicator of future performance and/or results. Past Performance or Forward-looking scenarios based upon the reasonable beliefs of the third-party provider are not a guarantee of future performance. Actual results may differ materially from those anticipated in forward-looking or past performance statements. IC Markets makes no representation or warranty and assumes no liability as to the accuracy or completeness of the information provided, nor any loss arising from any investment based on a recommendation, forecast or any information supplied by any third-party.

Weekly FOREX Forecast Jun 2 - 6th: CHF & JPY FuturesThis is the FOREX futures outlook for the week of Jun 2 - 6th.
In this video, we will analyze the following FX markets:
CHF JPY
It's been a consolidative week, but the USD is still weak. Look for valid breakdowns of consolidations before buying against the USD.
NFP week ahead! Mon-Wed will be the best days to trade.
Enjoy!
May profits be upon you.
Leave any questions or comments in the comment section.
I appreciate any feedback from my viewers!
Like and/or subscribe if you want more accurate analysis.
Thank you so much!
Disclaimer:
I do not provide personal investment advice and I am not a qualified licensed investment advisor.
All information found here, including any ideas, opinions, views, predictions, forecasts, commentaries, suggestions, expressed or implied herein, are for informational, entertainment or educational purposes only and should not be construed as personal investment advice. While the information provided is believed to be accurate, it may include errors or inaccuracies.
I will not and cannot be held liable for any actions you take as a result of anything you read here.
Conduct your own due diligence, or consult a licensed financial advisor or broker before making any and all investment decisions. Any investments, trades, speculations, or decisions made on the basis of any information found on this channel, expressed or implied herein, are committed at your own risk, financial or otherwise.

GBPJPY Weekly overview Jun 1, 2025 – Jun 7, 2025BOJ Gov Ueda Speaks could make market move faster in its direction. avoid trading around his speech.
*******************************************************************
The indicated levels are determined based on the most reaction points and the assumption of approximately equal distance between the zones.
Some of these points can also be confirmed by the mathematical intervals of Murray.
You can enter with/without confirmation. IF you want to take confirmation you can use LTF analysis, Spike move confirmation, Trend Strength confirmation and ETC.
SL could be placed below the zone or regarding the LTF swings.
TP is the next zone or the nearest moving S&R, which are median and borders of the drawn channels.
*******************************************************************
Role of different zones:
GREEN: Just long trades allowed on them.
RED: Just Short trades allowed on them.
BLUE: both long and short trades allowed on them.
WHITE: No trades allowed on them! just use them as TP points
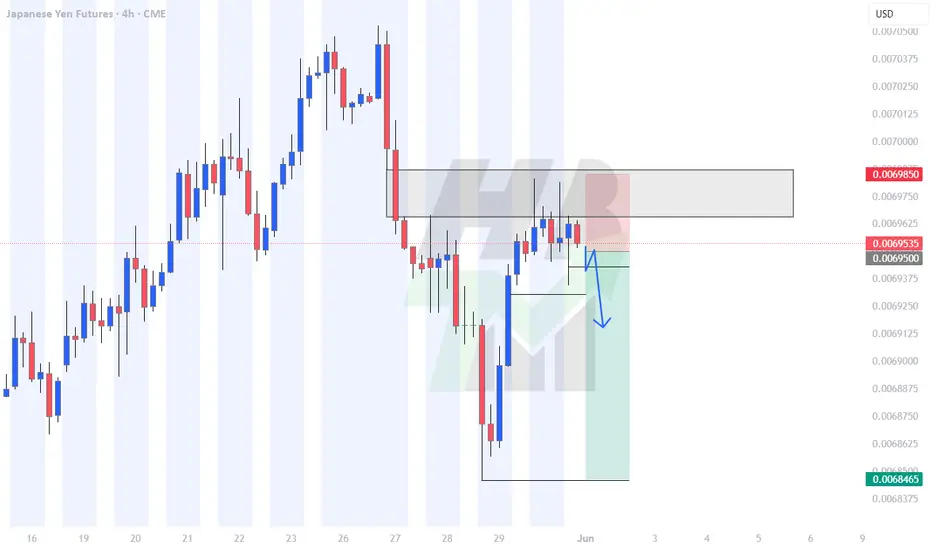
6J Weekly TrajectionsWe got a good lower target liquidity and a nice rejection off of 4H FVG. This is my idea on where the price will be going over the next week.
Bullish USDJPY The video is self-explanatory.
UJ failing to break a strong weekly and daily support zone, which increases the probability of a bullish trend for the next days or weeks.

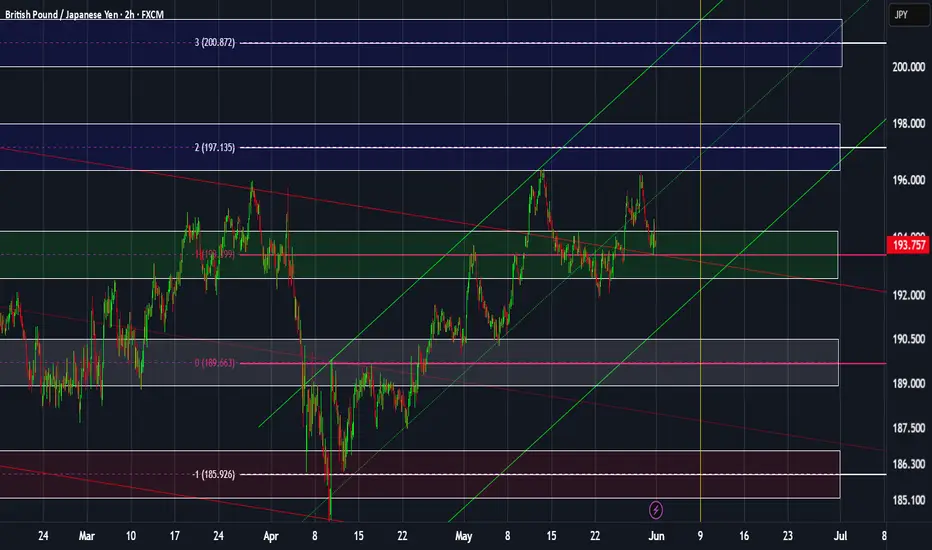
USDJPY: Weekly overviewHello Traders, US news could move this pair dramatically.
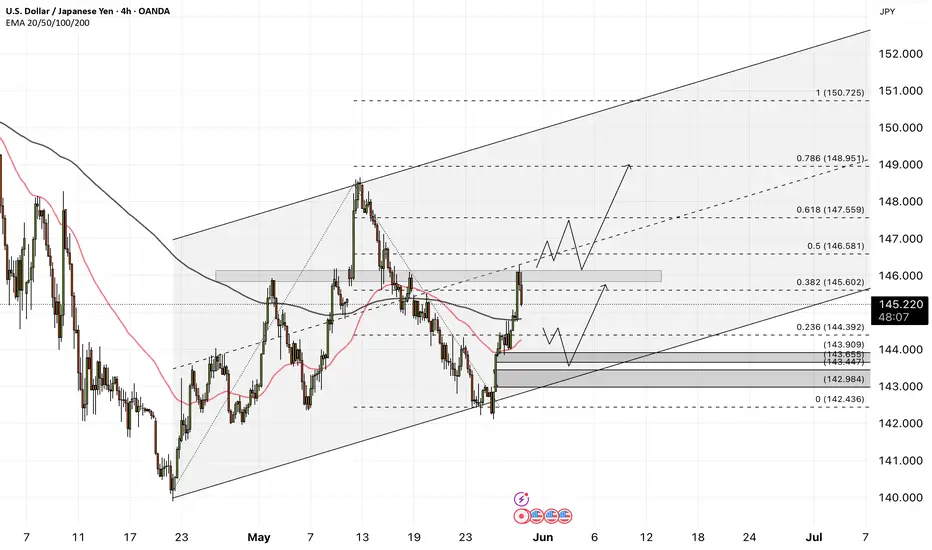
I've made the white zone no trade because of strong additional zone around 148.225 for the bullish side and a sharp move needed to reach the zone.
The zone around 142.892 is more suitable for short trades, regarding the trend and distance from median of the channel. This zone is only suitable for long if the break be strong enough to overpass the median of the channel.
The indicated levels are determined based on the most reaction points and the assumption of approximately equal distance between the zones.
Some of these points can also be confirmed by the mathematical intervals of Murray.
You can enter with/without confirmation. IF you want to take confirmation you can use LTF analysis, Spike move confirmation, Trend Strength confrimation and ETC.
SL could be placed below the zone or regarding the LTF swings.
TP is the next zone or the nearest moving S&R, which are median and borders of the drawn channels.
*******************************************************************
Role of different zones:
GREEN: Just long trades allowed on them.
RED: Just Short trades allowed on them.
BLUE: both long and short trades allowed on them.
WHITE: No trades allowed on them! just use them as TP points
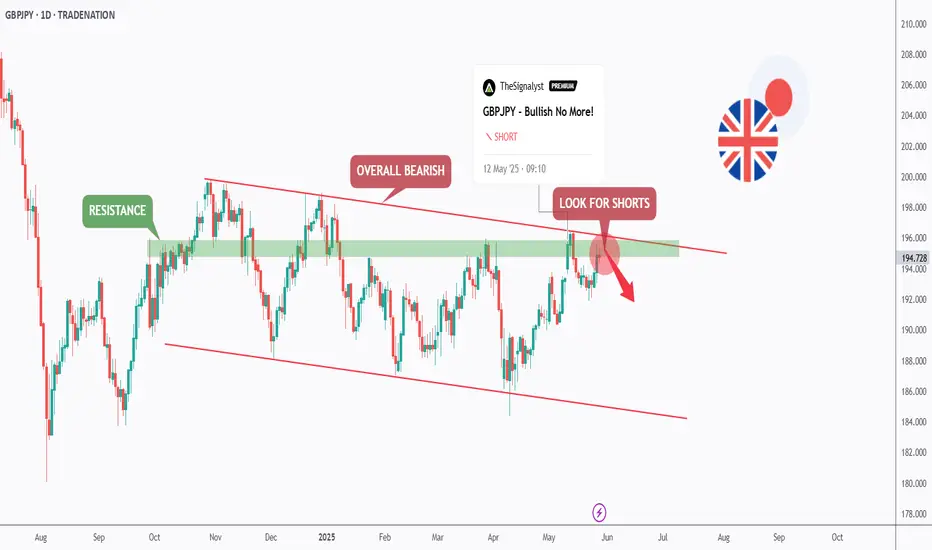
GBPJPY - Bearish Control, Again!Hello TradingView Family / Fellow Traders. This is Richard, also known as theSignalyst.
📉As per our last GBPJPY analysis (attached on the chart), it rejected the upper red trendline and traded lower.
What's next?
GBPJPY is currently retesting the upper bound of the falling red channel again.
Moreover, the green zone is a strong structure and resistance.
🏹 Thus, the highlighted red circle is a strong area to look for sell setups as it is the intersection of structure and upper red trendline acting as a non-horizontal resistance.
📚 As per my trading style:
As #GBPJPY is around the red circle zone, I will be looking for bearish reversal setups (like a double top pattern, trendline break , and so on...)
📚 Always follow your trading plan regarding entry, risk management, and trade management.
Good luck!
All Strategies Are Good; If Managed Properly!
~Rich
Disclosure: I am part of Trade Nation's Influencer program and receive a monthly fee for using their TradingView charts in my analysis.
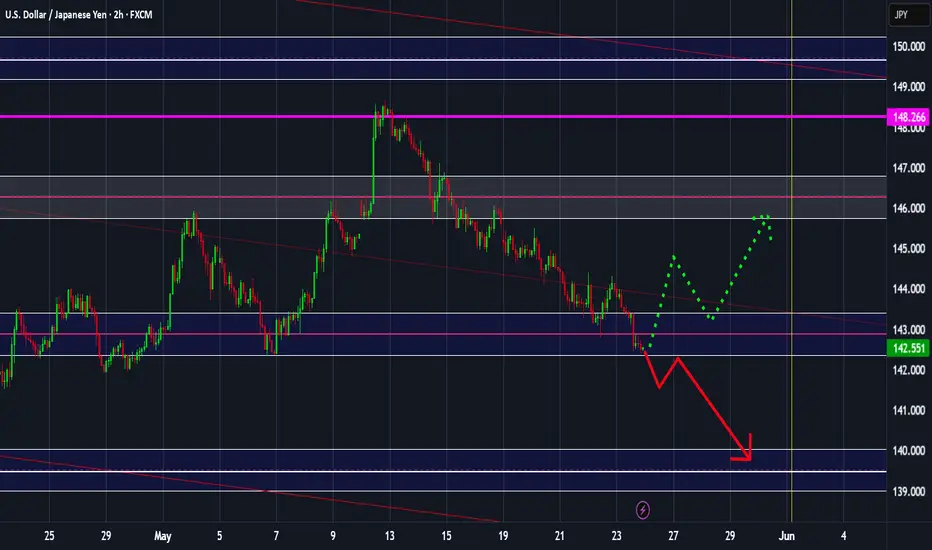
Could the price bounce from here?USD/JPY is falling towards the pivot and could bounce to the 1st resistance, which acts as a pullback resistance.
Pivot: 143.25
1st Support: 141.80
1st Resistance: 145.97
Risk Warning:
Trading Forex and CFDs carries a high level of risk to your capital and you should only trade with money you can afford to lose. Trading Forex and CFDs may not be suitable for all investors, so please ensure that you fully understand the risks involved and seek independent advice if necessary.
Disclaimer:
The above opinions given constitute general market commentary, and do not constitute the opinion or advice of IC Markets or any form of personal or investment advice.
Any opinions, news, research, analyses, prices, other information, or links to third-party sites contained on this website are provided on an "as-is" basis, are intended only to be informative, is not an advice nor a recommendation, nor research, or a record of our trading prices, or an offer of, or solicitation for a transaction in any financial instrument and thus should not be treated as such. The information provided does not involve any specific investment objectives, financial situation and needs of any specific person who may receive it. Please be aware, that past performance is not a reliable indicator of future performance and/or results. Past Performance or Forward-looking scenarios based upon the reasonable beliefs of the third-party provider are not a guarantee of future performance. Actual results may differ materially from those anticipated in forward-looking or past performance statements. IC Markets makes no representation or warranty and assumes no liability as to the accuracy or completeness of the information provided, nor any loss arising from any investment based on a recommendation, forecast or any information supplied by any third-party.
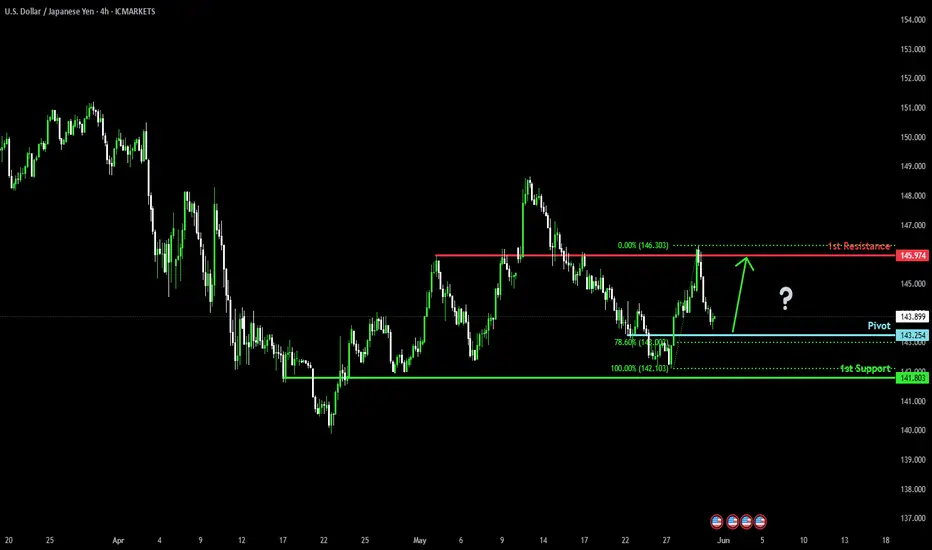
USDJPY - Will the dollar weakness stop?!The USDJPY currency pair is above the EMA200 and EMA50 on the 4-hour timeframe and is moving in its ascending channel. In case of correction due to the release of today's economic data, we can see a downward trend and then see the demand zone and buy in that range with an appropriate risk-reward ratio. A credible break of the indicated resistance range will pave the way for the currency pair to rise.
Japanese Prime Minister Shigeru Ishiba emphasized that investment is more crucial to economic growth than tariffs, reaffirming Japan’s continued commitment to negotiating the removal of U.S. trade tariffs. He also pointed to encouraging signs in the Japanese economy following wage increases and offered an optimistic outlook on the country’s recovery.
Meanwhile, Bank of Japan Governor Kazuo Ueda, speaking on Wednesday, warned that significant volatility in ultra-long-term bond yields could affect short-term borrowing costs, which in turn might exert a stronger impact on the broader economy. His remarks highlight the BOJ’s growing focus on recent fluctuations in long-dated bond yields, which could influence the board’s decision next month regarding the pace of its bond purchase reduction.
Ueda explained that in Japan, short- and medium-term interest rates tend to have more direct influence on the economy than ultra-long yields, due to the maturity structure of household and corporate debt. However, he acknowledged in a parliamentary session that sharp moves in ultra-long yields can also affect long- and even short-term bond yields indirectly.
Turning to Friday’s inflation report, expectations suggest that overall inflation remained subdued in April, as falling gasoline prices provided some relief to household budgets. However, core inflation—excluding food and energy—remains stubbornly high.
The PCE inflation index is anticipated to have risen 2.2% in April from a year earlier, slightly down from 2.3% in March, marking the lowest level since last September. Federal Reserve officials are still awaiting more data on how newly imposed tariffs are feeding into the broader economy, making it unlikely that the recent moderation in inflation will prompt a rate cut in the near term.
Although the Fed’s preferred inflation measure may have reached its lowest point since September, a second consecutive month of encouraging price data is unlikely to be sufficient to justify easing interest rates.
According to a survey conducted by Dow Jones Newswires and The Wall Street Journal, economists expect Friday’s report—covering inflation, income, and spending—from the Bureau of Economic Analysis to show that consumer prices rose 2.2% year-over-year through April. This would mark the lowest reading since September and a potential turning point in the Fed’s battle against post-pandemic inflation.
Goldman Sachs economists noted that falling gasoline prices have more than offset the inflationary impact of new tariffs introduced by the Trump administration. However, they cautioned that this dynamic may not last, as retailers are likely to start passing along the added import tax costs to consumers in the coming months.
Several Federal Reserve officials, concerned that tariffs could reignite inflation, have stated that they will wait to assess the full impact of these trade policies on the economy before making changes to the federal funds rate—which directly affects borrowing costs on everything from mortgages and auto loans to credit cards.