How R2F Frames Trades Using ICT ConceptsHere I use USDJPY to illustrate how I would perform a top-down analysis in order to visualize the PD Array Matrix, and thus frame possible trades.
I have 2 perspectives. From a candle science approach, and a price action approach.
Ideally, I do not want to go lower than a 4h timeframe for my candle science perspective.
I hope the video is insightful.
- R2F
Jpy

Massive Sentiment Swing (Bears vs Bulls Royal Rumble)Many traders were looking for answers this week. What just happened? The quick summary is the JPY carry trade was quickly unwinding and as the Nikkei 225 was dumping with the largest 2 day move (EVER) the JPY volatility increased. On top of that, the FED didn't cut rates in July (as expected) and elected to punt to September (with likely 25 bps cut forecasted). Unfortunately, Thursday Unemployment Claims were higher and Friday's Non-Farm was a massive whiff. This triggered concerns that the FED is now behind the curve and the economy is heading into a recession (Sahm Rule is undefeated as a predictor). Key takeaways from me this week - VIX made the 2nd largest single day spike (Friday to Monday), and 24 hrs later made the 1st largest single day retreat (Monday to Tuesday). As I explain in the video, eerily similar volatility event like we saw in 2017 into January 2018. History rhymes and 2017/2018 were very different economic times compared to today. The week ahead is a bit lighter on US earnings, but key news is PPI and CPI (Tue and Wed prints). I'll be watching the key equilibrium levels to see who gets the upper hand. Do bears attempt to push price lower and re-test the lows? Do bulls continue to rip after the outlier cleanse and we're back to all-time highs before the election or end of year? We'll find out. I'll be watching and trading and doing my best. Thanks for watching!!!

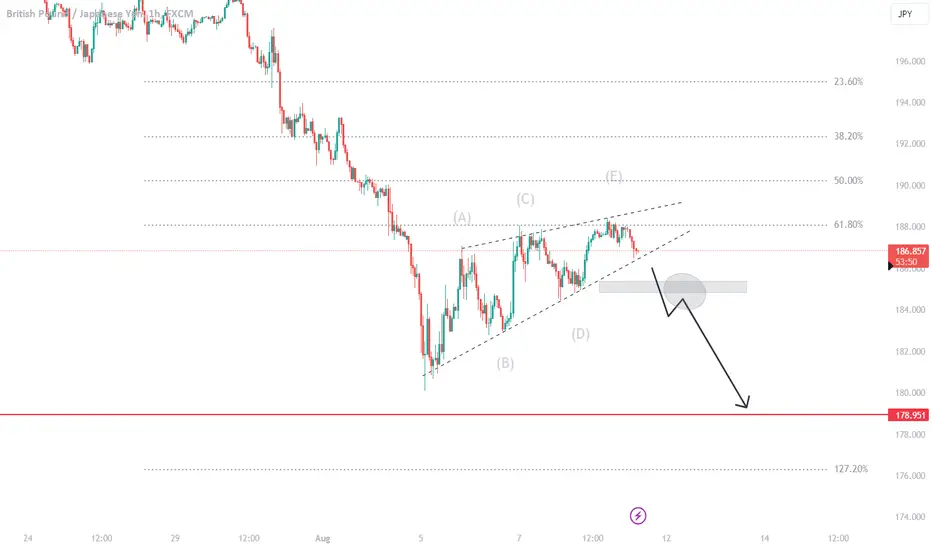
GBPJPY SELL ??Really nothing much to say on this one as chart explains itself.
Would be looking forward to economic impact over the weekend heading into next week for caution.
Thoughts?
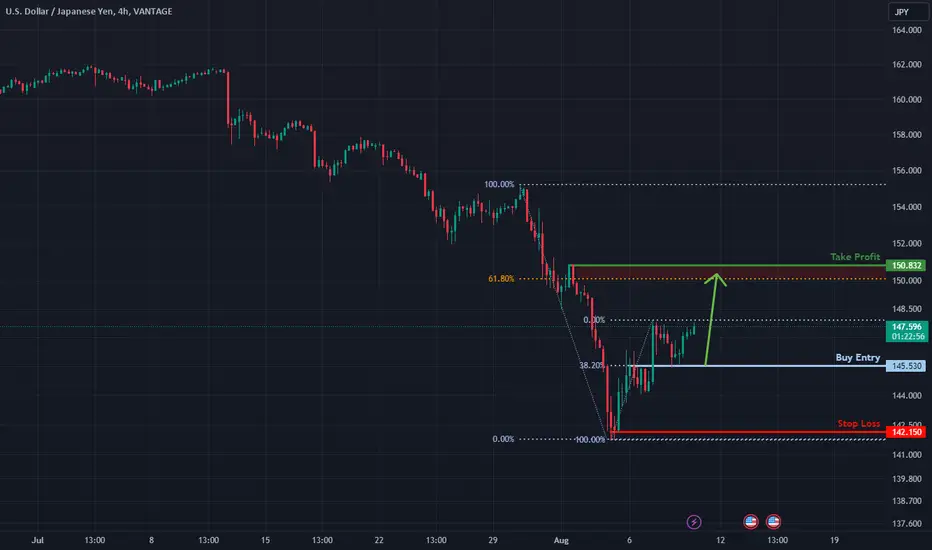
Potential bullish rise?USD/JPY has bounced off the support level which is a pullback support that lines up with the 38.2% Fibonacci retracement and could rise to our take profit.
Entry: 145.53
Why we like it:
There is a pullback support level which aligns with the 38.2% Fibonacci retracement.
Stop loss: 142.15
Why we like it:
There is a pullback support level.
Take profit: 150.83
Why we like it:
There is a pullback resistance level which is slightly above the 61.8% Fibonacci retracement.
Please be advised that the information presented on TradingView is provided to Vantage (‘Vantage Global Limited’, ‘we’) by a third-party provider (‘Everest Fortune Group’). Please be reminded that you are solely responsible for the trading decisions on your account. There is a very high degree of risk involved in trading. Any information and/or content is intended entirely for research, educational and informational purposes only and does not constitute investment or consultation advice or investment strategy. The information is not tailored to the investment needs of any specific person and therefore does not involve a consideration of any of the investment objectives, financial situation or needs of any viewer that may receive it. Kindly also note that past performance is not a reliable indicator of future results. Actual results may differ materially from those anticipated in forward-looking or past performance statements. We assume no liability as to the accuracy or completeness of any of the information and/or content provided herein and the Company cannot be held responsible for any omission, mistake nor for any loss or damage including without limitation to any loss of profit which may arise from reliance on any information supplied by Everest Fortune Group.
Potential bullish rise?NZD/JPY has bounced off the pivot which acts as a pullback support and could rise to the 1st resistance identified as an overlap resistance.
Pivot: 87.19
1st Support: 85.45
1st Resistance: 89.94
Risk Warning:
Trading Forex and CFDs carries a high level of risk to your capital and you should only trade with money you can afford to lose. Trading Forex and CFDs may not be suitable for all investors, so please ensure that you fully understand the risks involved and seek independent advice if necessary.
Disclaimer:
The above opinions given constitute general market commentary, and do not constitute the opinion or advice of IC Markets or any form of personal or investment advice.
Any opinions, news, research, analyses, prices, other information, or links to third-party sites contained on this website are provided on an "as-is" basis, are intended only to be informative, is not an advice nor a recommendation, nor research, or a record of our trading prices, or an offer of, or solicitation for a transaction in any financial instrument and thus should not be treated as such. The information provided does not involve any specific investment objectives, financial situation and needs of any specific person who may receive it. Please be aware, that past performance is not a reliable indicator of future performance and/or results. Past Performance or Forward-looking scenarios based upon the reasonable beliefs of the third-party provider are not a guarantee of future performance. Actual results may differ materially from those anticipated in forward-looking or past performance statements. IC Markets makes no representation or warranty and assumes no liability as to the accuracy or completeness of the information provided, nor any loss arising from any investment based on a recommendation, forecast or any information supplied by any third-party.

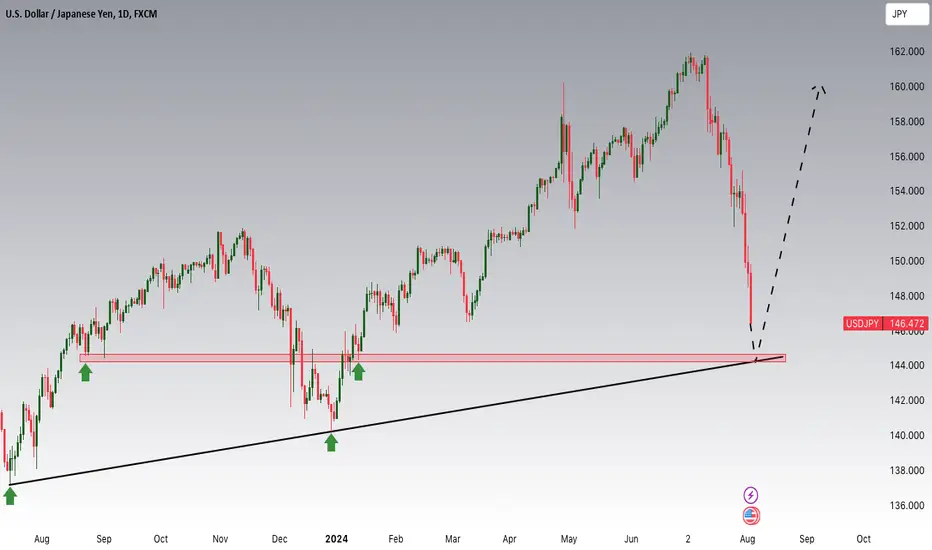
Bullish Reversal on USD/JPY"Based on the demand and supply zones strategy, we anticipate a bullish reversal in USD/JPY. After a significant downward movement, the price has reached a key demand zone, where buyers typically step in, creating upward pressure. Historically, these zones have acted as strong support, leading to substantial rebounds. Current market sentiment, combined with the oversold condition, suggests that buyers will overpower sellers, pushing the price upwards. This spike is likely to gain momentum as more traders recognize the opportunity and enter the market."
"Please note that the information provided is for educational purposes only and should not be considered as financial advice. Market predictions are inherently uncertain, and trading involves risk. I am not responsible for any financial losses or damages that may result from trading decisions based on this analysis. Always conduct your own research or consult with a professional financial advisor before making any investment decisions."
USDJPY Is Approaching An Important SupportHey Traders, in tomorrow's trading session we are monitoring USDJPY for a buying opportunity around 144.500 zone, USDJPY is trading in an uptrend and currently is in a correction phase in which it is approaching the trend at 144.500 support and resistance area.
Trade safe, Joe.
Potential bullish rise?USD/JPY has reacted off the pivot and could rise to the pullback resistance.
Pivot: 145.48
1st Support: 142.06
1st Resistance: 150.84
Risk Warning:
Trading Forex and CFDs carries a high level of risk to your capital and you should only trade with money you can afford to lose. Trading Forex and CFDs may not be suitable for all investors, so please ensure that you fully understand the risks involved and seek independent advice if necessary.
Disclaimer:
The above opinions given constitute general market commentary, and do not constitute the opinion or advice of IC Markets or any form of personal or investment advice.
Any opinions, news, research, analyses, prices, other information, or links to third-party sites contained on this website are provided on an "as-is" basis, are intended only to be informative, is not an advice nor a recommendation, nor research, or a record of our trading prices, or an offer of, or solicitation for a transaction in any financial instrument and thus should not be treated as such. The information provided does not involve any specific investment objectives, financial situation and needs of any specific person who may receive it. Please be aware, that past performance is not a reliable indicator of future performance and/or results. Past Performance or Forward-looking scenarios based upon the reasonable beliefs of the third-party provider are not a guarantee of future performance. Actual results may differ materially from those anticipated in forward-looking or past performance statements. IC Markets makes no representation or warranty and assumes no liability as to the accuracy or completeness of the information provided, nor any loss arising from any investment based on a recommendation, forecast or any information supplied by any third-party.

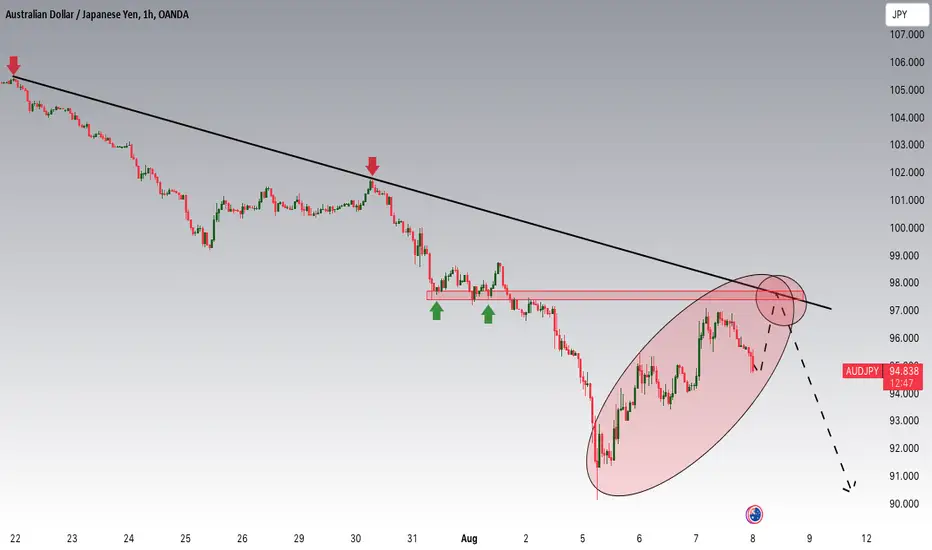
AUDJPY: Consolidation phase approaching the trendHey Traders, in today's trading session we are monitoring AUDJPY for a selling opportunity around 97 zone, AUDJPY is trading in a downtrend and currently is in a correction phase in which it is approaching the trend at 97 support and resistance area.
Trade safe, Joe.
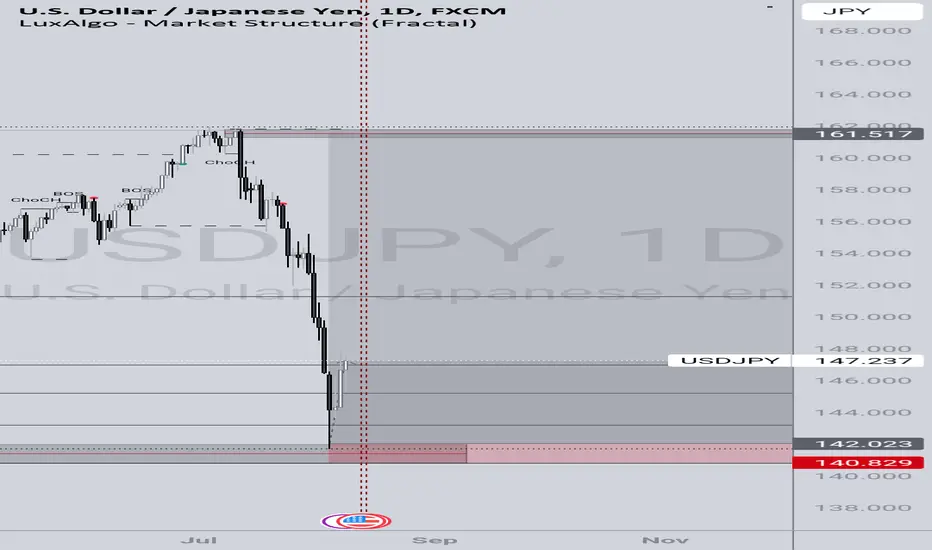
USDJPY bear weight ON. JPY safe haven status in PLAY now.FX:USDJPY
JPY flight to safety currency / safe haven status in play now after the recent geopolitics conflict.
Will the strength reverse now in favor of JPY. Let's see.
Weekly shift registered.
Spotted at 148.90
TAYOR.
Safeguard funds always.

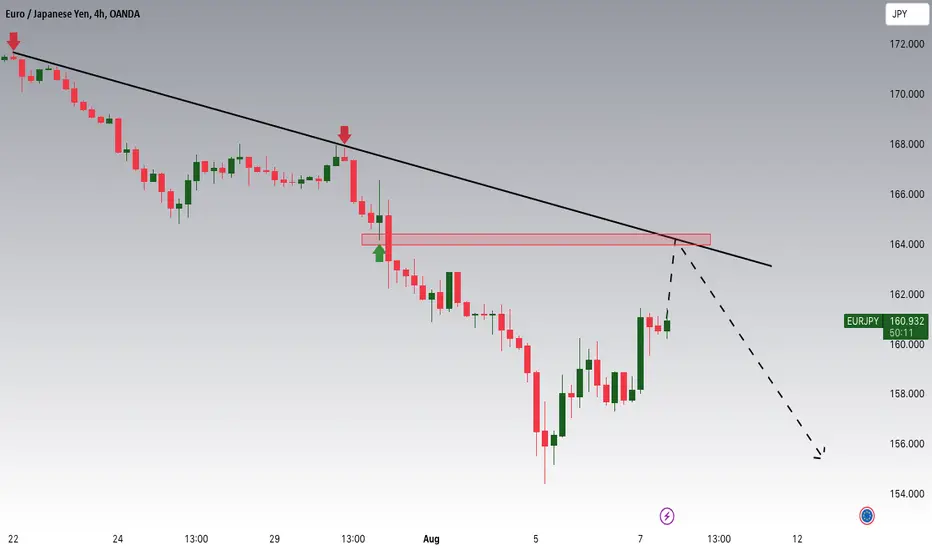
EURJPY: JPY is outperforming the EUROHey Traders, in today's trading session we are monitoring EURJPY for a selling opportunity around 164 zone, EURJPY is trading in a downtrend and currently is in a correction phase in which it is approaching the trend at 164 support and resistance area.
Trade safe, Joe.
BOJ Rate Hike Causes Unrest in the Stock Markets: What next?When the Bank of Japan hiked its interest rate at the end of July, global markets went into turbulence.
We will discuss what currency carry trade is, why the yen carry trade has caused this global volatility, and, importantly, whether the market will resume its uptrend.
Micro E-Mini Nasdaq Futures and Options
Ticker: MNQ
Minimum fluctuation:
0.25 index points = $0.50
Japanese Yen Futures
Ticker: 6J
0.0000005 per JPY increment = $6.25
Disclaimer:
• What presented here is not a recommendation, please consult your licensed broker.
• Our mission is to create lateral thinking skills for every investor and trader, knowing when to take a calculated risk with market uncertainty and a bolder risk when opportunity arises.
CME Real-time Market Data help identify trading set-ups in real-time and express my market views. If you have futures in your trading portfolio, you can check out on CME Group data plans available that suit your trading needs tradingview.sweetlogin.com

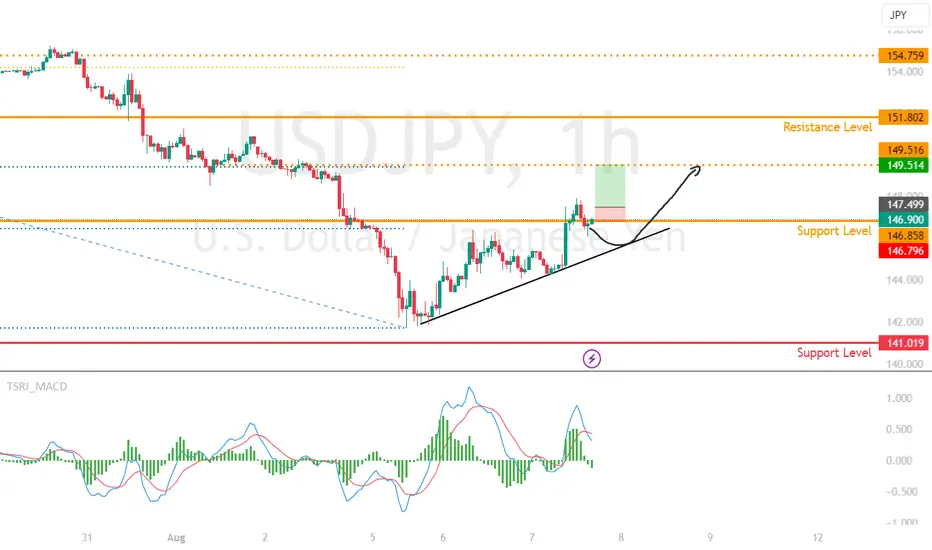
BoJ shows uncertainty, Yen WeakensThe BoJ indicated that it was not ready to hike rates further if the market continues with volatility
On release of the news, the Yen weakened, with the USDJPY rising to test the 148 price area
look for a potential breakout to the 149.50 price level as further yen weakness is anticipated
Black Monday 2024? Discussing Current Markets and PositionsDuring Monday's open, I said this is going to be a day for the history books. Volatility expanded nearly 200% on the day (over 300% in a 3 day period), the Nikkei 225 crashed over 12% in a single day and had the largest 2 day decline ever. It leaked into the US markets with a nasty bearish futures run and massive gaps lower. Fortunately Monday's trading didn't make things much worse, but the damage was already done for many with that dramatic vol expansion. As the dust settles a bit more into Tuesday's trading, I wanted to review everything. Enjoy!!!

USD/JPY bull flag forms at extremely oversold levelsBy Monday's low, USD/JPY had fallen -12.5% from its July high and the daily RSI (14) had reached its most oversold level since 1996. And with a bullish inside day on Tuesday with a potential bull flag forming on the intraday timeframe, dups look good over the near-term for bulls. Whether it can truly capitalise on any decent rally depends on appetite for risk in general, but for now we look at a cheeky long.

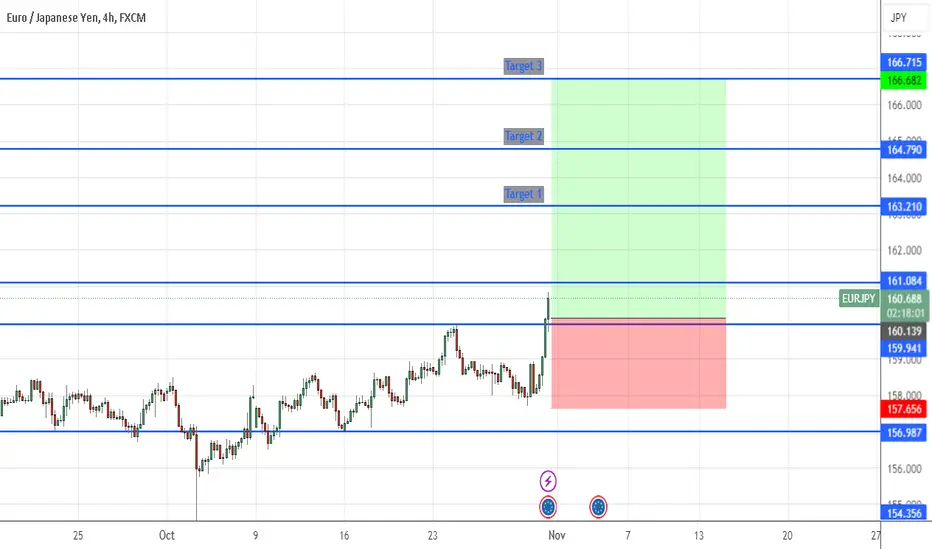
Juicy longs for the Eur/JpyEuro looks set to reach new highs against the yen. Looking to stay long on this one for as the pair eyes 163.20, 164.8 ahead of NFP and other events. Eventually could make its way up to the 166.70 region if bulls keep bringin the steam.