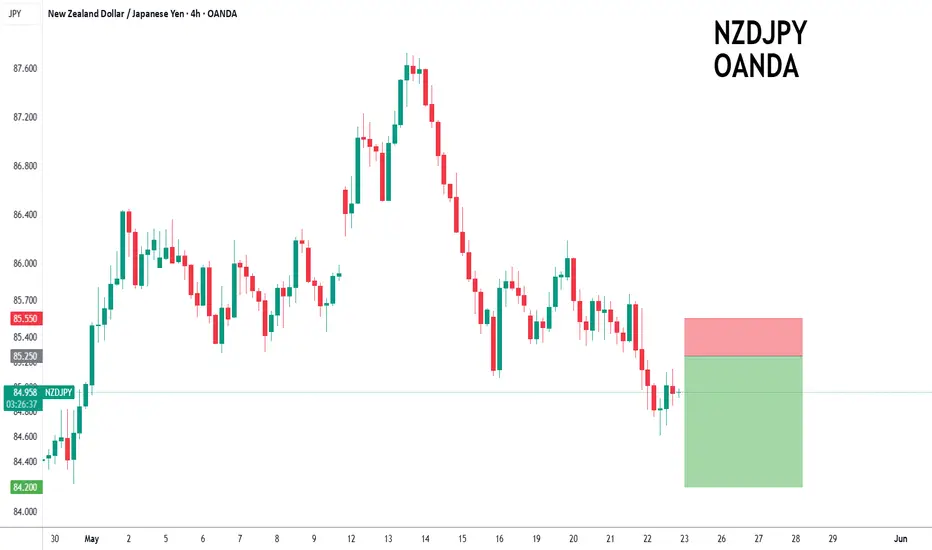
NZDJPY to continue in the downward move?NZDJPY - 24h expiry
The medium term bias remains bearish.
Short term RSI is moving higher.
We look for a temporary move higher.
Preferred trade is to sell into rallies.
Bespoke resistance is located at 85.25.
We look to Sell at 85.25 (stop at 85.55)
Our profit targets will be 84.20 and 84.00
Resistance: 85.25 / 85.70 / 86.10
Support: 84.60 / 84.20 / 84.00
Risk Disclaimer
The trade ideas beyond this page are for informational purposes only and do not constitute investment advice or a solicitation to trade. This information is provided by Signal Centre, a third-party unaffiliated with OANDA, and is intended for general circulation only. OANDA does not guarantee the accuracy of this information and assumes no responsibilities for the information provided by the third party. The information does not take into account the specific investment objectives, financial situation, or particular needs of any particular person. You should take into account your specific investment objectives, financial situation, and particular needs before making a commitment to trade, including seeking advice from an independent financial adviser regarding the suitability of the investment, under a separate engagement, as you deem fit.
You accept that you assume all risks in independently viewing the contents and selecting a chosen strategy.
Where the research is distributed in Singapore to a person who is not an Accredited Investor, Expert Investor or an Institutional Investor, Oanda Asia Pacific Pte Ltd (“OAP“) accepts legal responsibility for the contents of the report to such persons only to the extent required by law. Singapore customers should contact OAP at 6579 8289 for matters arising from, or in connection with, the information/research distributed.
Jpy
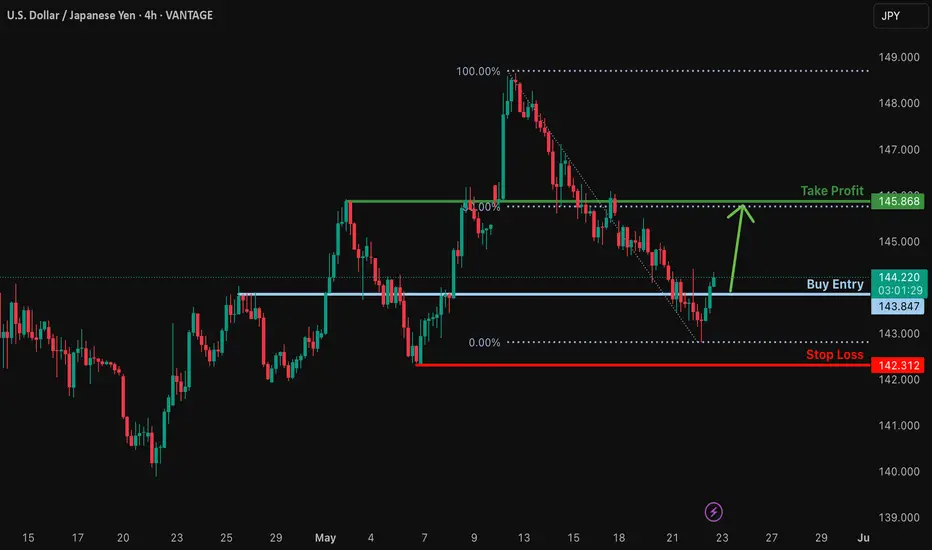
Potential bullish rise?USD/JPY is reacting off the support level which is a pullback support and could rise from this level to our take profit.
Entry: 143.84
Why we like it:
There is a pullback support level.
Stop loss: 142.31
Why we like it:
There is a pullback support level.
Take profit: 145.86
Why we like it:
There is a pullback resistance level that aligns with the 50% Fibonacci retracement.
Enjoying your TradingView experience? Review us!
Please be advised that the information presented on TradingView is provided to Vantage (‘Vantage Global Limited’, ‘we’) by a third-party provider (‘Everest Fortune Group’). Please be reminded that you are solely responsible for the trading decisions on your account. There is a very high degree of risk involved in trading. Any information and/or content is intended entirely for research, educational and informational purposes only and does not constitute investment or consultation advice or investment strategy. The information is not tailored to the investment needs of any specific person and therefore does not involve a consideration of any of the investment objectives, financial situation or needs of any viewer that may receive it. Kindly also note that past performance is not a reliable indicator of future results. Actual results may differ materially from those anticipated in forward-looking or past performance statements. We assume no liability as to the accuracy or completeness of any of the information and/or content provided herein and the Company cannot be held responsible for any omission, mistake nor for any loss or damage including without limitation to any loss of profit which may arise from reliance on any information supplied by Everest Fortune Group.
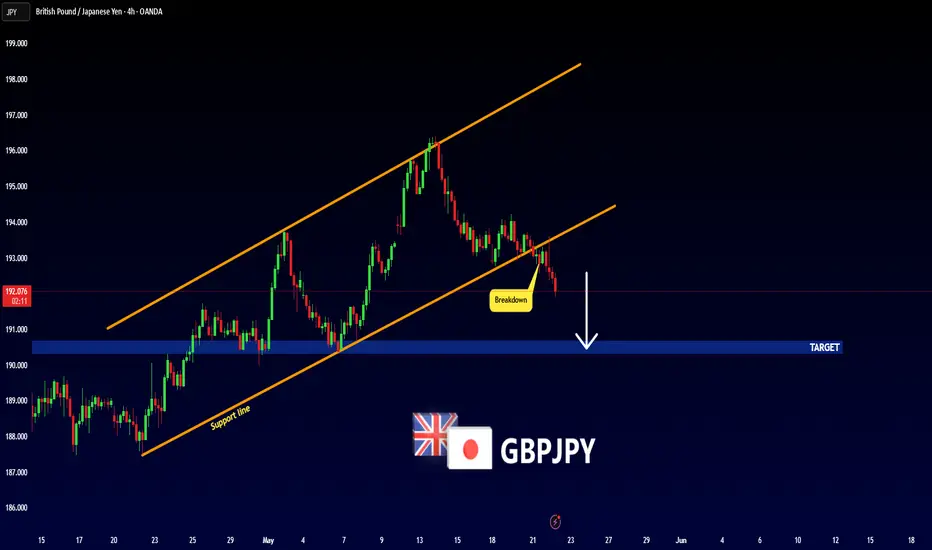
GBPJPY - Important BreakdownHello Traders !
The GBPJPY failed to create a new higher high.
The price broke the support line!
So, I expect a bearish move📉
________________
TARGET: 190.680🎯
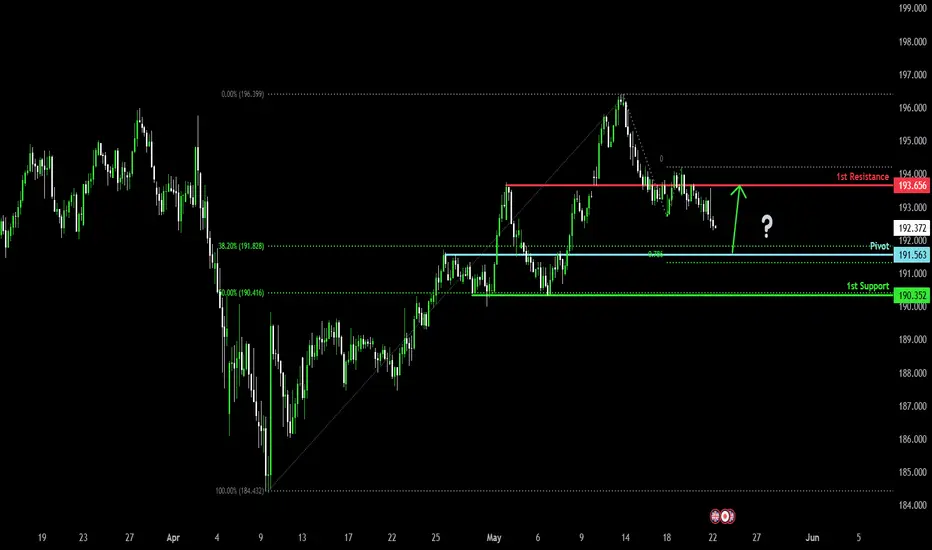
Falling towards 38.2% Fibonacci support?GBP/JPY is falling towards the pivot and could bounce to the 1st, pullback resistance.
Pivot: 191.56
1st Support: 190.35
1st Resistance: 193.65
Risk Warning:
Trading Forex and CFDs carries a high level of risk to your capital and you should only trade with money you can afford to lose. Trading Forex and CFDs may not be suitable for all investors, so please ensure that you fully understand the risks involved and seek independent advice if necessary.
Disclaimer:
The above opinions given constitute general market commentary, and do not constitute the opinion or advice of IC Markets or any form of personal or investment advice.
Any opinions, news, research, analyses, prices, other information, or links to third-party sites contained on this website are provided on an "as-is" basis, are intended only to be informative, is not an advice nor a recommendation, nor research, or a record of our trading prices, or an offer of, or solicitation for a transaction in any financial instrument and thus should not be treated as such. The information provided does not involve any specific investment objectives, financial situation and needs of any specific person who may receive it. Please be aware, that past performance is not a reliable indicator of future performance and/or results. Past Performance or Forward-looking scenarios based upon the reasonable beliefs of the third-party provider are not a guarantee of future performance. Actual results may differ materially from those anticipated in forward-looking or past performance statements. IC Markets makes no representation or warranty and assumes no liability as to the accuracy or completeness of the information provided, nor any loss arising from any investment based on a recommendation, forecast or any information supplied by any third-party.
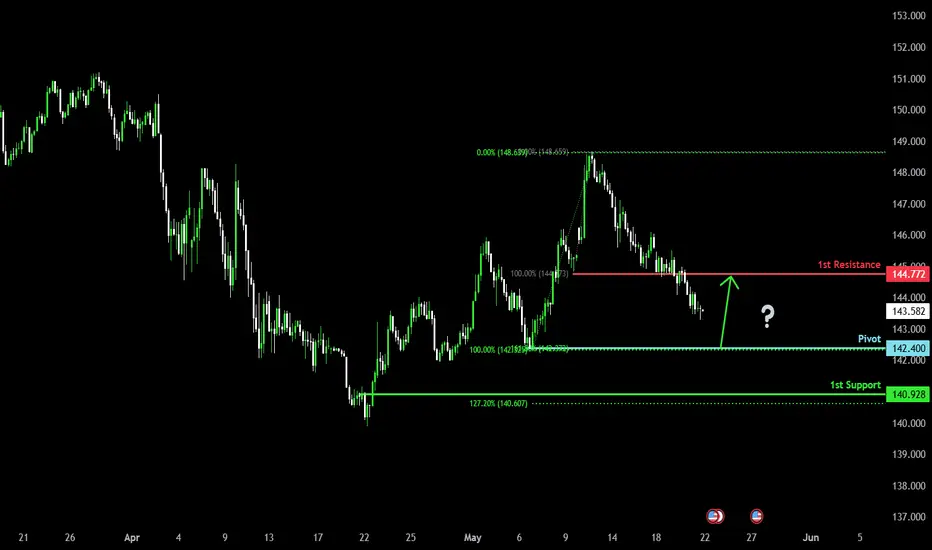
Falling towards pullback support?USDJPY is falling towards the pivot which is a pullback support and could bounce to the 1st resistance.
Pivot: 142.400
1st Support: 140.92
1st Resistance: 144.77
Risk Warning:
Trading Forex and CFDs carries a high level of risk to your capital and you should only trade with money you can afford to lose. Trading Forex and CFDs may not be suitable for all investors, so please ensure that you fully understand the risks involved and seek independent advice if necessary.
Disclaimer:
The above opinions given constitute general market commentary, and do not constitute the opinion or advice of IC Markets or any form of personal or investment advice.
Any opinions, news, research, analyses, prices, other information, or links to third-party sites contained on this website are provided on an "as-is" basis, are intended only to be informative, is not an advice nor a recommendation, nor research, or a record of our trading prices, or an offer of, or solicitation for a transaction in any financial instrument and thus should not be treated as such. The information provided does not involve any specific investment objectives, financial situation and needs of any specific person who may receive it. Please be aware, that past performance is not a reliable indicator of future performance and/or results. Past Performance or Forward-looking scenarios based upon the reasonable beliefs of the third-party provider are not a guarantee of future performance. Actual results may differ materially from those anticipated in forward-looking or past performance statements. IC Markets makes no representation or warranty and assumes no liability as to the accuracy or completeness of the information provided, nor any loss arising from any investment based on a recommendation, forecast or any information supplied by any third-party.
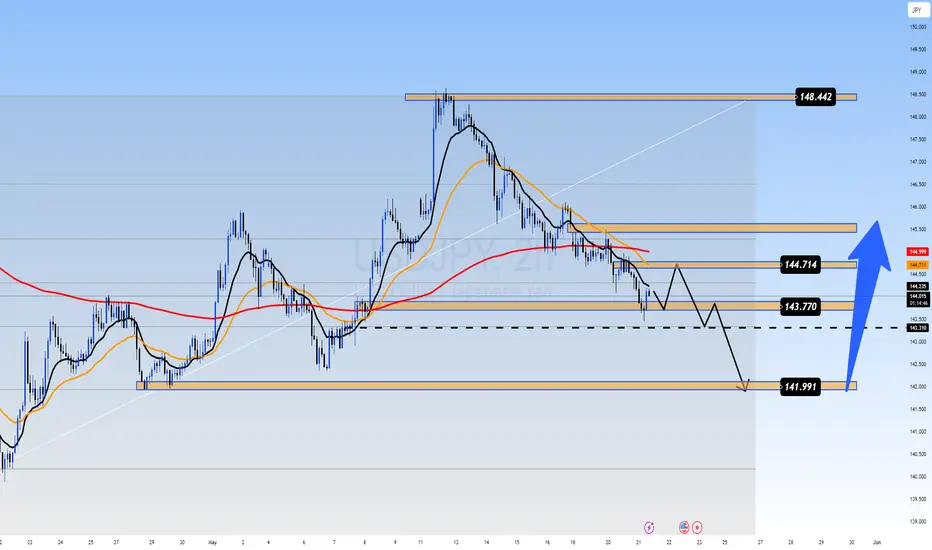
USDJPY TRADE PLAN – MAY 21 BIG BREAKOUT AHEAD?USDJPY TRADE PLAN – MAY 21 | FED HAWKISH BUT YEN STAYS WEAK – BIG BREAKOUT AHEAD?
USDJPY is entering a critical technical zone as the market weighs the Fed’s persistent hawkish stance against Japan’s passive approach to the Yen’s depreciation. After a strong rally, we are seeing a potential exhaustion with key levels in play.
🌍 MACRO CONTEXT:
FED remains hawkish: Officials continue to support higher-for-longer interest rates to tame inflation → USD remains firm.
Bank of Japan silence: No signs of FX intervention or rate policy shift, causing ongoing weakness in JPY.
Risk sentiment neutral: Risk-off flows are muted; USDJPY remains trapped in a wide range – awaiting macro catalysts.
📊 TECHNICAL OUTLOOK (H2 CHART):
Price is now correcting within a falling channel.
Price broke below the MA200 and rising trendline, now retesting a key support zone at 143.77.
The current range 141.99 – 144.71 is critical – a breakout from either end may dictate the next medium-term direction.
🎯 TRADE SETUPS FOR TODAY:
✅ SCENARIO A – SELL THE RALLY (PRIMARY BIAS):
If price rejects 144.71:
SELL ZONE: 144.70 – 144.71
SL: 145.10
TP: 143.77 → 143.30 → 142.50 → 141.99
→ Key resistance area – price may trigger strong seller interest.
✅ SCENARIO B – SELL ON BREAKDOWN:
If price breaks 143.77 and retests:
SELL ZONE: 143.60 – 143.70 (post-breakdown entry)
SL: 144.10
TP: 142.50 → 142.00 → 141.99
✅ SCENARIO C – SHORT-TERM BUY (LESS FAVORABLE):
If price reacts positively at 141.99 with bullish confirmation:
BUY ZONE: 141.90 – 141.99
SL: 141.50
TP: 142.50 → 143.00 → 143.77
→ Only take this setup if strong reversal signals appear.
🔑 KEY LEVELS TO WATCH:
Resistance: 144.71 – 145.00 – 148.44
Support: 143.77 – 143.30 – 141.99 – 141.20
📌 FINAL THOUGHTS:
USDJPY remains in a volatile consolidation zone, pressured by a hawkish Fed but lacking JPY strength. Watch for PMI data and Fed comments this week for directional cues. Until then, respect the current range and trade with discipline.
📣 Bias favors SELL from 144.71 unless buyers reclaim full control – trade the reaction, not the prediction!
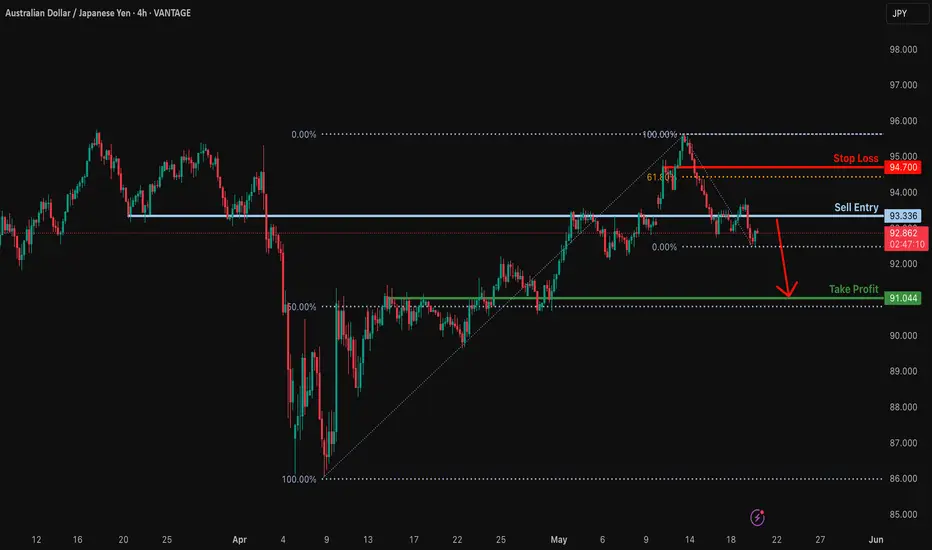
Potential bearish drop?AUD/JPY has rejected off the resistance level which is a pullbac resistance and could drop from this level to our take profit.
Entry: 93.33
Why we like it:
There is a pullback resistance leel.
Stop loss: 94.70
Why we like it:
There is a pullback resistance level that i slightly above the 61.8% Fibonacci retracement.
Take profit: 91.04
Why we like it:
There is an overlap support level that lines up with the 50% Fibonacci retracement.
Enjoying your TradingView experience? Review us!
Please be advised that the information presented on TradingView is provided to Vantage (‘Vantage Global Limited’, ‘we’) by a third-party provider (‘Everest Fortune Group’). Please be reminded that you are solely responsible for the trading decisions on your account. There is a very high degree of risk involved in trading. Any information and/or content is intended entirely for research, educational and informational purposes only and does not constitute investment or consultation advice or investment strategy. The information is not tailored to the investment needs of any specific person and therefore does not involve a consideration of any of the investment objectives, financial situation or needs of any viewer that may receive it. Kindly also note that past performance is not a reliable indicator of future results. Actual results may differ materially from those anticipated in forward-looking or past performance statements. We assume no liability as to the accuracy or completeness of any of the information and/or content provided herein and the Company cannot be held responsible for any omission, mistake nor for any loss or damage including without limitation to any loss of profit which may arise from reliance on any information supplied by Everest Fortune Group.
THIS IS CHF/JPY ANALYSIS EXPECT BIG MOVE TO HAPPEN As we can see CHF/JPY was making pullback moves toward the demand level, at the moment we're going to wait for change in the character to happen before start looking for buying opportunities. Keep eyes in 4 hours time frame see yo. Trade safe

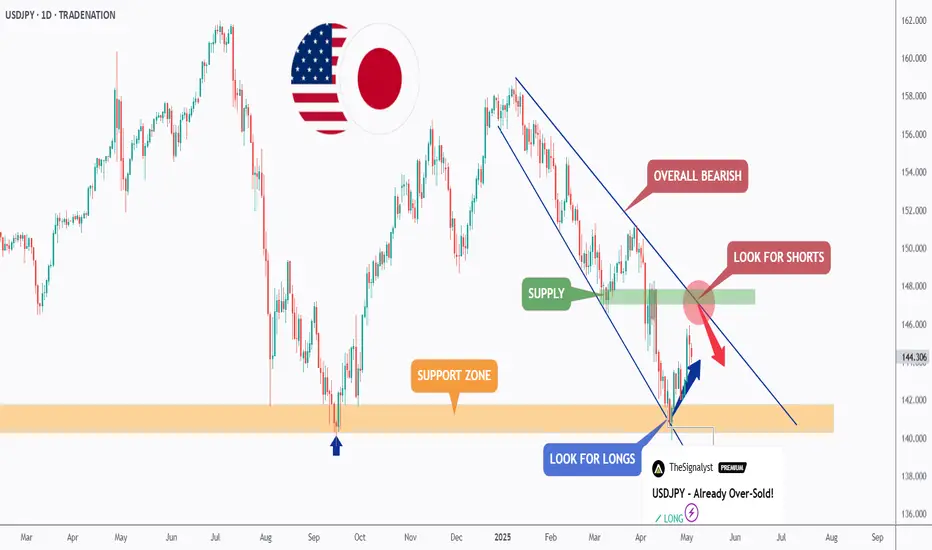
USDJPY - Long Done, Soon Short!Hello TradingView Family / Fellow Traders. This is Richard, also known as theSignalyst.
📈As per our last USDJPY analysis, it rejected the orange support zone and has been trading higher.
What's next? As USDJPY approaches the upper blue trendline, we will be looking for shorts.
🏹 The highlighted red circle is a strong area to look for sell setups as it is the intersection of the upper blue trendline and green supply zone.
📚 As per my trading style:
As #USDJPY retests the red circle zone, I will be looking for bearish reversal setups (like a double top pattern, trendline break , and so on...)
Meanwhile, USDJPY would remain bullish medium-term and a bullish continuation towards the red circle is expected.
📚 Always follow your trading plan regarding entry, risk management, and trade management.
Good luck!
All Strategies Are Good; If Managed Properly!
~Rich
Disclosure: I am part of Trade Nation's Influencer program and receive a monthly fee for using their TradingView charts in my analysis.
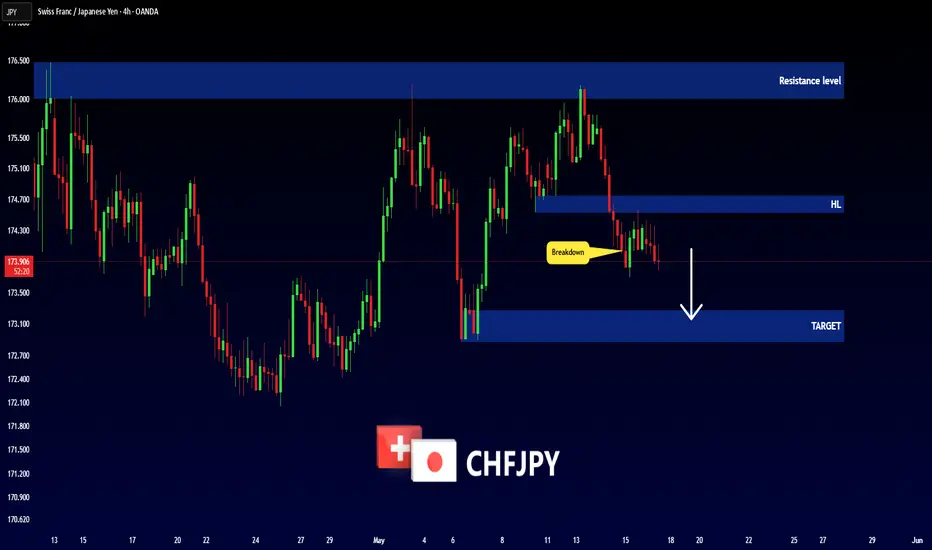
CHFJPY - BEARISH MOVEHello Traders !
On Tuesday 13 May, The CHFJPY reached a strong resistance level (176.482 - 176.010).
The price broke the higher low (change of character).
So, I expect a bearish move📉
________________
TARGET: 173.280🎯
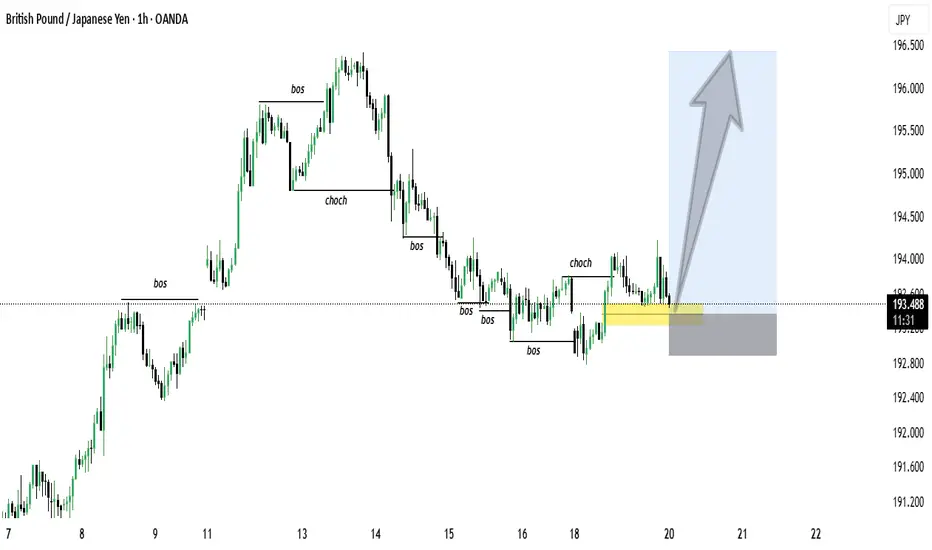
GBP/JPY 1H Chart Analysis – Bullish Breakout PotentialPublished on May 20, 2025, this 1-hour GBP/JPY chart highlights a key technical setup. The price has been consolidating within a tight range after a sharp decline, forming a potential accumulation zone between 193.47 and 193.80 (yellow rectangle). Multiple tests of the "BOS" (Break of Structure) levels indicate strong support and resistance zones, with a recent "CHOCH" (Change of Character) signaling a shift in momentum.
The price is now approaching a critical resistance at 193.80. A breakout above this level could confirm a bullish trend, potentially targeting 195.00 and beyond (blue arrow). Traders should watch for a strong close above 193.80 with increased volume to validate the breakout. Conversely, a rejection at this level may lead to a retest of the lower support at 193.47.
Key Levels:
Support: 193.47
Resistance: 193.80
Potential Target: 195.00+
Stay cautious of false breakouts and monitor price action closely! #GBPJPY #Forex
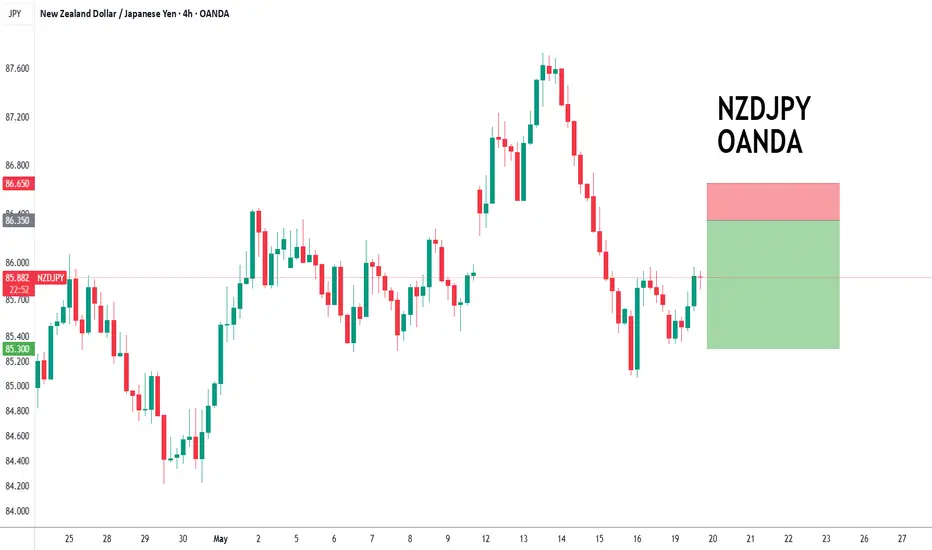
NZDJPY to find sellers at previous resistance?NZDJPY - 24h expiry
Price action looks to be forming a top.
Short term RSI is moving higher.
We look for a temporary move higher.
Preferred trade is to sell into rallies.
Bespoke resistance is located at 86.35.
We look to Sell at 86.35 (stop at 86.65)
Our profit targets will be 85.30 and 85.00
Resistance: 86.30 / 86.80 / 87.20
Support: 85.30 / 85.00 / 84.50
Risk Disclaimer
The trade ideas beyond this page are for informational purposes only and do not constitute investment advice or a solicitation to trade. This information is provided by Signal Centre, a third-party unaffiliated with OANDA, and is intended for general circulation only. OANDA does not guarantee the accuracy of this information and assumes no responsibilities for the information provided by the third party. The information does not take into account the specific investment objectives, financial situation, or particular needs of any particular person. You should take into account your specific investment objectives, financial situation, and particular needs before making a commitment to trade, including seeking advice from an independent financial adviser regarding the suitability of the investment, under a separate engagement, as you deem fit.
You accept that you assume all risks in independently viewing the contents and selecting a chosen strategy.
Where the research is distributed in Singapore to a person who is not an Accredited Investor, Expert Investor or an Institutional Investor, Oanda Asia Pacific Pte Ltd (“OAP“) accepts legal responsibility for the contents of the report to such persons only to the extent required by law. Singapore customers should contact OAP at 6579 8289 for matters arising from, or in connection with, the information/research distributed.
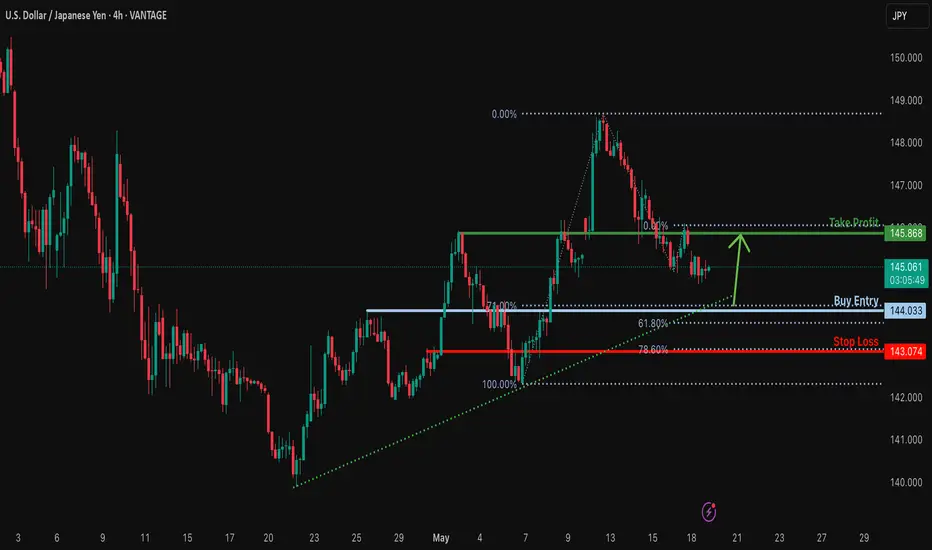
Could the price bounce from here?USD/JPY is falling towards the support level which is a pullback support that lines up with the 71% Fibonacci retracement and also lslightly above the 61.8% Fibonacci projection and could bounce from this level to our take profit.
Entry: 144.03
Why we like it:
There is a pullback support level that lines up with the 71% Fibonacci retracement.
Stop loss: 143.07
Why we like it:
There is a pullback support level that lines up with the 78.6% Fibonacci projection.
Take profit: 145.86
Why we like it:
There is an overlap resistance level.
Enjoying your TradingView experience? Review us!
Please be advised that the information presented on TradingView is provided to Vantage (‘Vantage Global Limited’, ‘we’) by a third-party provider (‘Everest Fortune Group’). Please be reminded that you are solely responsible for the trading decisions on your account. There is a very high degree of risk involved in trading. Any information and/or content is intended entirely for research, educational and informational purposes only and does not constitute investment or consultation advice or investment strategy. The information is not tailored to the investment needs of any specific person and therefore does not involve a consideration of any of the investment objectives, financial situation or needs of any viewer that may receive it. Kindly also note that past performance is not a reliable indicator of future results. Actual results may differ materially from those anticipated in forward-looking or past performance statements. We assume no liability as to the accuracy or completeness of any of the information and/or content provided herein and the Company cannot be held responsible for any omission, mistake nor for any loss or damage including without limitation to any loss of profit which may arise from reliance on any information supplied by Everest Fortune Group.
Bullish bounce off pullback support?USD/JPY is falling towards the pivot and could bounce to the 78.6% Fibonacci resistance.
Pivot: 143.80
1st Support: 140.52
1st Resistance: 148.62
Risk Warning:
Trading Forex and CFDs carries a high level of risk to your capital and you should only trade with money you can afford to lose. Trading Forex and CFDs may not be suitable for all investors, so please ensure that you fully understand the risks involved and seek independent advice if necessary.
Disclaimer:
The above opinions given constitute general market commentary, and do not constitute the opinion or advice of IC Markets or any form of personal or investment advice.
Any opinions, news, research, analyses, prices, other information, or links to third-party sites contained on this website are provided on an "as-is" basis, are intended only to be informative, is not an advice nor a recommendation, nor research, or a record of our trading prices, or an offer of, or solicitation for a transaction in any financial instrument and thus should not be treated as such. The information provided does not involve any specific investment objectives, financial situation and needs of any specific person who may receive it. Please be aware, that past performance is not a reliable indicator of future performance and/or results. Past Performance or Forward-looking scenarios based upon the reasonable beliefs of the third-party provider are not a guarantee of future performance. Actual results may differ materially from those anticipated in forward-looking or past performance statements. IC Markets makes no representation or warranty and assumes no liability as to the accuracy or completeness of the information provided, nor any loss arising from any investment based on a recommendation, forecast or any information supplied by any third-party.

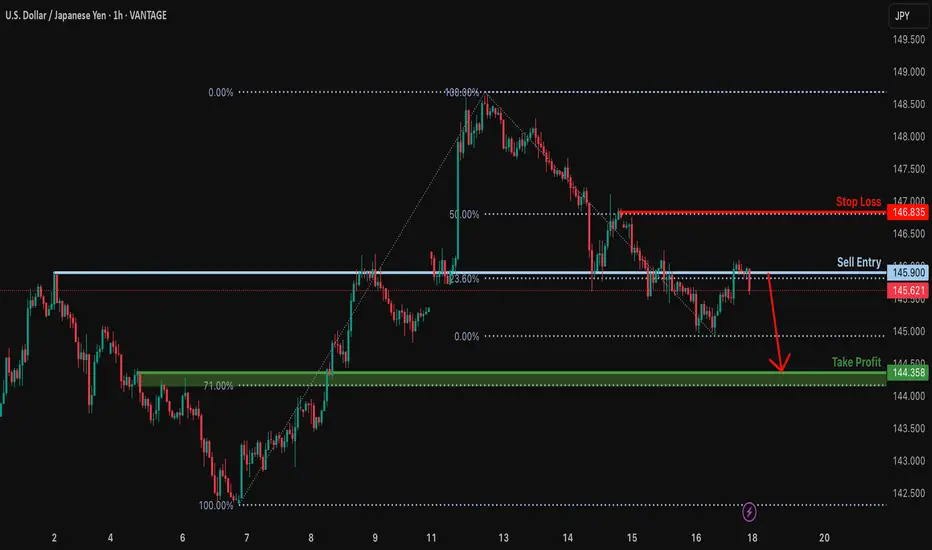
Potential bearish drop?USD/JPY is reacting off the resistance level which is an overlap resistance that lines up with the 23.6% Fibonacci retracement and could drop from this level to our take profit.
Entry: 145.90
Why we like it:
There is an overlap resistance level that lines up with the 23.6% Fibonacci retracement.
Stop loss: 146.83
Why we like it:
There is a pullback resistance level that aligns with the 50% Fibonacci retracement.
Take profit: 144.35
Why we like it:
There is a pullback support level that is slightly above the 71% Fibonacci retracement.
Enjoying your TradingView experience? Review us!
Please be advised that the information presented on TradingView is provided to Vantage (‘Vantage Global Limited’, ‘we’) by a third-party provider (‘Everest Fortune Group’). Please be reminded that you are solely responsible for the trading decisions on your account. There is a very high degree of risk involved in trading. Any information and/or content is intended entirely for research, educational and informational purposes only and does not constitute investment or consultation advice or investment strategy. The information is not tailored to the investment needs of any specific person and therefore does not involve a consideration of any of the investment objectives, financial situation or needs of any viewer that may receive it. Kindly also note that past performance is not a reliable indicator of future results. Actual results may differ materially from those anticipated in forward-looking or past performance statements. We assume no liability as to the accuracy or completeness of any of the information and/or content provided herein and the Company cannot be held responsible for any omission, mistake nor for any loss or damage including without limitation to any loss of profit which may arise from reliance on any information supplied by Everest Fortune Group.
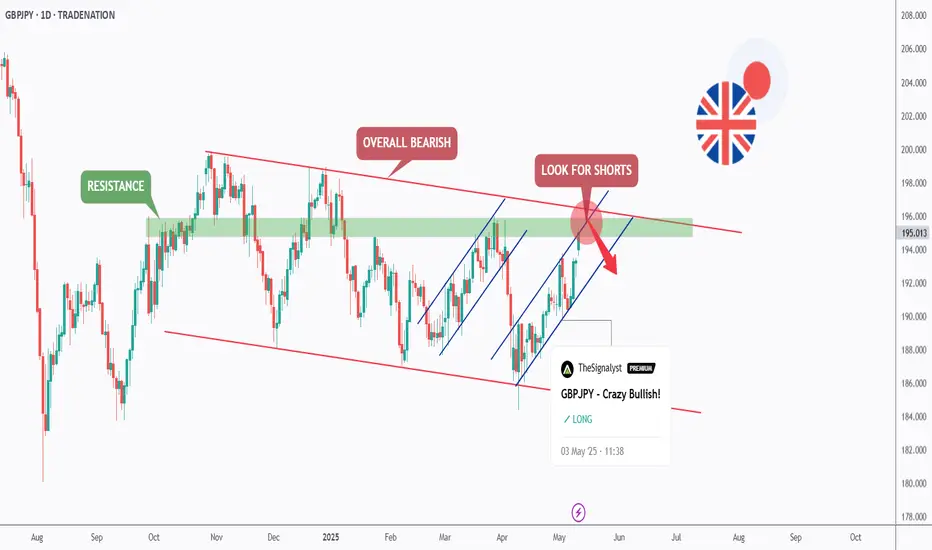
GBPJPY - Bullish No More!Hello TradingView Family / Fellow Traders. This is Richard, also known as theSignalyst.
📈As per our last GBPJPY analysis (attached on the chart), it rejected the lower bound of the rising blue channel.
What's next?
GBPJPY is currently approaching the upper bound of its falling trend marked in red.
Moreover, the green zone is a strong structure and resistance.
🏹 Thus, the highlighted red circle is a strong area to look for sell setups as it is the intersection of structure and upper red trendline acting as a non-horizontal resistance.
📚 As per my trading style:
As #GBPJPY approaches the red circle zone, I will be looking for bearish reversal setups (like a double top pattern, trendline break , and so on...)
📚 Always follow your trading plan regarding entry, risk management, and trade management.
Good luck!
All Strategies Are Good; If Managed Properly!
~Rich
Disclosure: I am part of Trade Nation's Influencer program and receive a monthly fee for using their TradingView charts in my analysis.
Will AUDJPY rebound?FX_IDC:AUDJPY had recently corrected lower, but continues to trade above a broken downside resistance line. Will we see a push back up anytime soon?
Let's dig in...
MARKETSCOM:AUDJPY
Let us know what you think in the comments below.
Thank you.
77.3% of retail investor accounts lose money when trading CFDs with this provider. You should consider whether you understand how CFDs work and whether you can afford to take the high risk of losing your money. Past performance is not necessarily indicative of future results. The value of investments may fall as well as rise and the investor may not get back the amount initially invested. This content is not intended for nor applicable to residents of the UK. Cryptocurrency CFDs and spread bets are restricted in the UK for all retail clients.

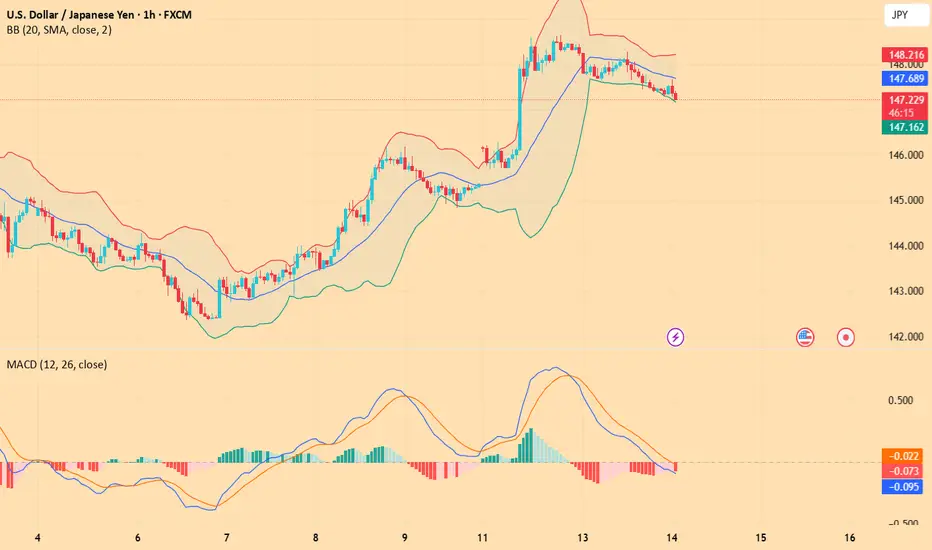
USD/JPY(20250516)Today's AnalysisMarket news:
Fed Chairman Powell: The Fed is adjusting its overall policy-making framework. Zero interest rate is no longer a basic situation. The wording of underemployment and average inflation rate needs to be reconsidered. PCE is expected to drop to 2.2% in April.
Technical analysis:
Today's buying and selling boundaries:
145.93
Support and resistance levels:
147.26
146.77
146.44
145.42
145.10
144.61
Trading strategy:
If the price breaks through 145.93, consider buying, the first target price is 146.44
If the price breaks through 145.42, consider selling, the first target price is 145.10
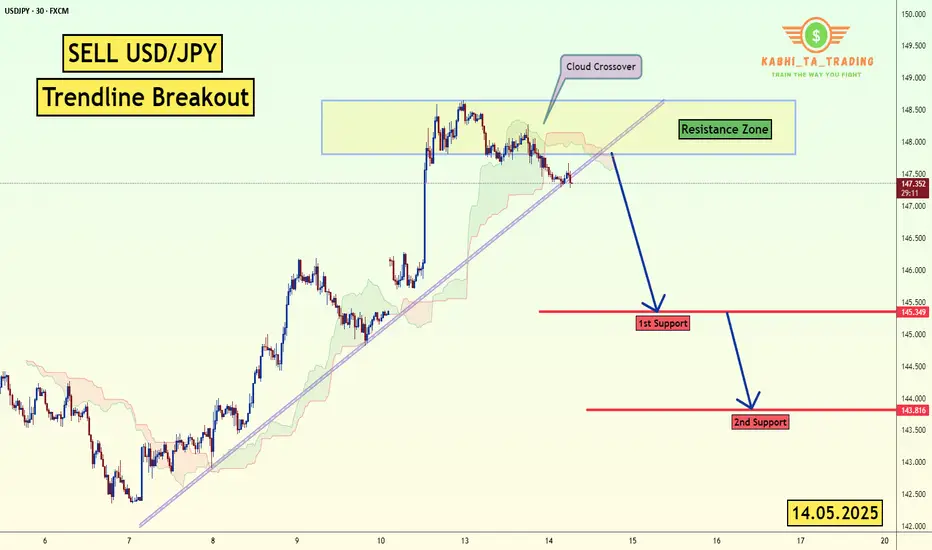
USD/JPY - Trendline Breakout (14.05.2025)The USD/JPY Pair on the M30 timeframe presents a Potential Selling Opportunity due to a recent Formation of a Trendline Breakout Pattern. This suggests a shift in momentum towards the downside in the coming hours.
Possible Short Trade:
Entry: Consider Entering A Short Position around Trendline Of The Pattern.
Target Levels:
1st Support – 145.34
2nd Support – 143.81
🎁 Please hit the like button and
🎁 Leave a comment to support for My Post !
Your likes and comments are incredibly motivating and will encourage me to share more analysis with you.
Best Regards, KABHI_TA_TRADING
Thank you.
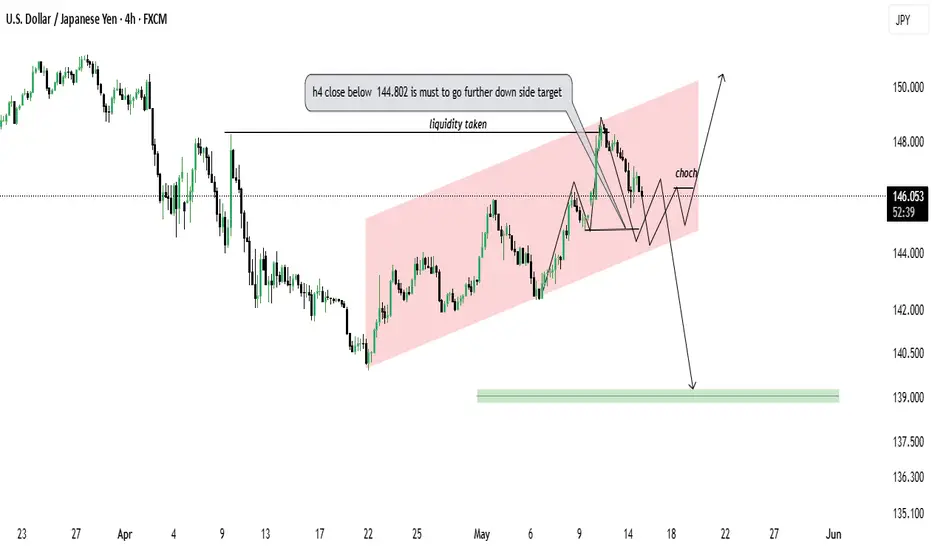
USD/JPY 4H Chart Analysis – Potential Breakdown or Reversal
**USD/JPY 4H Chart Analysis – Potential Breakdown or Reversal**
**Technical Summary:**
The chart shows USD/JPY trading within a rising channel, with recent price action indicating a possible bearish shift. Liquidity above a recent high has been taken, followed by a **change of character (CHoCH)** suggesting potential bearish intent.
**Key Highlights:**
* **Liquidity Grab:** Price swept prior highs, likely triggering buy-side liquidity.
* **CHoCH Identified:** Structure broke to the downside, indicating a bearish shift in market sentiment.
* **Critical Level:** A **4H close below 144.802** is crucial for confirmation of further downside movement.
* **Channel Support:** Price is currently testing the lower boundary of the ascending channel.
* **Scenarios:**
* **Bullish Case:** If the price respects the channel and pushes higher, targets near **150.000** could come into play.
* **Bearish Case:** A confirmed breakdown below **144.802** opens the path toward the **139.000 demand zone**.
**Outlook:**
* Monitor for 4H candle close below 144.802 for bearish confirmation.
* Alternatively, bullish continuation is valid if support holds and structure shifts upward again.
**Disclaimer:** This analysis is for educational purposes only. Always conduct your own research before making trading decisions.
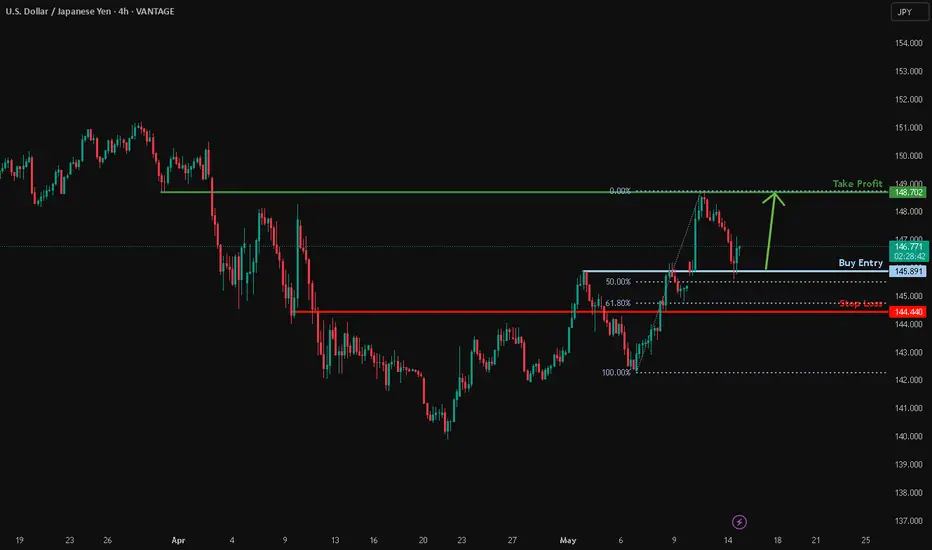
Potential bullish bounce?USD/JPY has bounced off the support level which is a pullback support that is slightly above the 50% Fibonacci retracement and could rise from this level to our take profit.
Entry: 145.89
Why we like it:
There is a pullback support level which is a pullback support that is slightly above the 50% Fibonacci retracement.
Stop loss: 144.44
Why we like it:
There is a pullback support level that is slightly below the 61.8% Fibonacci retracement.
Take profit: 148.70
Why we like it:
There is a pullback resistance level.
Enjoying your TradingView experience? Review us!
Please be advised that the information presented on TradingView is provided to Vantage (‘Vantage Global Limited’, ‘we’) by a third-party provider (‘Everest Fortune Group’). Please be reminded that you are solely responsible for the trading decisions on your account. There is a very high degree of risk involved in trading. Any information and/or content is intended entirely for research, educational and informational purposes only and does not constitute investment or consultation advice or investment strategy. The information is not tailored to the investment needs of any specific person and therefore does not involve a consideration of any of the investment objectives, financial situation or needs of any viewer that may receive it. Kindly also note that past performance is not a reliable indicator of future results. Actual results may differ materially from those anticipated in forward-looking or past performance statements. We assume no liability as to the accuracy or completeness of any of the information and/or content provided herein and the Company cannot be held responsible for any omission, mistake nor for any loss or damage including without limitation to any loss of profit which may arise from reliance on any information supplied by Everest Fortune Group.
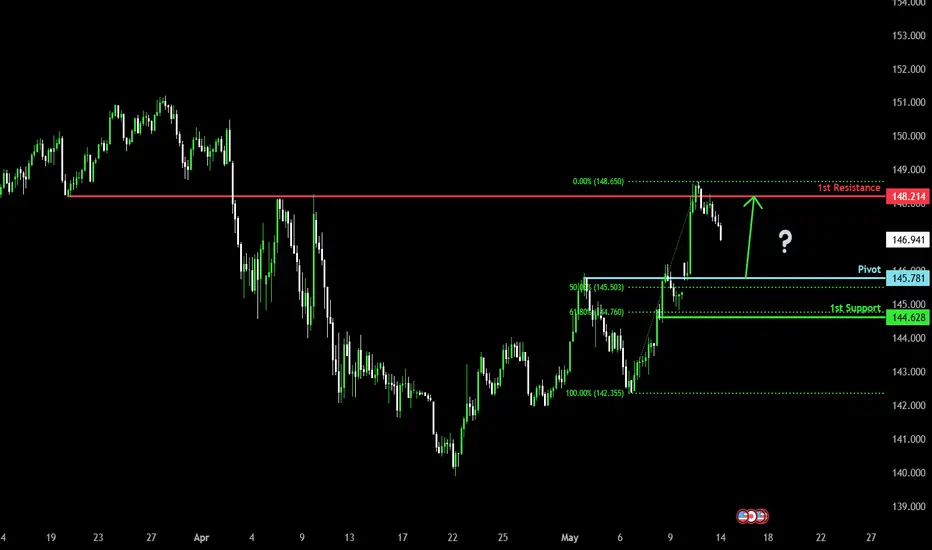
Bullish bounce off pullback support?USD/JPY is falling towards the pivot, which is a pullback support and could bounce to the 1st resistance identified as an overlap resistance.
Pivot: 145.78
1st Support: 144.62
1st Resistance: 148.21
Risk Warning:
Trading Forex and CFDs carries a high level of risk to your capital and you should only trade with money you can afford to lose. Trading Forex and CFDs may not be suitable for all investors, so please ensure that you fully understand the risks involved and seek independent advice if necessary.
Disclaimer:
The above opinions given constitute general market commentary, and do not constitute the opinion or advice of IC Markets or any form of personal or investment advice.
Any opinions, news, research, analyses, prices, other information, or links to third-party sites contained on this website are provided on an "as-is" basis, are intended only to be informative, is not an advice nor a recommendation, nor research, or a record of our trading prices, or an offer of, or solicitation for a transaction in any financial instrument and thus should not be treated as such. The information provided does not involve any specific investment objectives, financial situation and needs of any specific person who may receive it. Please be aware, that past performance is not a reliable indicator of future performance and/or results. Past Performance or Forward-looking scenarios based upon the reasonable beliefs of the third-party provider are not a guarantee of future performance. Actual results may differ materially from those anticipated in forward-looking or past performance statements. IC Markets makes no representation or warranty and assumes no liability as to the accuracy or completeness of the information provided, nor any loss arising from any investment based on a recommendation, forecast or any information supplied by any third-party.
USD/JPY(20250514)Today's AnalysisMarket news:
The U.S. unadjusted CPI annual rate unexpectedly dropped to 2.3% in April, the lowest since February 2021.
Technical analysis:
Today's buying and selling boundaries:
147.76
Support and resistance levels:
148.83
148.43
148.17
147.34
147.08
146.68
Trading strategy:
If the price breaks through 147.76, consider buying, the first target price is 148.17
If the price breaks through 147.34, consider selling, the first target price is 147.08