JTO/USDT at the Edge of Pressure – Breakout or Breakdown Ahead?🧠 Detailed Technical Analysis (2D Timeframe):
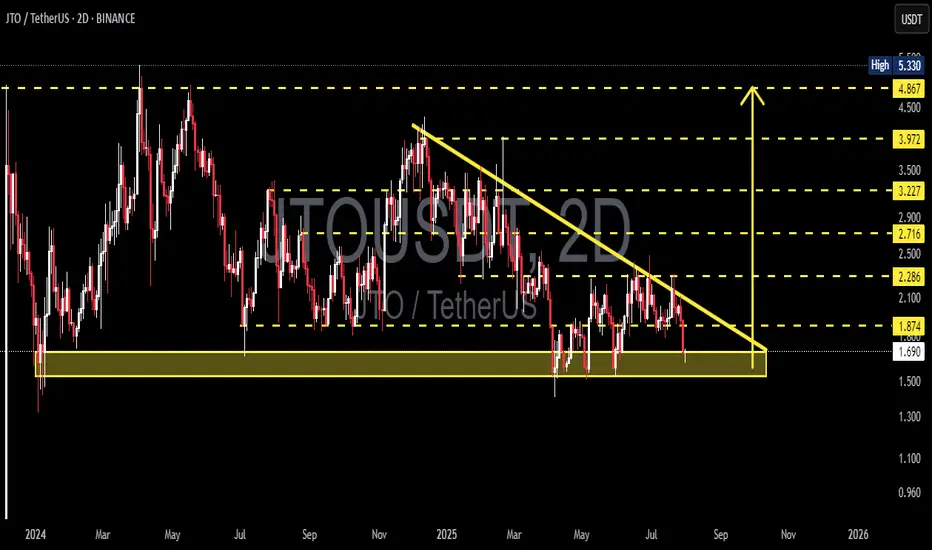
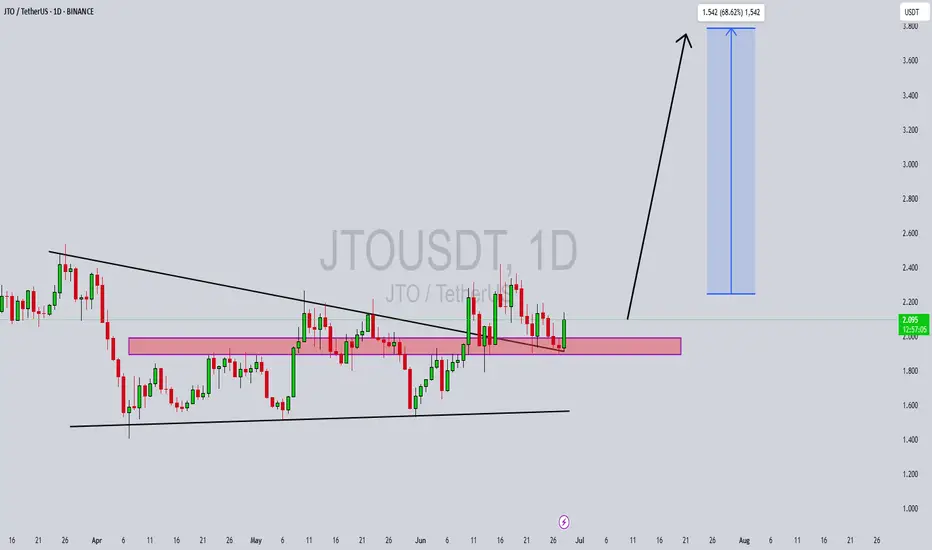
JTO/USDT is currently consolidating at a critical support zone within a well-defined Descending Triangle pattern that has been forming for over 6 months.
Key observations:
Price has been making lower highs, forming a downward-sloping resistance trendline.
Meanwhile, strong buying interest has held up the support zone between $1.69 and $1.87, suggesting accumulation.
This creates a classic Descending Triangle, often leading to a sharp breakout or breakdown.
---
📌 Key Levels:
Level Description
$1.69–$1.87 Major Demand Zone / Key Support
Descending Trendline Dynamic Resistance (from Lower Highs)
$2.29 First Resistance (Breakout Trigger)
$2.71 Key Mid-Term Resistance
$3.22 – $3.97 Major Upside Targets
$1.50 & $1.30 Breakdown Targets
---
📈 Bullish Scenario (Breakout):
If the price holds the support and successfully breaks the descending trendline, we could see a strong bullish reversal:
Confirmation breakout may lead to a rally toward $2.29 → $2.71 → $3.22 → up to $3.97.
Breakout strength increases if accompanied by volume surge.
Bullish Catalysts:
Positive project fundamentals.
Volume squeeze near triangle apex.
RSI/MACD divergence (if present).
---
📉 Bearish Scenario (Breakdown):
If price closes below the $1.69 zone with conviction:
Descending triangle confirms as a bearish continuation.
Target downside to $1.50 and potentially $1.30.
Could signal distribution phase by larger players.
Bearish Confirmation: Strong 2D candle close below $1.69 with high volume.
---
🧩 Pattern Breakdown – Descending Triangle:
The pattern represents price compression between lower highs and a horizontal support.
Statistically, 70% of descending triangles resolve to the downside.
However, in oversold conditions or with bullish catalysts, it may lead to a powerful short squeeze breakout.
---
🧭 Summary & Strategy Insight:
JTO/USDT is nearing a decision point. At the edge of the triangle’s apex, volatility is likely to spike — with a strong move in either direction.
💡Possible Strategy:
Conservative entry: Wait for breakout confirmation above the trendline with volume.
Aggressive entry: Speculative buy near $1.70 with tight stop loss.
Avoid heavy positions until the breakout or breakdown confirms.
---
🧲 Suggested Post Title:
> "JTO/USDT at a Crossroads – Descending Triangle Set for Explosive Move?"
A breakout is imminent. Will you be ready?
#JTOUSDT #CryptoBreakout #DescendingTriangle #AltcoinSetup #TechnicalAnalysis #CryptoStrategy #ChartPatterns
Jtolong
#JTO/USDT#JTO
The price is moving within a descending channel on the 1-hour frame and is expected to break and continue upward.
We have a trend to stabilize above the 100 moving average once again.
We have a downtrend on the RSI indicator that supports the upward move with a breakout.
We have a support area at the lower boundary of the channel at 1.84, acting as strong support from which the price can rebound.
We have a major support area in green that pushed the price higher at 1.88.
Entry price: 1.96.
First target: 2.00.
Second target: 2.12.
Third target: 2.22.
To manage risk, don't forget stop loss and capital management.
When you reach the first target, save some profits and then change your stop order to an entry order.
For inquiries, please comment.
Thank you.

#JTO/USDT Forming Bullish Wave #JTO
The price is moving within a descending channel on the 1-hour frame, adhering well to it, and is on its way to breaking it strongly upwards and retesting it.
We have a bounce from the lower boundary of the descending channel. This support is at 1.73.
We have a downtrend on the RSI indicator that is about to be broken and retested, supporting the upside.
There is a major support area in green at 1.65, which represents a strong basis for the upside.
Don't forget a simple thing: ease and capital.
When you reach the first target, save some money and then change your stop-loss order to an entry order.
For inquiries, please leave a comment.
We have a trend to hold above the 100 Moving Average.
Entry price: 1.92.
First target: 2.046.
Second target: 2.15.
Third target: 2.28.
Don't forget a simple thing: ease and capital.
When you reach the first target, save some money and then change your stop-loss order to an entry order.
For inquiries, please leave a comment.
Thank you.

#JTO/USDT#JTO
The price is moving within a descending channel on the 1-hour frame, adhering well to it, and is heading toward a strong breakout and retest.
We are experiencing a rebound from the lower boundary of the descending channel, which is support at 2.08.
We are experiencing a downtrend on the RSI indicator that is about to be broken and retested, supporting the upward trend.
We are heading toward stability above the 100 Moving Average.
Entry price: 2.136
First target: 2.22
Second target: 2.32
Third target: 2.40
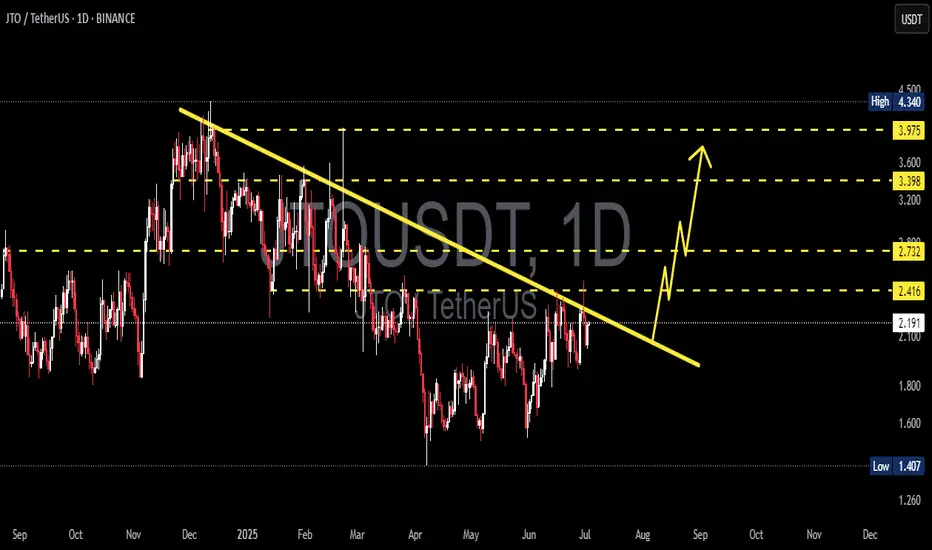
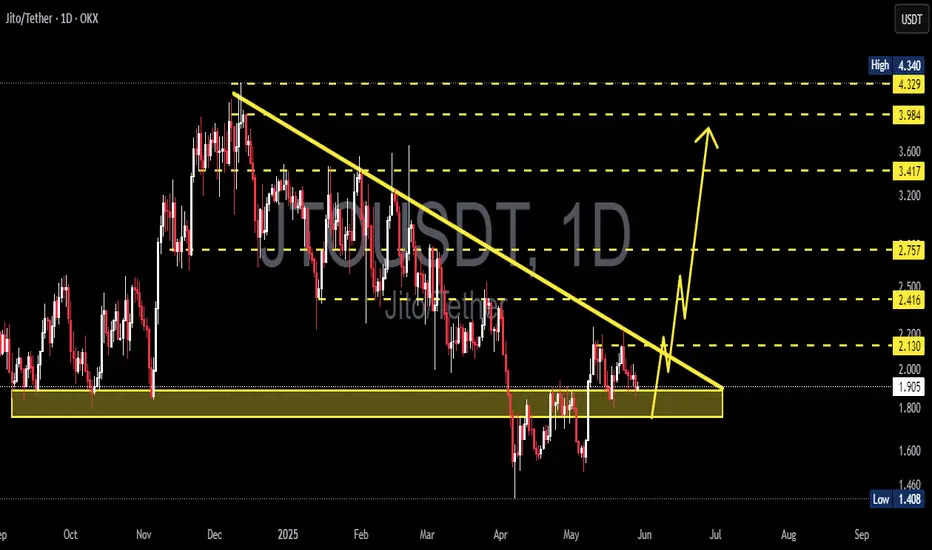
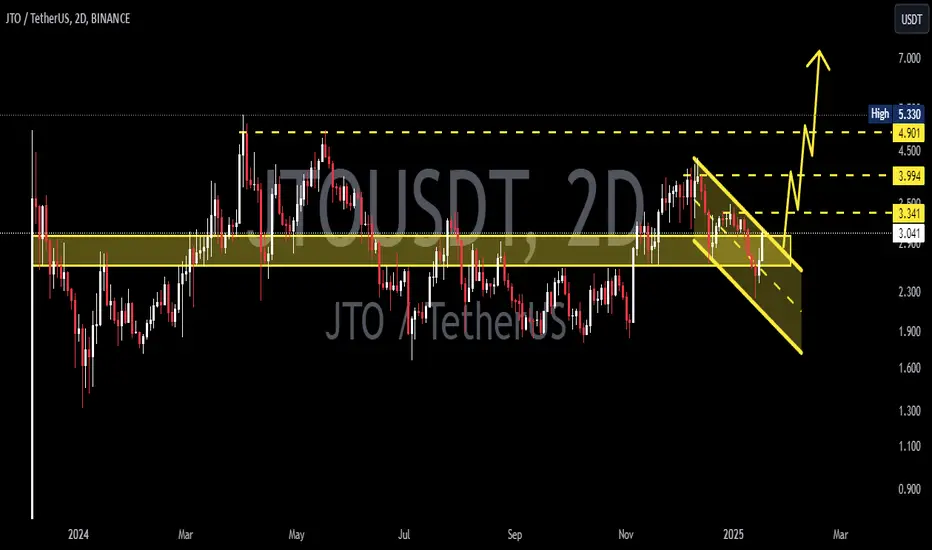
JTOUSDT Approaches Falling Wedge Breakout – Bullish Reversal?The chart indicates a major descending trendline resistance that has been tested multiple times since December 2024. Price action shows strong compression toward this resistance, suggesting a possible breakout moment.
🔄 Pattern Analysis: Falling Wedge
A Falling Wedge pattern is clearly visible:
This pattern typically signifies bullish reversal potential when formed in a downtrend.
Volume generally declines during the pattern and expands on the breakout.
The wedge begins around $3.97 and narrows down toward $2.18, where the current price action sits.
✅ Bullish Scenario:
If price breaks above the wedge resistance convincingly:
Breakout Confirmation Level: Around $2.42 (above the trendline and horizontal resistance)
Targets after breakout:
🎯 $2.73 – First major resistance
🎯 $3.39 – Mid-level resistance from previous structure
🎯 $3.97 – Key horizontal resistance and final wedge origin
🚀 Potential extension to $4.34 (previous swing high)
This would indicate a strong bullish trend resumption, especially if accompanied by high volume.
❌ Bearish Scenario:
If price fails to break above the wedge:
Possible rejection at $2.42, leading to:
🔻 Retest of support at $2.18
🔻 Further decline toward $1.40, the significant previous low
A breakdown below $2.18 would invalidate the wedge breakout and confirm bearish continuation.
⚠️ Key Technical Levels:
Support Zones: $2.18 – $1.40
Resistance Zones: $2.42 – $2.73 – $3.39 – $3.97 – $4.34
Pattern: Falling Wedge (Bullish Bias)
📌 Conclusion:
JTO/USDT is approaching a make-or-break zone. A successful breakout from the wedge could trigger a strong bullish rally, while failure may lead to further downside. Traders should monitor for volume confirmation on the breakout to validate direction.
#JTOUSDT #CryptoBreakout #FallingWedge #AltcoinAnalysis #CryptoTrading #BullishSetup #TechnicalAnalysis #ChartPattern #CryptoSignals
JTOUSDT Forming Bullish BreakoutJTOUSDT is showing a promising bullish setup as it trades within a clear accumulation zone, suggesting that a major breakout could be on the horizon. The chart highlights strong support where price has bounced multiple times, forming a solid base for a potential upward move. With good volume confirming renewed buying interest, the stage looks set for an expected gain of 50% to 60%+ if momentum continues to build. This level of price action is attracting the attention of smart money investors who are positioning early for the next leg up.
The recent price behavior indicates that JTOUSDT is approaching a decisive breakout level. The market structure shows that sellers are losing control, while buyers are stepping in aggressively around key demand zones. As the broader crypto market sentiment improves, coins like JTO that have established a clear support zone can benefit from additional capital inflow, amplifying the breakout potential. Traders should watch for a strong daily close above the resistance area to confirm the trend reversal.
Technical traders are eyeing JTOUSDT as a strong contender for mid-term gains due to its favorable risk-to-reward ratio. With liquidity building up and higher lows forming, the setup aligns well with classic breakout trading strategies. The projected upside, if confirmed, aligns with similar moves seen in altcoins following consolidation phases, which makes this trade idea even more compelling.
Keep monitoring trading volume and candlestick patterns closely for the next few sessions. A confirmed move above the resistance could lead to a rapid price expansion, rewarding patient traders. Managing risk with clear stop-loss levels below the support zone will be key to maximizing profit potential while protecting capital.
✅ Show your support by hitting the like button and
✅ Leaving a comment below! (What is You opinion about this Coin)
Your feedback and engagement keep me inspired to share more insightful market analysis with you!
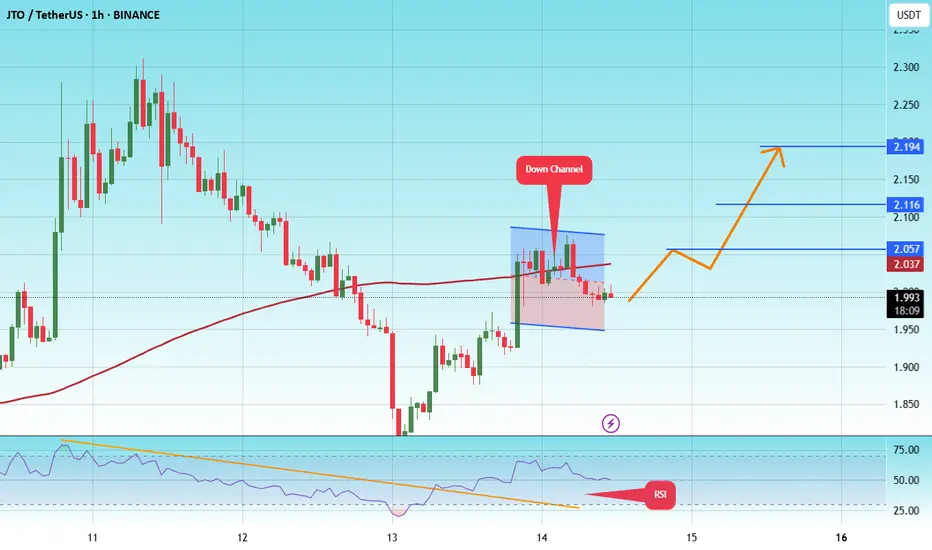
#JTO/USDT#JTO
The price is moving within a descending channel on the 1-hour frame and is expected to break and continue upward.
We have a trend to stabilize above the 100 moving average once again.
We have a downtrend on the RSI indicator that supports the upward move with a breakout.
We have a support area at the lower limit of the channel at 1.95, acting as strong support from which the price can rebound.
Entry price: 2.00
First target: 2.057
Second target: 2.11
Third target: 2.19
JTOUSDT Forming Bullish WaveJTOUSDT is currently shaping a promising bullish wave pattern, signaling potential continuation of an upward trend in the coming days or weeks. This wave formation is often associated with renewed buying interest and signals that price action is building strong momentum for another leg higher. Coupled with a steady increase in trading volume, the technical structure suggests that the asset may soon experience a substantial breakout. Based on historical wave behavior and key support/resistance levels, an expected gain of 50% to 60% appears realistic.
Market interest around JTO has been growing, with investors closely watching its price behavior as it consolidates above recent lows. This consolidation phase is often a prelude to significant rallies, especially when backed by solid wave structure and volume confirmation. As more liquidity enters the market, JTOUSDT is positioned to attract both swing traders and long-term holders seeking medium-risk, high-reward opportunities.
From a technical perspective, the coin is forming higher lows while testing critical resistance zones. If it manages to clear those levels with conviction, price targets could range between the upper Fibonacci extensions and prior distribution zones. The growing market chatter and improving sentiment around the JTO project further support the bullish thesis.
Keep an eye on upcoming market catalysts and macro trends, as they could amplify the bullish momentum already forming on the JTOUSDT chart. With a disciplined approach, this could become one of the standout performers in the mid-cap altcoin segment in the near term.
✅ Show your support by hitting the like button and
✅ Leaving a comment below! (What is You opinion about this Coin)
Your feedback and engagement keep me inspired to share more insightful market analysis with you!

JTOUSDT 1D AnalysisJTO ~ 1D Analysis
#JTO Buy gradually from here if you still have confidence in this coin with a short term target of at least 15%+ from here.
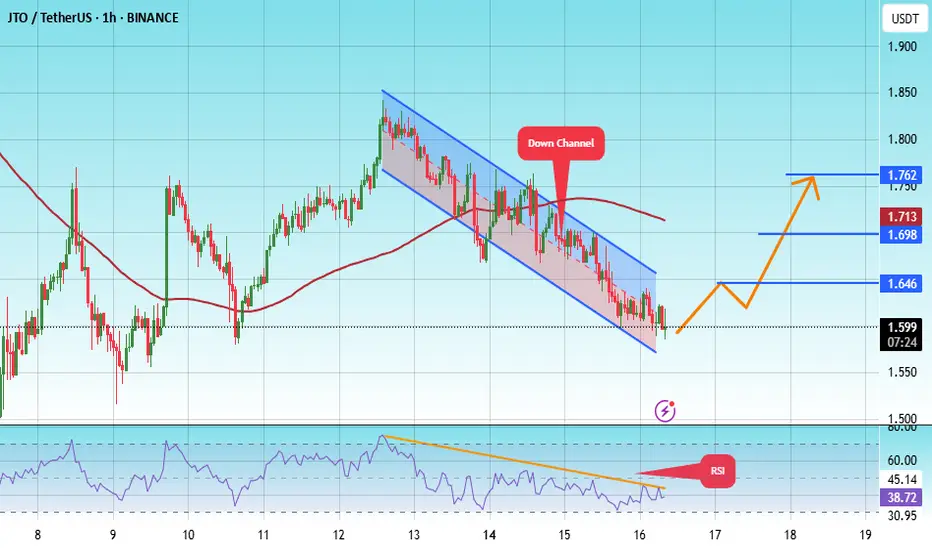
#JTO/USDT#JTO
The price is moving within a descending channel on the 1-hour frame, adhering well to it, and is heading for a strong breakout and retest.
We are seeing a bounce from the lower boundary of the descending channel, which is support at 1.57.
We have a downtrend on the RSI indicator that is about to break and retest, supporting the upward trend.
We are looking for stability above the 100 moving average.
Entry price: 1.60
First target: 1.64
Second target: 1.70
Third target: 1.76
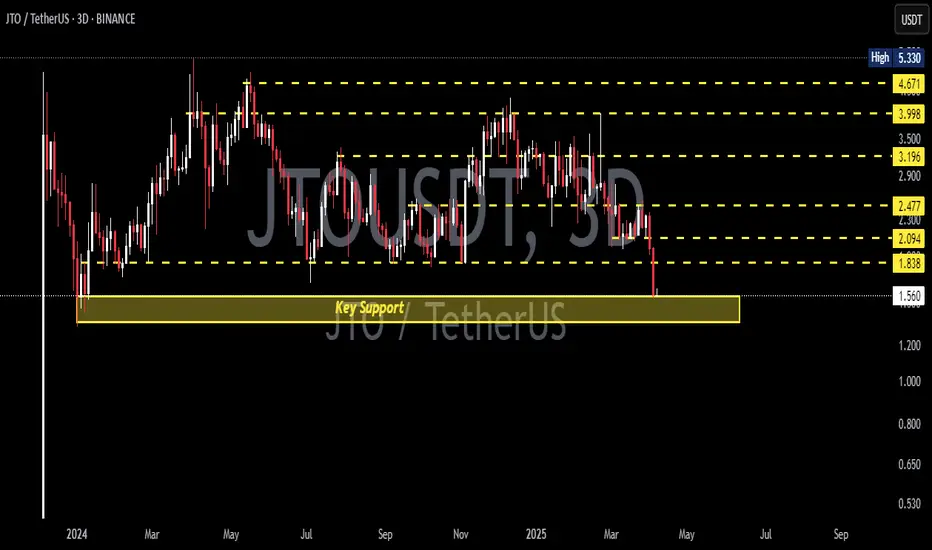
JTOUSDT 3DJTO ~ 3D Analysis
#JTO Key support that must be maintained. This loss of support will bring even lower prices.
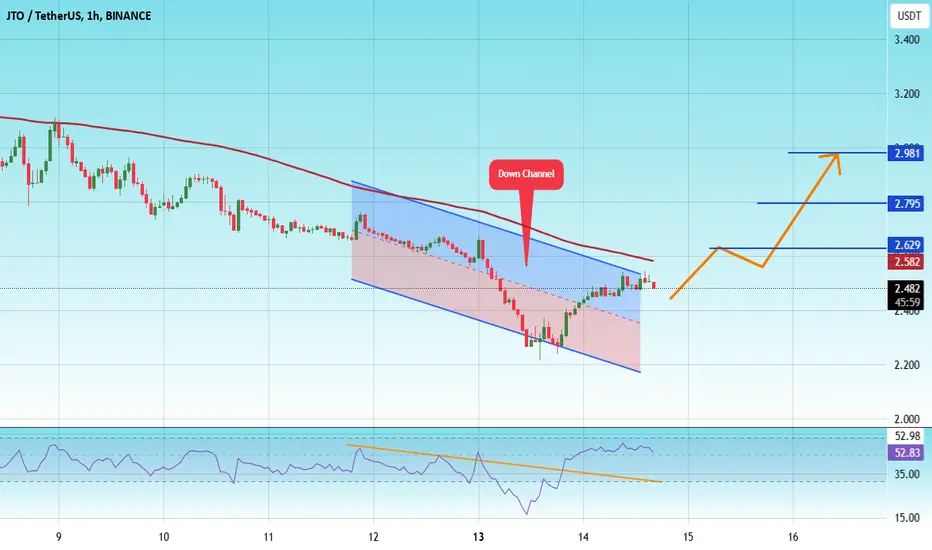
#JTO/USDT#JTO
The price is moving in a descending channel on the 1-hour frame and is adhering to it well and is heading to break it strongly upwards and retest it
We have a bounce from the lower limit of the descending channel, this support is at a price of 2.45
We have a downtrend on the RSI indicator that is about to break and retest, which supports the rise
We have a trend to stabilize above the moving average 100
Entry price 2.67
First target 2.78
Second target 3.18
Third target 3.5
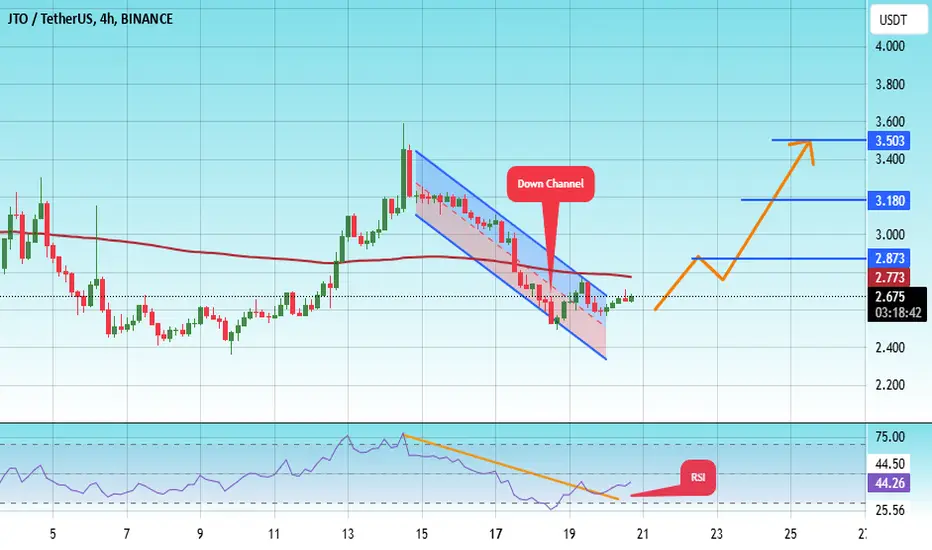
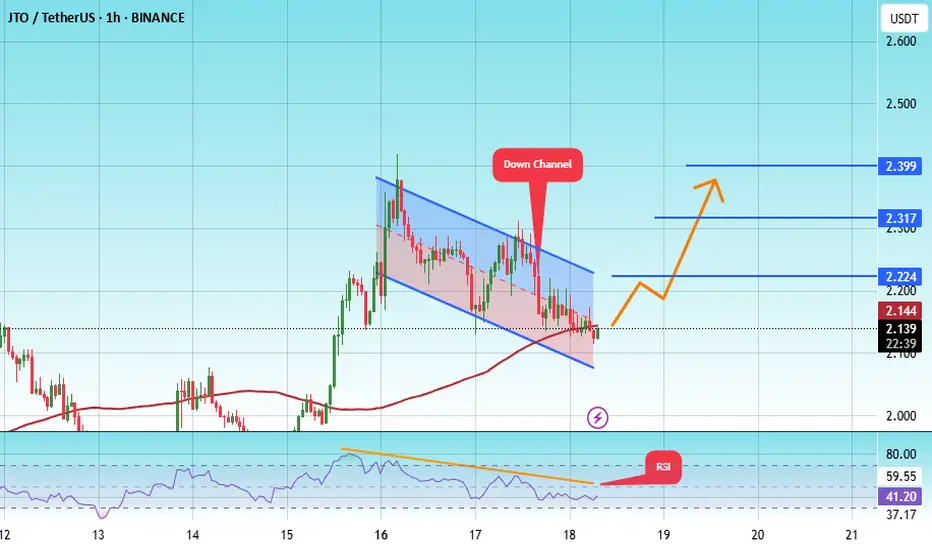
#JTO/USDT#JTO
The price is moving in a descending channel on the 1-hour frame and is expected to continue upwards
We have a trend to stabilize above the moving average 100 again
We have a descending trend on the RSI indicator that supports the rise by breaking it upwards
We have a support area at the lower limit of the channel at a price of 2.20
Entry price 2.48
First target 2.62
Second target 2.80
Third target 2.98
JTOUSDT 2DJTO ~ 2D Analysis
#JTO If you still have a Conviction on this coin,. This is a very good support for now, the target of at least 15%+.
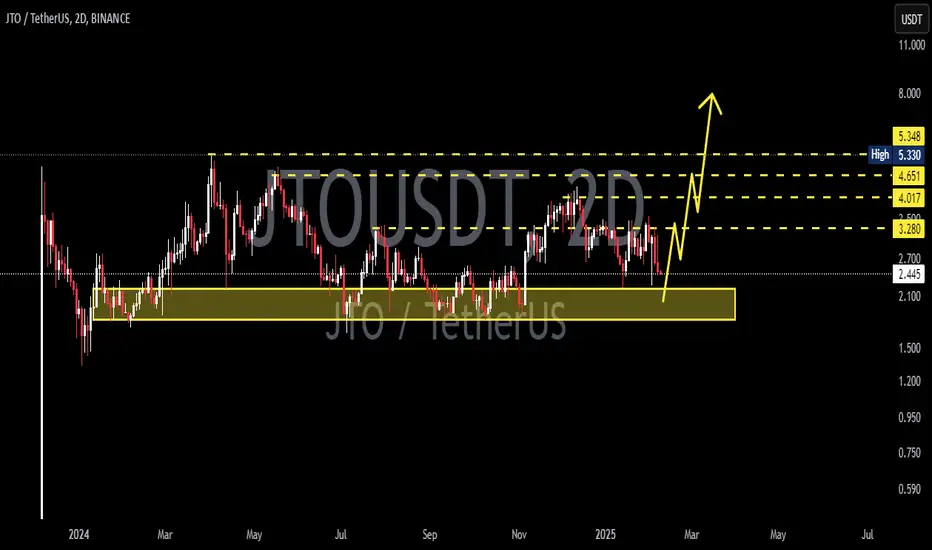
JTOUSDT 2DJTO ~ 2D
#JTO If you still have Conviction on this coin,. Buy gradually after break out of this descending channel with a target of at least 20%++
JTO | ALTCOINS | Mixed Signals in BEARs vs BULLsJTO was a hot topic when it was first released and there was a hype surrounding it, like many newly released altcoins (got to get that marketing right 😉)
However, it's been trading very "wicky" over the past few weeks, and the price seems indecisive as a pennant pattern forms. This could play out two ways, and it's likely that the next week will give clearer directions.
I'm largely watching Ethereum, King of the Alts, to make a move before expecting more upside on smaller cap altcoins.
_______________
BINANCE:JTOUSDT

#JTO/USDT#JTO
The price is moving in a descending channel on the 12-hour frame and is sticking to it well
We have a bounce from the lower limit of the descending channel and we are now touching this support at a price of 1.85
We have an upward trend on the RSI indicator that is about to be broken, which supports the rise
We have a trend to stabilize above the moving average 100
Entry price 2.34
First target 2.66
Second target 2.92
Third target 3.20

JTO : Take CAUTION - RSI Topout LikelyBINANCE:JTOUSDT
The RSI reacts different on every chart, which is often the case with technical indicators. This is also why we advise to find one or two, and learn how they respond on your favorite charts. If you swop around between technical indicators too frequently, you will miss key insights such as these.
The charts says bullish for three main reasons :
👉 Bottom out pattern
👉 Higher lows
👉 Hot RSI
Two playouts likely for JTO, but for NEAR / LONG term I will label it as BULLISH. Personally using leverage here is too risky for my taste but then again, I favor a modest and low-risk approach.
__________________________

JTOUSDT TRADE SETUPHello Folks,
Welcome to the quick update of a new coin name JTOUSDT.
Today we saw JTO dump around 10% from the immediate resistance of 3.275.
Within few hours, buyers kicked in and pushed the price back to the same resistance. As of now, it is trading around 3.28. We can see JTOUSDT pump until 4.76 in a span of 5 to 10 days.
Entry-Exit levels:
Entry: 3.05 to 3.16
Target: 3.81 to 4.76
STOPLOSS: Below $3
Until then, stay tuned and trade with caution, ensuring strict STOPLOSSES!!
This is not financial advice, please do your research before investing, as we are not responsible for any of your losses or profits.
Please like, share, and comment on this idea if you liked it.

JTOUSDT 1WJTO ~ 1W
#JTO If this goes to plan, COINBASE:JTOUSD Will retest the resistance line of this pattern. At least $4.4 will be tested.

#JTO/USDT#JTO
The price is moving within a bearish channel pattern on the 4-hour frame, which is a strong retracement pattern
We have a bounce from a major support area in green at 1.60
We have a tendency to stabilize above the Moving Average 100
We have a downtrend on the RSI indicator that supports the rise and gives greater momentum, upon which the price is based higher at the discount
Entry price is 1.60
First goal 2.22
The second goal is 2.55
Third goal 2.94

$JTO scalp longIf we can hold 2.54 to 2.50 (poc) , will be looking to long targeting 2.70 to 2.80
Targets:
2.72
2.80
2.94
Stoploss: Below 2.45

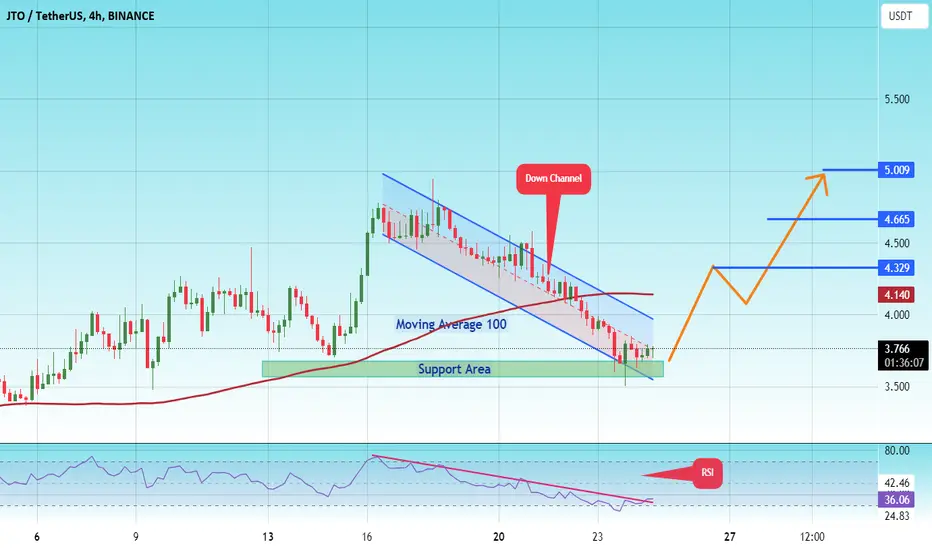
#JTO/USDT#JTO
The price is moving in a bearish channel on a 4-hour frame and is holding it strongly and is about to break it upward
We have a bounce from the green support area at 3.60
We have a tendency to stabilize above the Moving Average 100
We have a downtrend on the RSI that is about to break higher
Entry price is 3.75
First goal 4.33
Second goal 4.66
The third goal is 5.00