#JUP/USDT#JUP
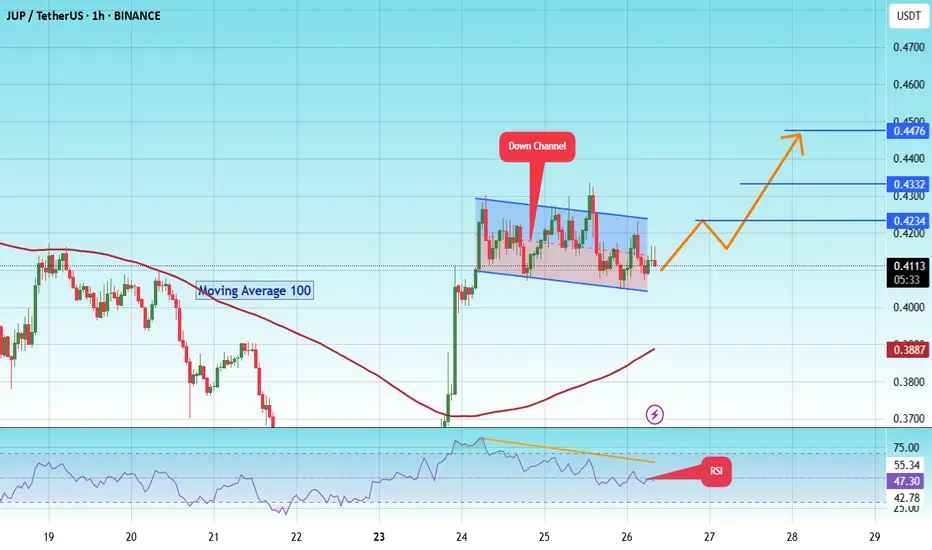
The price is moving within a descending channel on the 1-hour frame and is expected to break and continue upward.
We have a trend to stabilize above the 100 moving average once again.
We have a downtrend on the RSI indicator, which supports the upward move by breaking it upward.
We have a support area at the lower limit of the channel at 0.4065, acting as strong support from which the price can rebound.
Entry price: 0.4113
First target: 0.4234
Second target: 0.4332
Third target: 0.4477
Jupbtc
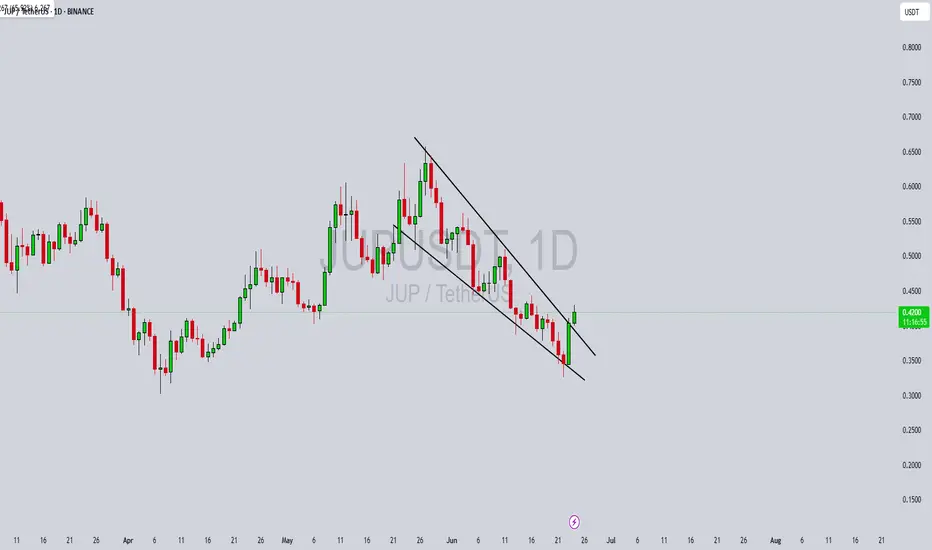
JUPUSDT Forming Falling WedgeJUPUSDT is showing strong bullish potential as it forms a classic falling wedge pattern—a technical setup often preceding significant upward price movement. This pattern, defined by a series of lower highs and lower lows converging into a narrowing channel, reflects declining bearish momentum. With price approaching the wedge's apex and volume remaining healthy, a breakout to the upside appears imminent. This setup has historically delivered solid results in crypto markets, especially when supported by strong volume and growing investor interest.
From a price action perspective, the falling wedge pattern for JUPUSDT suggests a reversal is likely on the horizon. A confirmed breakout above the descending resistance trendline could see JUPUSDT rally by 80% to 90%+, aligning with historical projections based on the pattern's depth. The coin has already begun to gain traction in the market, with increased order book activity and stronger community sentiment visible across multiple platforms.
The project behind JUPUSDT is also attracting attention from both retail and institutional investors. This interest often translates into stronger support zones and more sustainable rallies. Coupled with technical indicators like RSI divergence and rising accumulation volume, JUPUSDT seems well-positioned for a breakout that could deliver substantial returns in the short to medium term.
Traders should closely monitor resistance breakout levels and wait for confirmation via volume surges or bullish candlestick structures. JUPUSDT’s combination of pattern strength, volume profile, and market engagement makes it a compelling pick among altcoins poised for recovery and rally.
✅ Show your support by hitting the like button and
✅ Leaving a comment below! (What is You opinion about this Coin)
Your feedback and engagement keep me inspired to share more insightful market analysis with you!
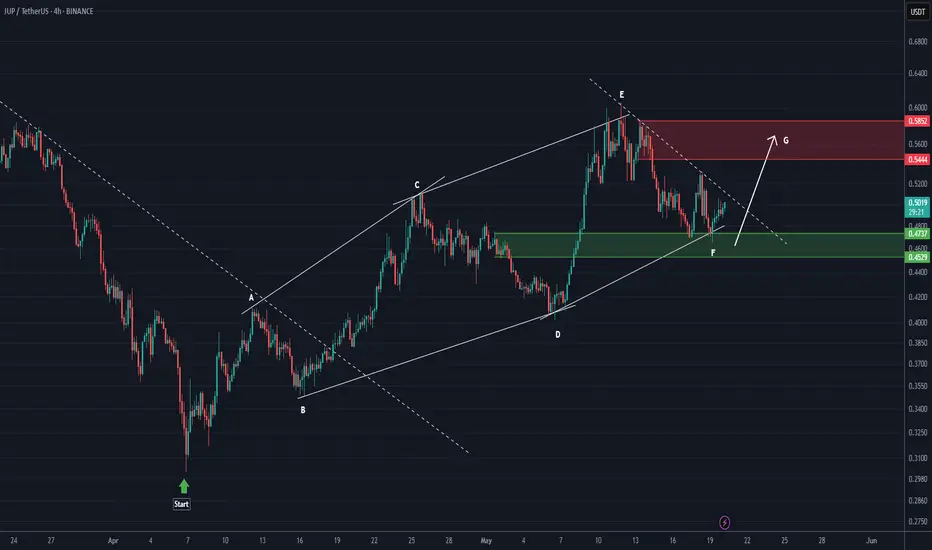
JUP Looks Bullish (4H)From the point where we placed the green arrow on the chart, it appears that the bullish phase of JUP has started in a swing structure.
This phase is a diagonal (Diametric), and it currently seems that wave G is forming. This wave is a bullish wave.
As long as the green box is maintained, the price can move toward the red box.
The closing of a daily candle below the invalidation level will invalidate this analysis.
invalidation level: 0.4322
For risk management, please don't forget stop loss and capital management
Comment if you have any questions
Thank You
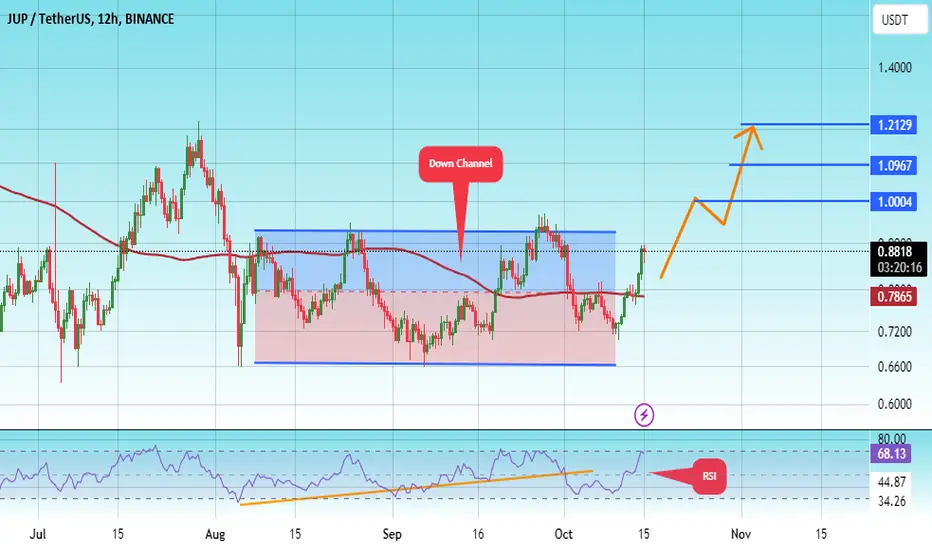
#JUP/USDT#JUP
The price is moving in a descending channel on the hourly frame
And it is sticking to it well
We have a bounce from the lower limit of the descending channel and we are now touching this support at a price of 0.7000
We have a downtrend on the RSI indicator that is about to be broken, which supports the rise
We have a trend to stabilize above the moving average 100
Entry price 0.870
First target 1.00
Second target 1.10
Third target 1.22
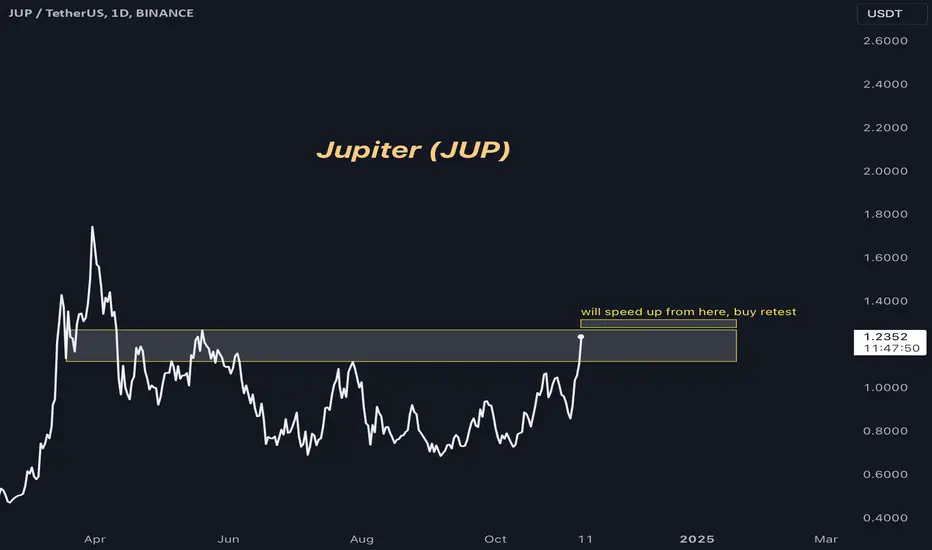
Jupiter (JUP) - "safe bet" - could be early daysKeep it simple remove all the noise.
The chart looks good!
As soon as jupiter has a close above 1.27 we have a new floor for continued explosive growth. I see Jupiter as one of the potentially big winners with relatively little risk compared to many others. As long as Solana continues to shine, so will Jupiter.
I think Jupiter lags a bit behind Solana and I think we may see a catch up phase soon.
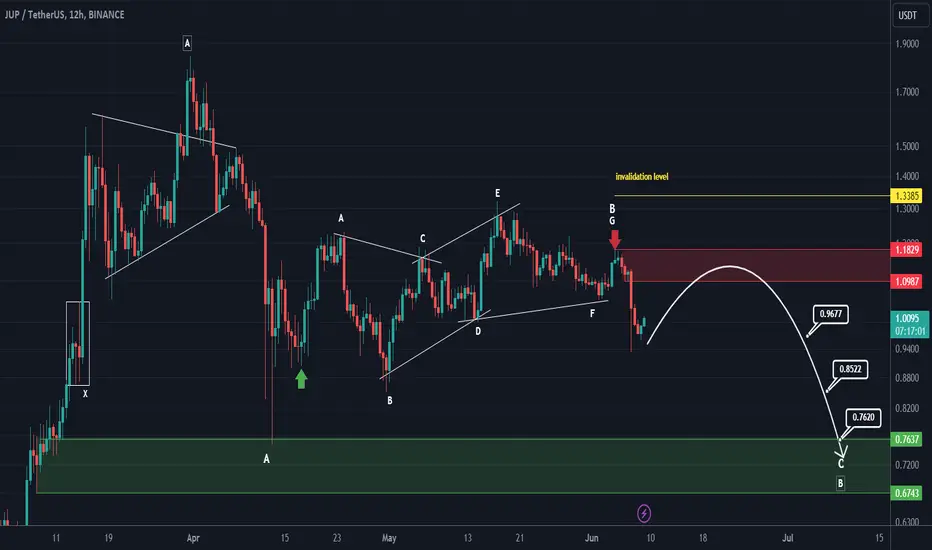
JUP looks bearish (12H)From where we put the red arrow on the chart, it looks like a correction pattern has started.
According to the price and time rules, it seems that this pattern is a diametric.
It seems that the d wave of this diametric is over now.
The targets are marked on the chart.
Closing a daily candle above the invalidation level will violate the analysis.
For risk management, please don't forget stop loss and capital management
When we reach the first target, save some profit and then change the stop to entry
Comment if you have any questions
Thank You
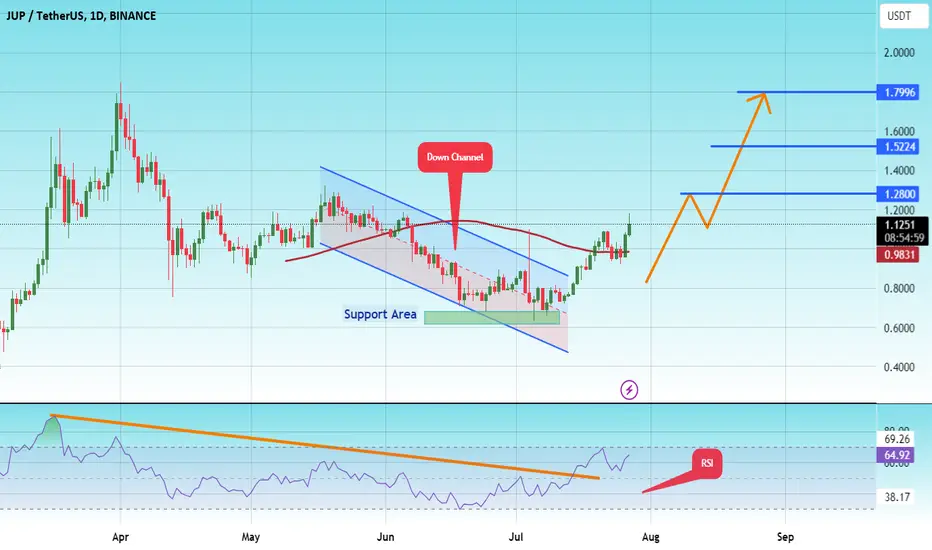
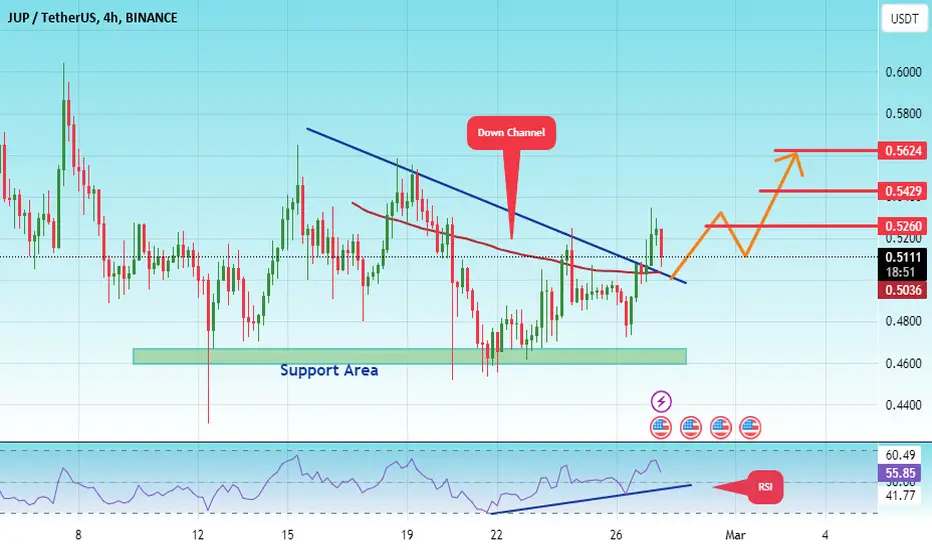
#JUP/USDT#JUP
The price is moving in a descending channel on the 4-hour frame and we are about to break it
We have a bounce from a major support area in green at 0.600
We have a downtrend on the RSI indicator that has been broken upwards
We have a trend to stabilize above the moving average 100 which supports the rise
Entry price 1.10
First target 1.28
Second target 1.52
Third target 1.80
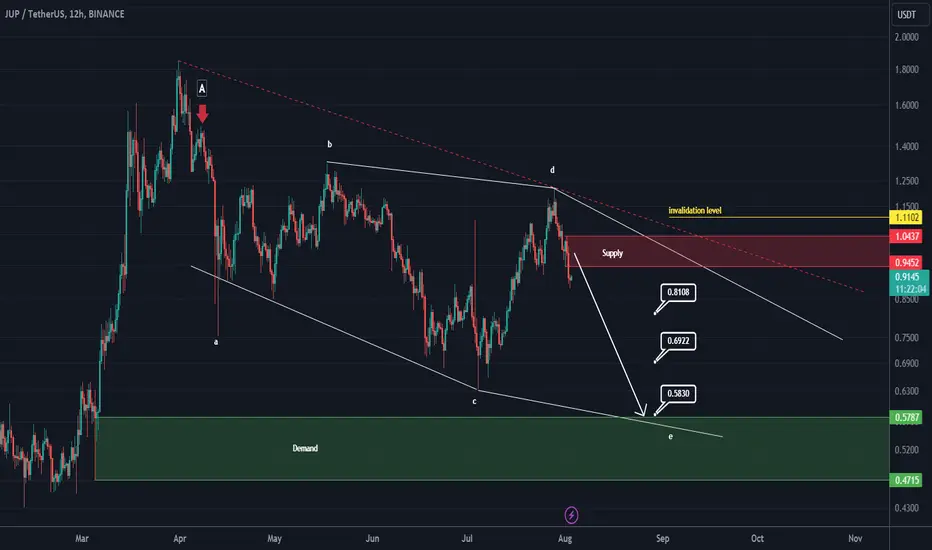
JUP looks bearishIt looks like we had a big wave A that is over.
Now it has entered the big B wave.
A big B wave looks like an ABC.
Wave b of B looks like a diametric that is over.
We now seem to be in wave c of B.
If the price reaches the supply range, we will look for sell/short positions
For risk management, please don't forget stop loss and capital management
When we reach the first target, save some profit and then change the stop to entry
Comment if you have any questions
Thank You
#JUP/USDT#JUP
The price is moving in a descending triangle and sticking to its boundaries well
We have respect for the lower border of the channel at 0.4600
We have an uptrend on the RSI that the price is following well
Entry price is 0.5126
The first target is 0.5260
The second target is 0.5429
The third goal is 0.5624
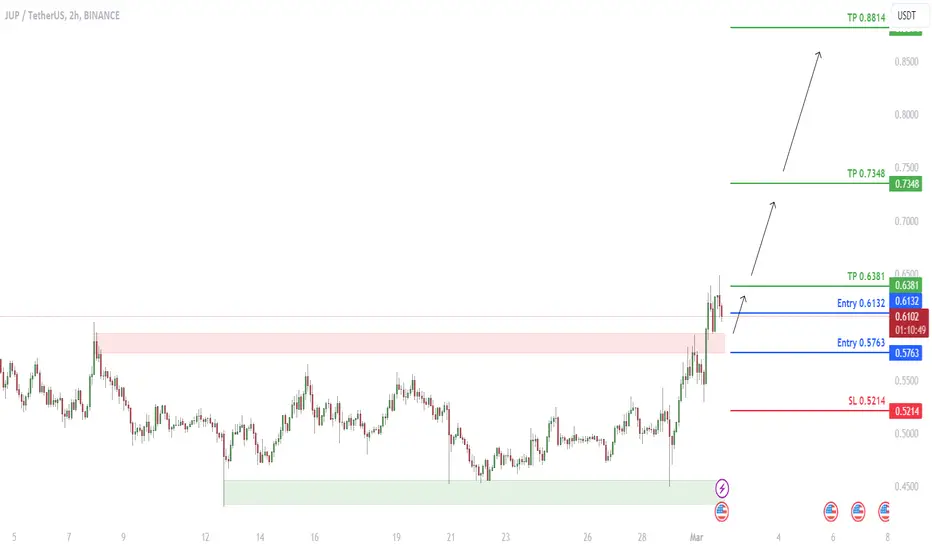
JUP has broken above the key resistance zoneJUP has broken above the key resistance zone, after the pullback it will continue to go up
🔵Entry Zone 0.5763 - 0.6132
🔴SL 0.5214
🟢TP1 0.6381
🟢TP2 0.7348
🟢TP3 0.8814
Risk Warning
Trading Forex, CFDs, Crypto, Futures, and Stocks involve a risk of loss. Please consider carefully if such trading is appropriate for you. Past performance is not indicative of future results.
If you liked our ideas, please support us with your likes 👍 and comments.
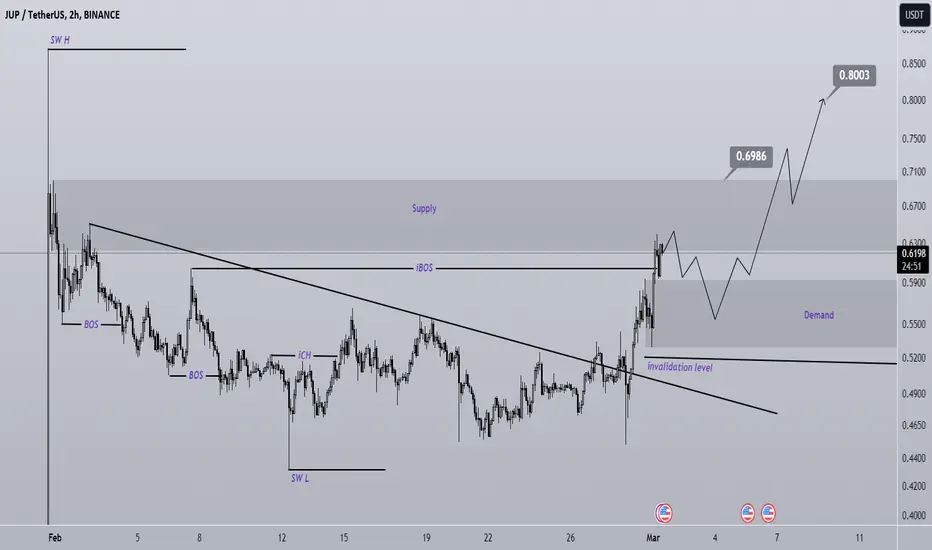
JUP BUY SETUPWe have a bullish iCH and iBOS on the chart, which has created a bullish view on the chart.
If to demand
If a pullback occurs, it is an opportunity to enter a buy/long position.
Closing a 4-hour candle below the invalidation level will invalidate the analysis
Note that the financial market is risky, so:
Do not enter any position without confirmation and trigger.
Do not enter a position without setting a stop.
Do not enter a position without capital management.
When we reach the first TP, save some profit and try to move the stop continuously in the direction of your profit.
If you have any comments please post them, comments will help us improve our performance
Thanks
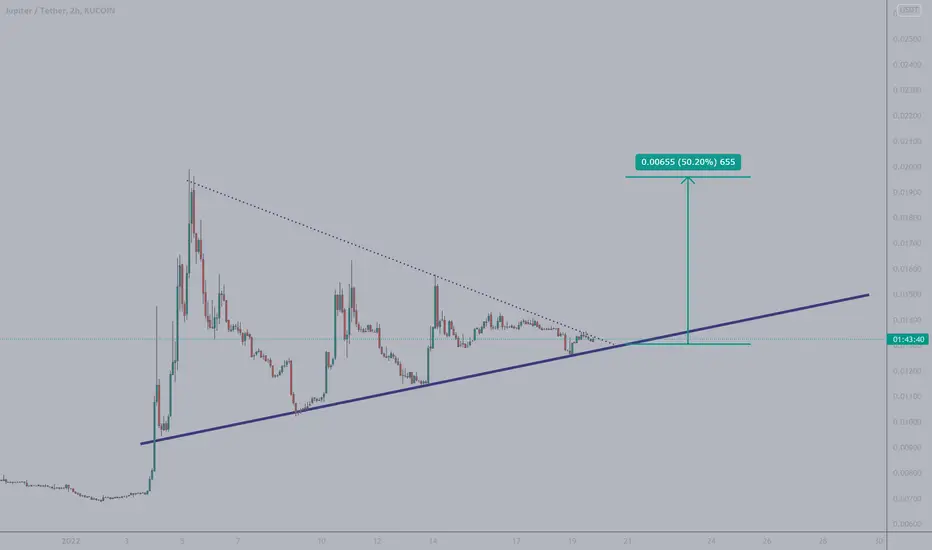
JUP JUP and AwayNot missing this move on JUP, currently making a symmetrical triangle which is normally indicative of a trend continuation.
I see a 50% move at least within the next 24 - 48 hrs (if BTC remains stable)