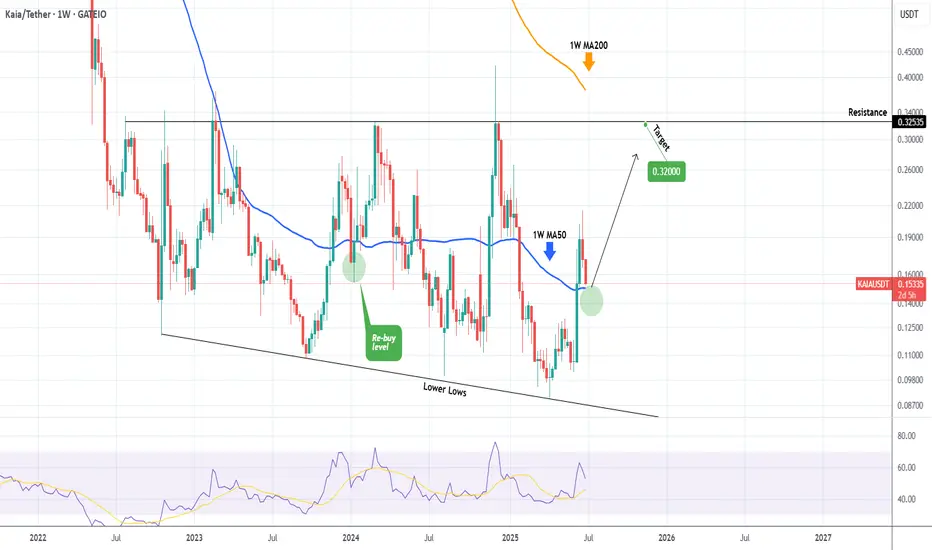
KAIAUSD Buy this level for a bullish continuation.Kaia (KAIAUSDT) is pulling back towards its 1W MA50 (blue trend-line) for a technical re-test of its natural long-term Support.
We think it will be a January 2024 type of test, with a breach and subsequent rebound to test the Resistance and potentially a 1W MA200 (orange trend-line) test. Target 0.32000.
-------------------------------------------------------------------------------
** Please LIKE 👍, FOLLOW ✅, SHARE 🙌 and COMMENT ✍ if you enjoy this idea! Also share your ideas and charts in the comments section below! This is best way to keep it relevant, support us, keep the content here free and allow the idea to reach as many people as possible. **
-------------------------------------------------------------------------------
💸💸💸💸💸💸
👇 👇 👇 👇 👇 👇
KAIAUSD
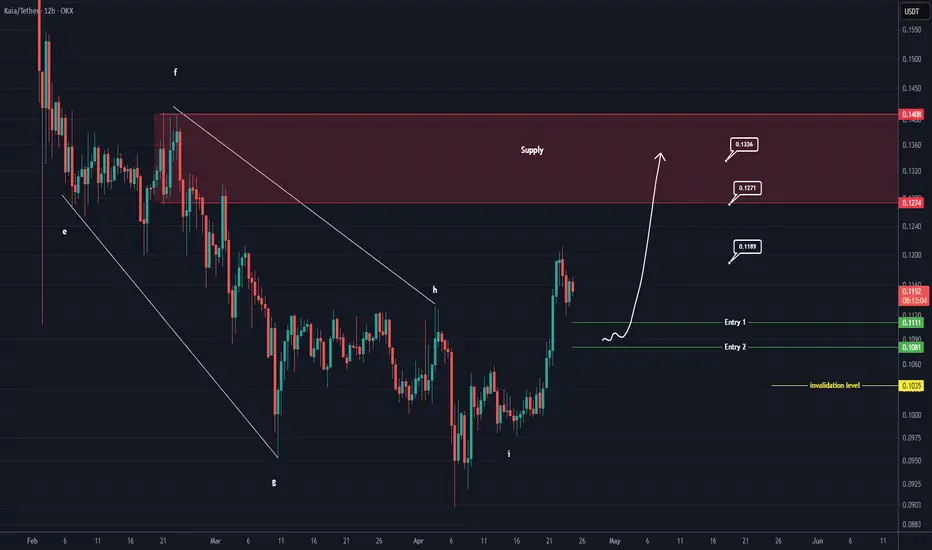
KAIA Buy/Long Setup (12H)It seems that a large symmetrical pattern has completed, and the price has broken out above the resistance line. We are looking for Buy/Long positions on pullbacks.
We have identified two entry points for this asset. If the price reaches these entry zones, we will enter a position.
The targets are also marked on the chart.
A daily candle closing below the invalidation level will invalidate this analysis.
For risk management, please don't forget stop loss and capital management
When we reach the first target, save some profit and then change the stop to entry
Comment if you have any questions
Thank You
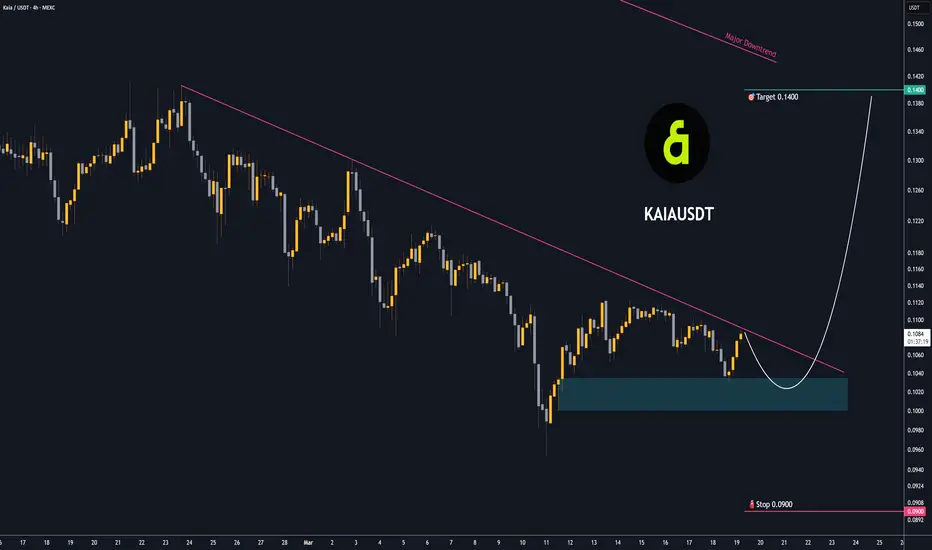
Trading opportunity for KAIAUSDTBased on technical factors there is a Buy position in :
📊 KAIAUSDT
🔵 Buy Now
🪫Stop loss 0.0900
🔋Target 0.1400
📏 R/R 1,7
💸RISK : 1%
We hope it is profitable for you ❤️
Please support our activity with your likes👍 and comments📝
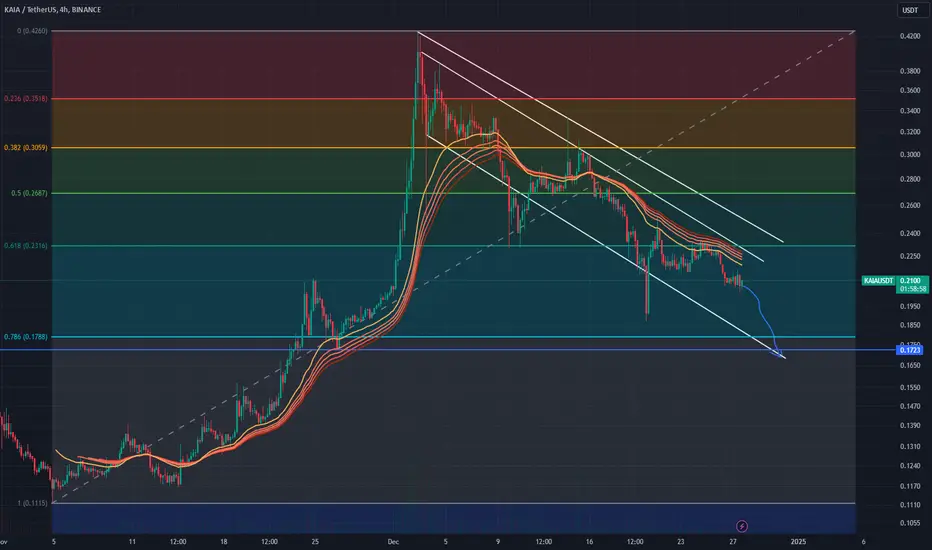
KAIA dump dump more babyKAIA impressive pump is followed by an equally impressive dump. Still some way to go until the lower boundary of channel is met. 16 cents here we come!
KLAY -> KAIA New Start!!!
Hello, traders.
If you "Follow", you can always get new information quickly.
Please click "Boost" as well.
Have a nice day today.
-------------------------------------
Since the chart was created not long ago, the role of support and resistance points may be weak, so please use it only as a reference.
Changed from KLAY to KAIA.
As it is a new start, the key is whether it can attract investors' attention.
-
(KAIAUSDT 1h chart)
The point of interest is whether it can receive support in the 0.1143-0.1169 range and rise above 0.1232.
If it is supported near 0.1232 and goes up,
1st: 0.1307
2nd: 0.1447
You should check whether it is supported near the 1st and 2nd above.
-
Have a good time.
Thank you.
--------------------------------------------------
- Big picture
It is expected that a full-scale uptrend will start when it rises above 29K.
The section expected to be touched in the next bull market is 81K-95K.
#BTCUSD 12M
1st: 44234.54
2nd: 61383.23
3rd: 89126.41
101875.70-106275.10 (overshooting)
4th: 134018.28
151166.97-157451.83 (overshooting)
5th: 178910.15
These are points where resistance is likely to occur in the future.
We need to check if these points can be broken upward.
We need to check the movement when this section is touched because I think a new trend can be created in the overshooting section.
#BTCUSD 1M
If the major uptrend continues until 2025, it is expected to start forming a pull back pattern after rising to around 57014.33.
1st: 43833.05
2nd: 32992.55
-----------------
