KDA/USDT – Major Reversal Brewing from Multi-Year Demand Zone?🔍 Technical Breakdown – Weekly Timeframe
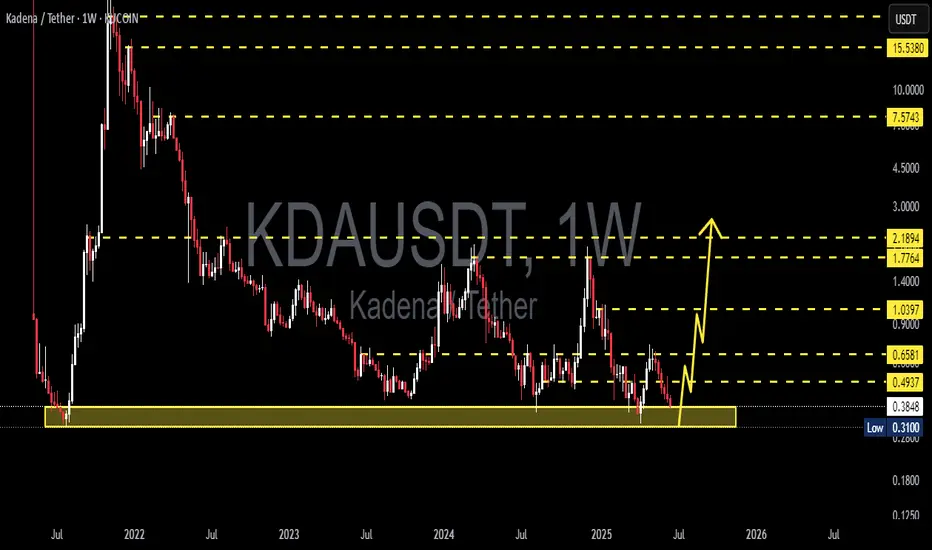
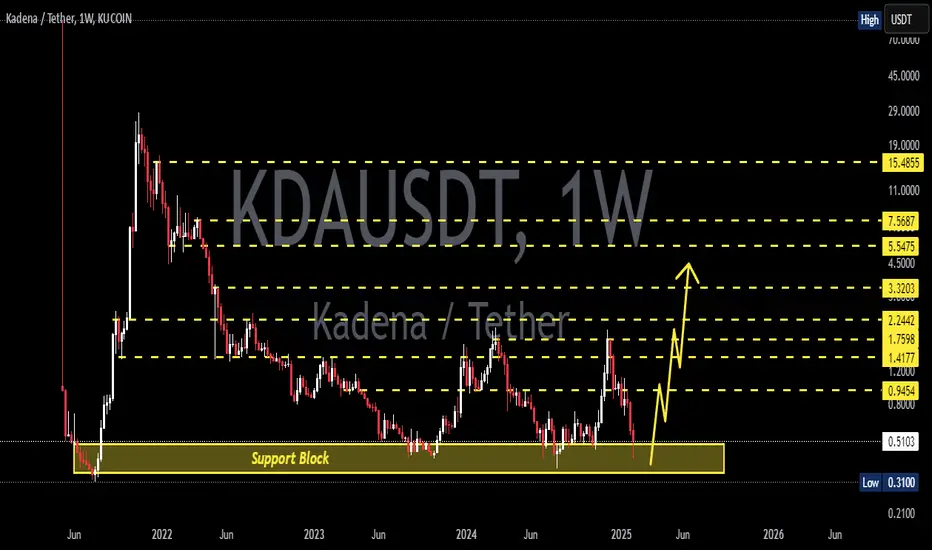
Kadena (KDA) is currently trading at a make-or-break level after months of persistent downtrend. The price is revisiting a historical multi-year demand zone between $0.31 - $0.45, an area that previously acted as a launchpad for major rallies.
This range has consistently attracted buyers, forming a strong base of accumulation, as observed in mid-2021 and mid-2022. Now, once again, KDA is testing this critical zone — and all eyes are on whether it will spark the next impulsive leg up.
🧠 Pattern Structure:
Price has formed a potential Triple Bottom / Rounded Accumulation pattern on the weekly chart.
Strong bullish divergence is visible (if confirmed by RSI or MACD).
Long-term sideways consolidation hints at phase of accumulation, common before breakout rallies.
A clean break above local resistance zones may trigger a multi-level Fibonacci extension rally.
🟢 Bullish Scenario:
If price holds and confirms a rebound from this yellow demand box, watch for a bullish breakout with the following key resistance targets:
1. 🔹 $0.6277 – Minor local resistance
2. 🔹 $0.8354 – Former swing high (early 2024)
3. 🔹 $1.1000 – Psychological & structural level
4. 🔹 $1.3567 – Weekly resistance
5. 🔹 $1.7615 – Medium-term target zone
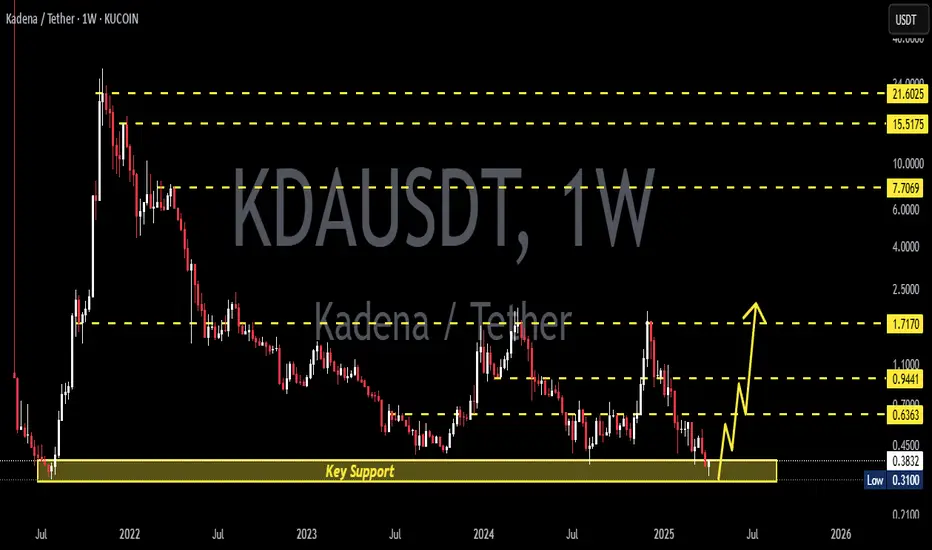
💥 Extension Targets for Macro Bulls:
$5.5285 – Previous major high
$7.6381 – Major resistance from 2022
$15.3227 and $21.9739 – Long-term fib levels from all-time high retracement
✅ Bullish confirmation requires a weekly close above $1.10 with rising volume and higher highs.
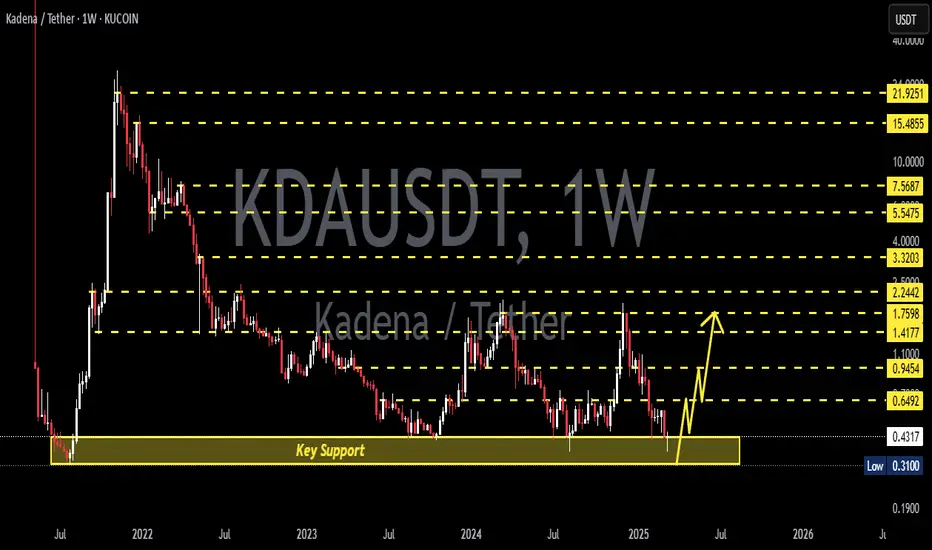
🔴 Bearish Scenario:
If price closes below $0.31 with strong bearish momentum:
Expect continuation of macro downtrend.
No strong support structure below; risk of falling into uncharted territory or sub-$0.20 levels.
Breakdown could lead to capitulation and extended bear phase.
⚠️ Manage risk accordingly. Invalidating the current demand zone could shift the entire structure to a distribution model.
📊 Market Psychology & Volume Profile Insight
Extended sideways action and low volatility can signal the end of bearish momentum.
A breakout from this long-term base often leads to explosive upside as weak hands are flushed out.
Volume spikes near the bottom zones indicate smart money accumulation.
🧭 Strategic Note for Traders:
This setup offers a high reward-to-risk ratio, especially for swing and position traders. Early entry within the accumulation zone with tight stop-loss (below $0.30) could provide a golden opportunity — but only if confirmed with volume and price strength.
#KDAUSDT #Kadena #CryptoBreakout #AltcoinAnalysis #TechnicalAnalysis #SupportAndResistance #TripleBottom #BullishSetup #CryptoSignals #AccumulationPhase
Kdausdsignals

KDAUSDT 1W Analysis KDA ~ 1W Analysis
#KDA This is the lowest support for now. Buy if you still have confidence in this coin with a short term target of at least 15%+ from this support.
KDAUSDT 1WKDA ~ 1W Analysis
#KDA This is the lowest support for now, maybe you can consider to start buying back from here with a short -term target of at least 15%+ from here.
KDAUSDT 1WKDA ~ 1W Analysis
#KDA Buy gradually from here with a short -term target of at least 20%+. This is the lowest support for now.
KDAUSDT 1WKDA ~ 1W Analysis
#KDA This is the lowest support block for now. Buy from here if you still have a Conviction on this coin with a minimum target of 20%+.
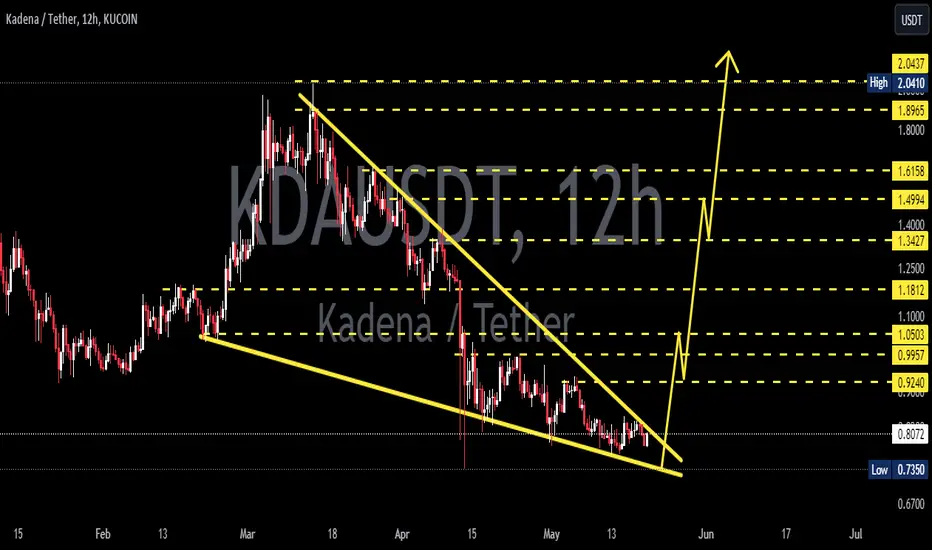
KDAUSD 12HKDA ~ 12H
#KDA Movement is increasingly limited in this pattern. It is only a matter of time until this pattern is successfully broken.
Make purchases gradually within this pattern, or buy after breaking through the resistance line of this pattern.
KADENA/USDT- set to rise🚀Kadena (KDA) from last two years was falling, this is the first time from then that the price has managed to hold above the 21 MA and 50 moving average and now seems to be in an uptrend on the daily time-frame. KDA have space for the growth in its price and can be considered as a buying opportunity, I am aiming for 7.7usd per coin in the upcoming months.
Note- This is my personal view and not financial advice crypto market is highly risky, do your own research before investing.

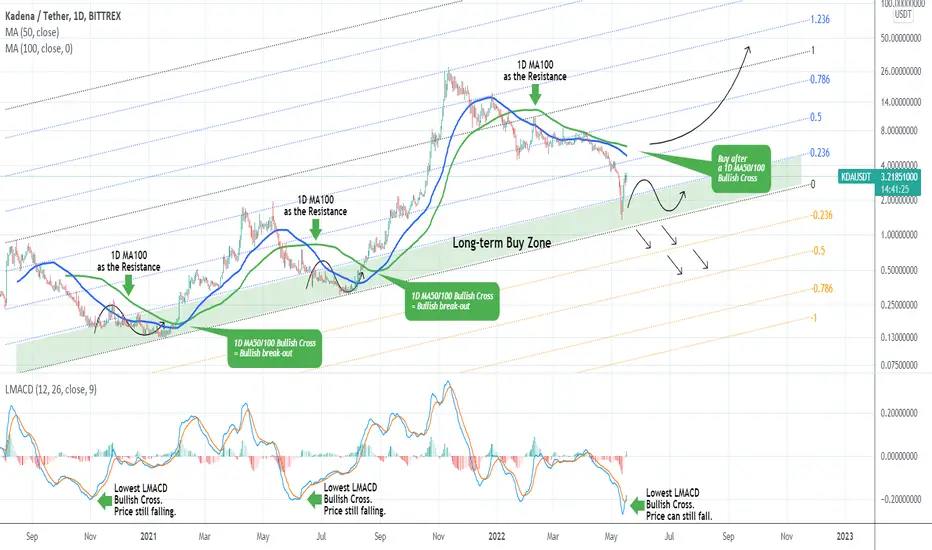
KDAUSDT Rebounded on the long-term Buy Zone.Kadena (KDAUSDT) is having one of the strongest rebounds from the top 100 cap coins. Besides the fundamentals involved, a key technical reason is the fact that it entered the long-term Buy Zone and almost hit the bottom (Higher Lows trend-line) of the Fibonacci Channel pattern that formed since its first trading days.
However this rebound may be short-lived as despite the Bullish Cross on the 1D LMACD, the price always dipped a little lower after this formation. In fact, the last two rallies in February 2021 and August 2021 were confirmed only after the 1D MA50 (blue trend-line) and the 1D MA100 (green trend-line) formed a Bullish Cross. Basically during these corrections, the 1D MA100 has been acting as a Resistance and its break confirmed the uptrend. This matches perfectly the recent price action and correction, as the 1D MA100 has been the Resistance since January 13 2022.
As a result buy only if you have a long-term perspective as the price may dip towards the -0.236 or even the -0.5 Fibonacci extensions until a permanent bottom is formed. Otherwise, wait for a 1D MA100 break or the Bullish Cross of 1D MA50/100.
--------------------------------------------------------------------------------------------------------
Please like, subscribe and share your ideas and charts with the community!
--------------------------------------------------------------------------------------------------------
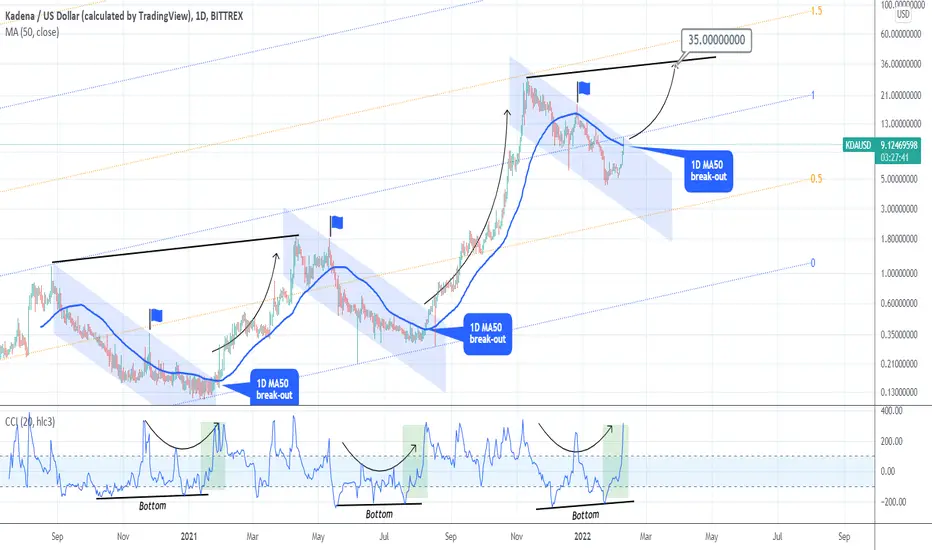
KADENA on the verge of starting a mega rallyKDAUSD has been on fire recently and that bullish short-term trend broke above the 1D MA50 (blue trend-line) today. The last time it did so on December 27 2021, it was a fake break-out but on a long-term scale, it resembles more the bullish break-outs of August 08 2021 and January 25 2021. The CCI sequences between the three phases are very similar.
The CCI appears to have bottomed the same way it did in late 2020 and mid 2021, so there are more chances that the current 1D MA50 break is a bullish signal and not a fake-out. Technically, we should be seeing an aggressive rally soon and the modest target based on the neutral scenario of Jan - April 2021 is the Higher Highs trend-line at around 35.000. A break above the 1.5 Fibonacci extension, could target the 2.0 Fib as it happened on the October 23 break of 1.0 Fib (that almost reached the 1.5 Fib within 2 weeks).
--------------------------------------------------------------------------------------------------------
** Please support this idea with your likes and comments, it is the best way to keep it relevant and support me. **
--------------------------------------------------------------------------------------------------------