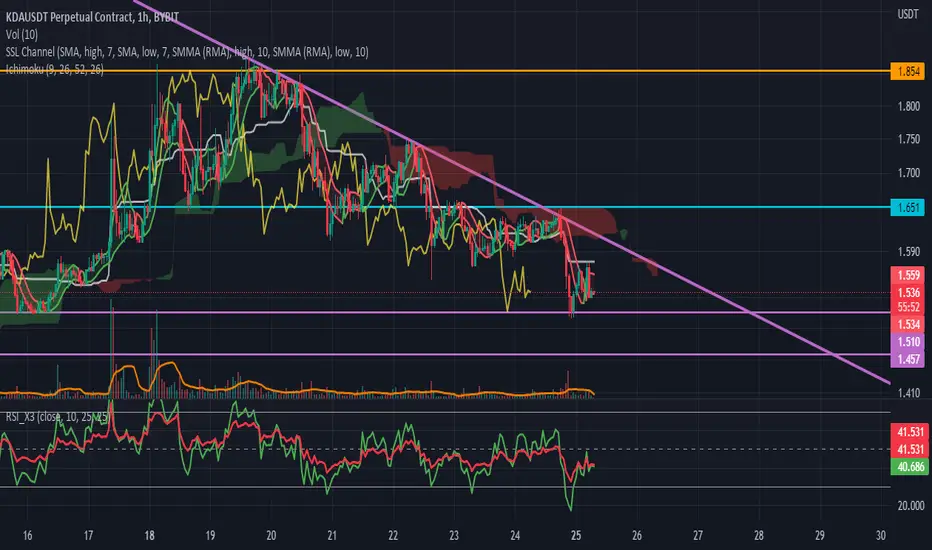
Find a buying opportunityThe simultaneous breaking of the purple downward trend line and ichimoku cloud to the top gives initial buy signal.
To confirm the signal, the volume and RSI should be checked.
Also, Ichimoku confirmations including baseline and lagging span will help.
KDAUSDT
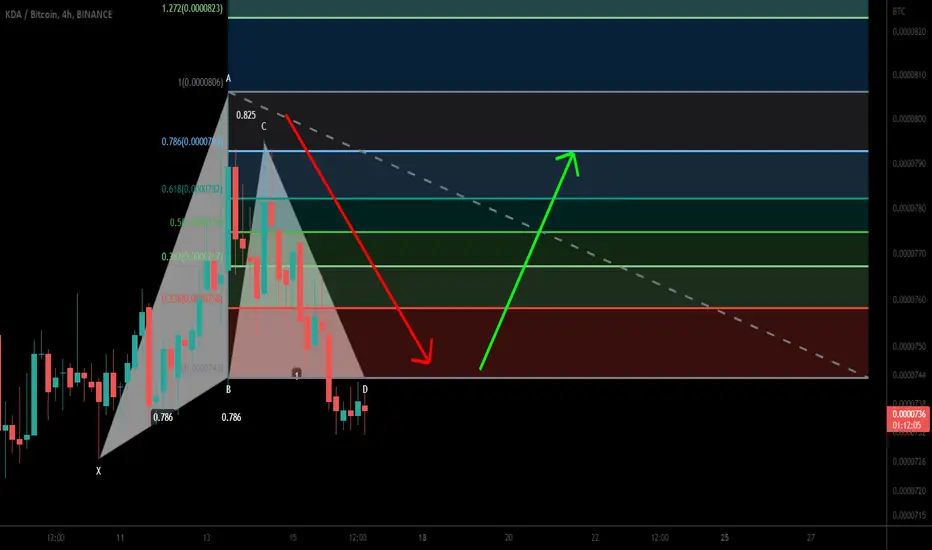
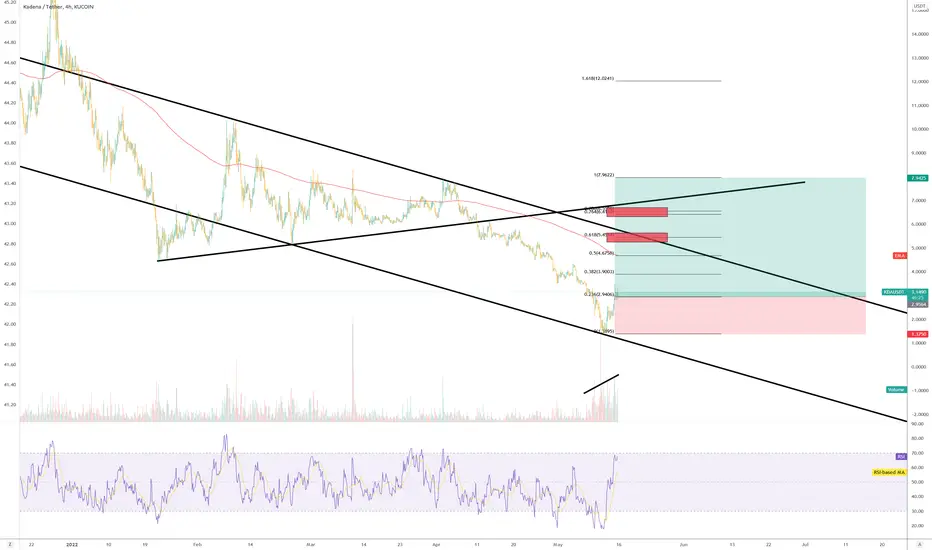
Kadenaa (KDA) formed bullish Gartley for upto 9% moveHi dear friends, hope you are well and welcome to the new trade setup of Kadenaa ( KDA ) with Bitcoin pair.
Previously we had a nice trade of KDA:
Now on a 4-hr time frame, KDA has formed a bullish Gartley pattern:
Note: Above idea is for educational purpose only. It is advised to diversify and strictly follow the stop loss, and don't get stuck with trade
KDABTCKDA looks good and I think we can trust it and publicly we see a positive movement in the coming days
KDA/USDT - The Ultimate BlockchainI expect KDA/USDT to reach at least 100 dollars within the next 2 years.
It is by far the greatest Layer 1 blockchain and once projects will starts building creating smart contracts this thing is going to fly.
NOT FINANCIAL ADVICE.

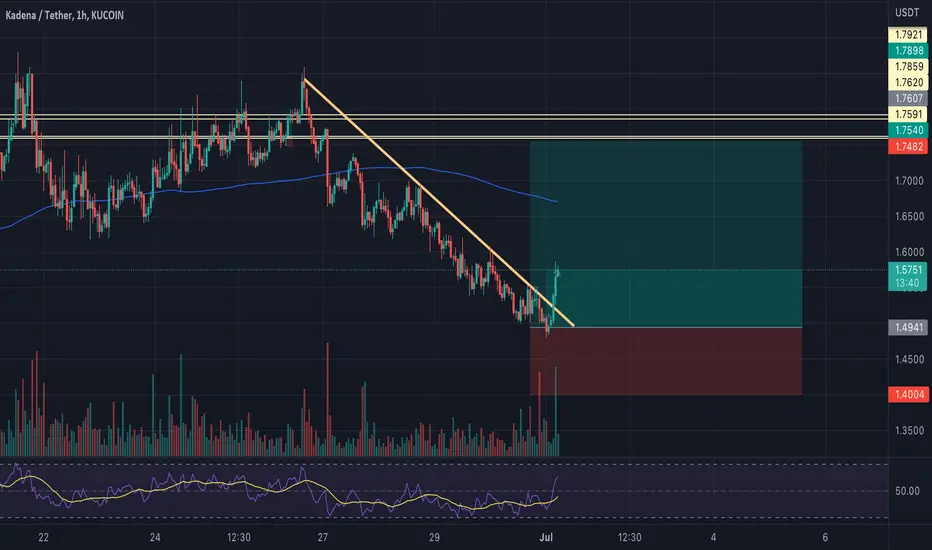
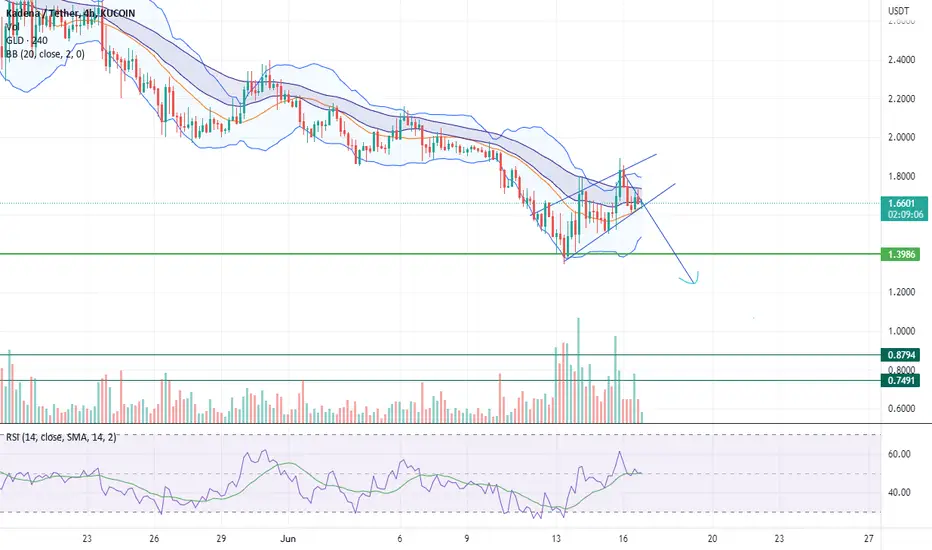
Short KDAAs you can see, the candle closes below the blue line, which is a sign of further decline to the green support zone .

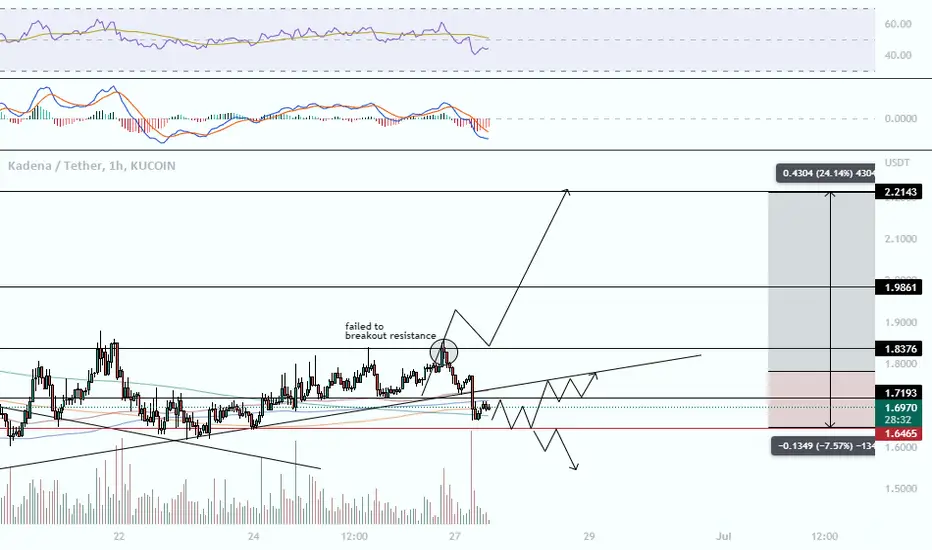
#KDA broke its 1h trendline Hello #SorooshSchool Guys ,
As you can see in the chart , #kadena broke the dynamic resistant and pumped more than 8%
targets are available in the chart after retest and confirmation
Do not forget like and share this idea if it is useful analysis for you
Have a perfect day
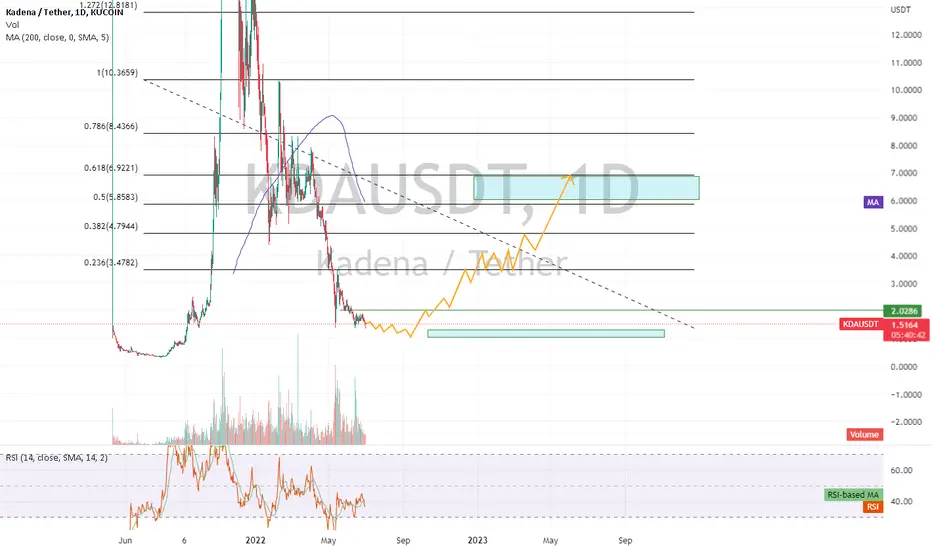
kda/usdt KDA i see the 1 $ - 1.2 $ The best buying zone you can accumulate from this lvl target 5.5- 7 $ Good luck everyone
kdakda kda kda kda kda kdakda kda kdakda kda kdakda kda kdakda kda kdakda kda kdakda kda kdakda kda kdakda kda kdakda kda kdakda kda kda

KDA/usdt 1hsorry for the prediction error that is expected to be pumping.
Always remember we in bear market.
In the bear market.
Need to predict pump if breakout,
dump if reject resistance
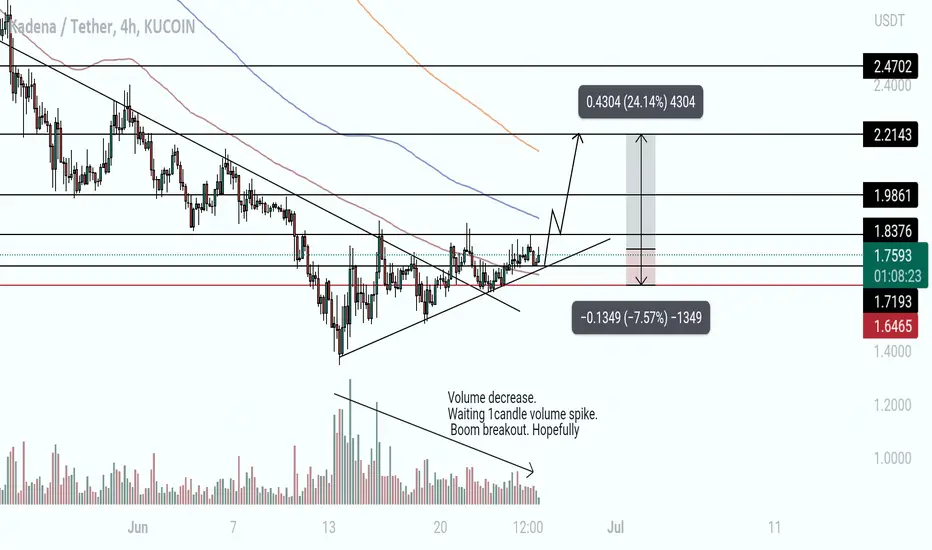
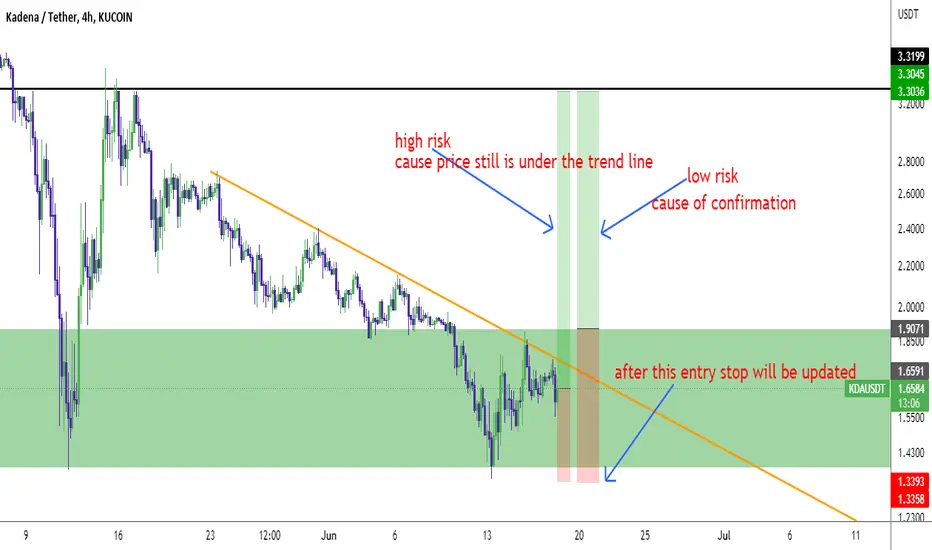
KDAUSDTin my opinion this coin is on support zone
entries is clear but the stop for the second position will be updated after the price break the trend line
Rising wedge! More DamageKDA is one of my fav projects and I'd love to buy it for a cheaper price :D
KDA LONG SPOTenter LONG KDA USDT, risk 1%. We are at strong suport and double bottom formation.
Base on TOTAL and BTC this is risky trade, market now is very volatile!
first target is at previous high (start of falling wedge).

KDA/USDT HAS POTENTIAL TO PUMP 120%!! Hi guys, This is CryptoMojo, One of the most active trading view authors and fastest-growing communities.
Do consider following me for the latest updates and Long /Short calls on almost every exchange.
I post short mid and long-term trade setups too.
Let’s get to the chart!
I have tried my best to bring the best possible outcome in this chart, Do not consider it as financial advice.
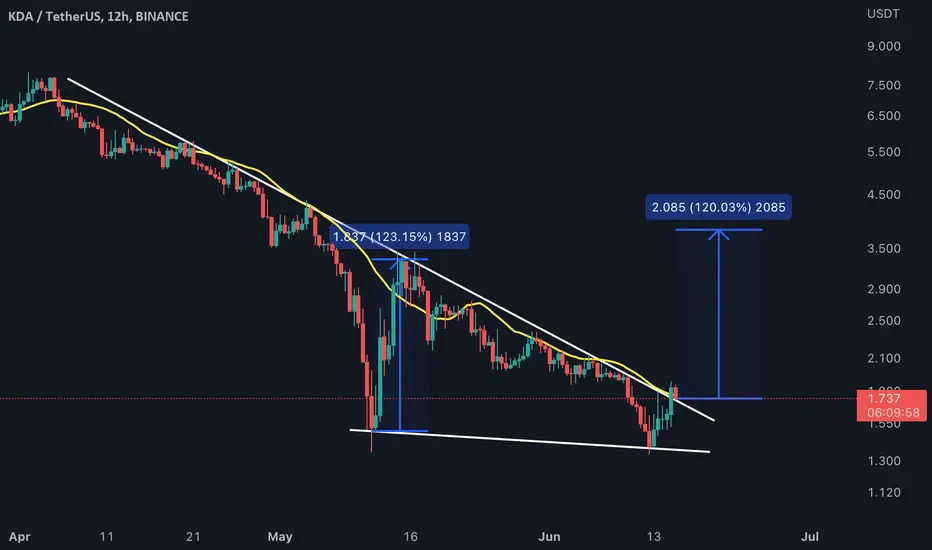
Welcome to this KDA/USDT update. KDA looks very promising here.
KDA is making this falling wedge pattern in a 3-day timeframe a currently retesting it.
Long KDA/USDT
Entry range:- CMP
Target:- 120%
SL:- $1.3
This chart is likely to help you in making better trade decisions if it did consider upvoting this chart.
Would also love to know your charts and views in the comment section.
Thank you
KDA IdeaPreviously we have done and dusted with 100% accuracy and exited the market at the very right time.
I am just trying to save the people from making the mistakes, that we did in 2018. You still don’t know what cheap altcoin is.
None of my tweets will be a financial advice
I will not DM you for premium join or money
Best of luck
KDAUSD (Kadena). have it on your watchlist.As you guys may know, crypto is experiencing harsh times. yet there may be some assets that lead to 10-20% (at least) profits. KDAUSD is one of them.
Nothing has been proved yet, no confirmation or triggers!!! But we can have it on our watchlist, and see how this chart unfolds in days to come.
for now its just a speculation, nothing more.
I'll update it as soon as I find anything else.
cheers.

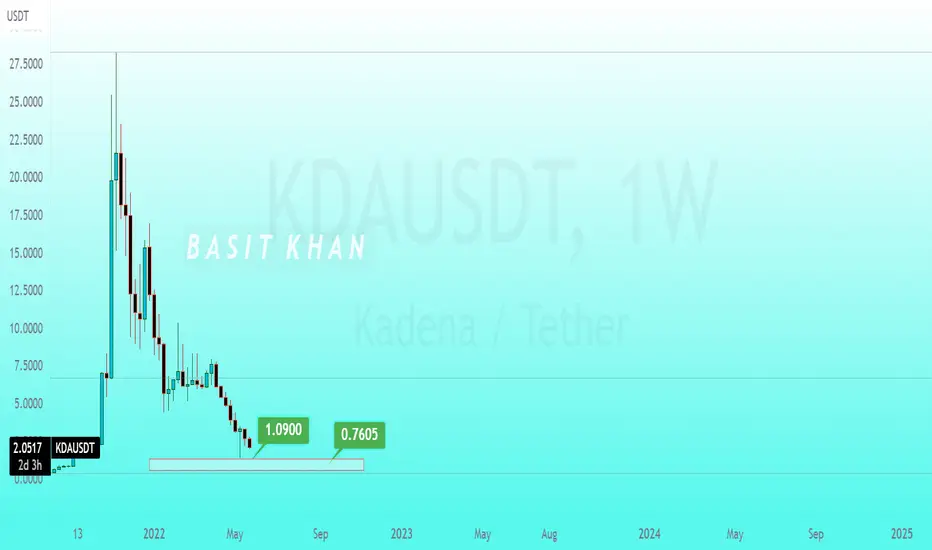
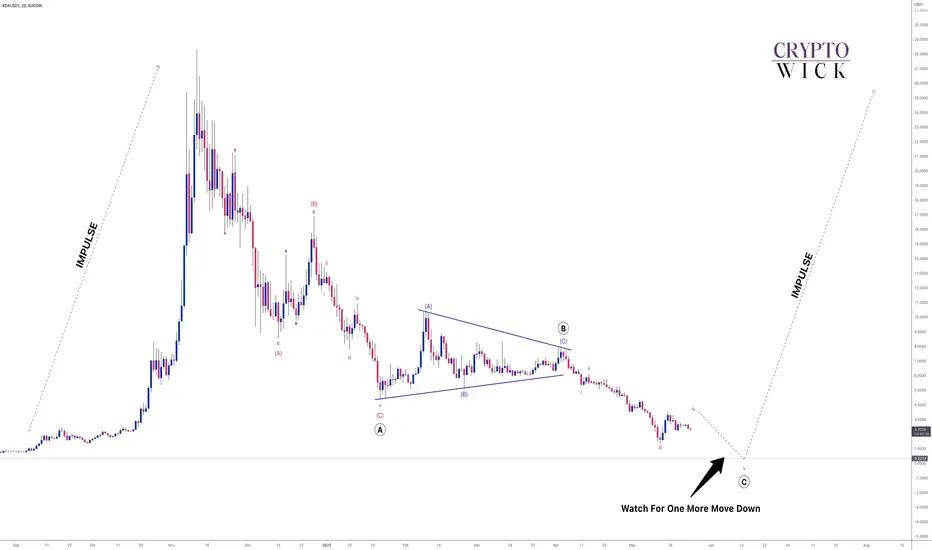
KADENA - Elliott Wave Breakdown ✅A simple chart of Kadena where we got a big ABC wave. We can see that we're on wave C. Expecting one more drop before we look for buys.
Will update once we see the final drop.
What do you guys think?
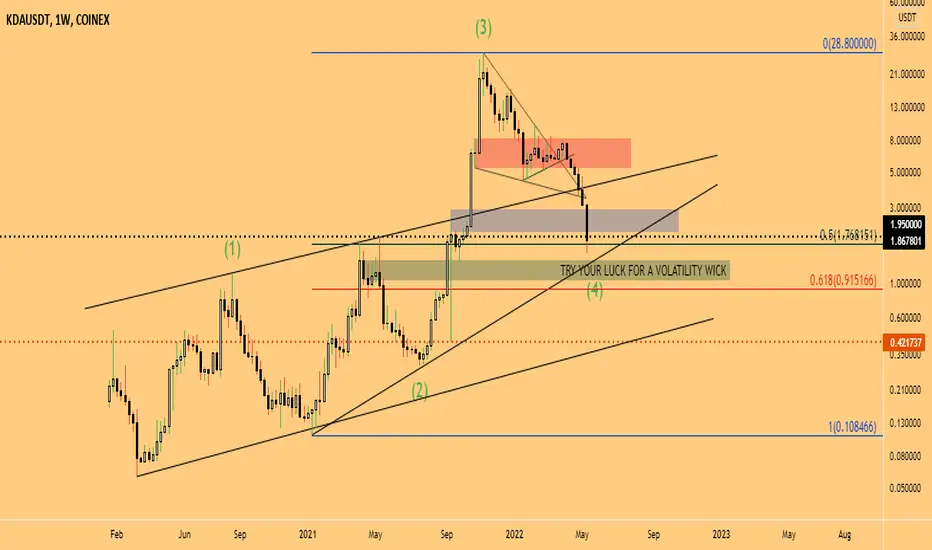
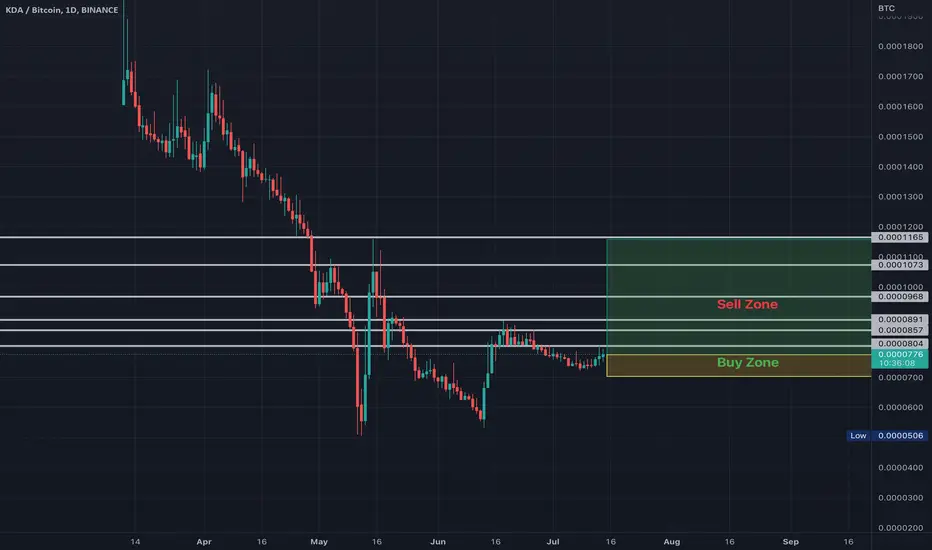
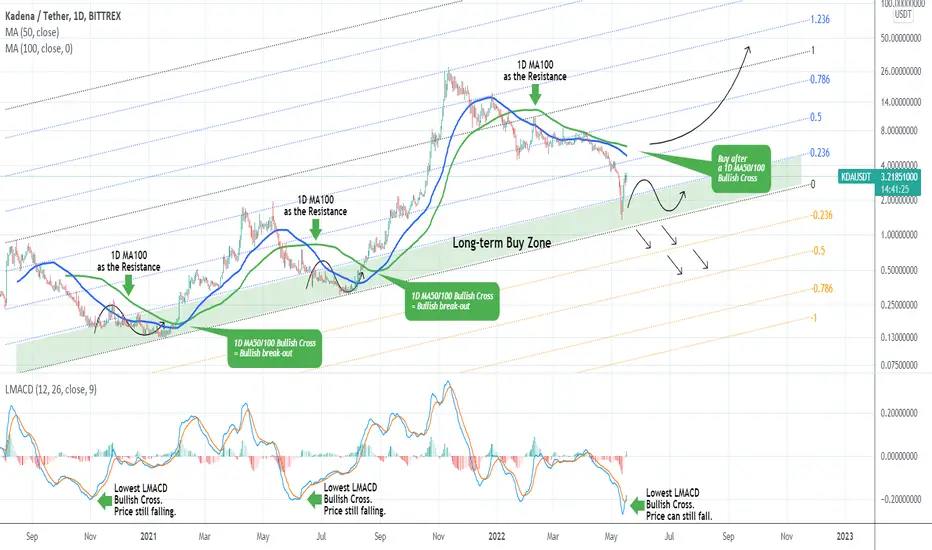
KDAUSDT Rebounded on the long-term Buy Zone.Kadena (KDAUSDT) is having one of the strongest rebounds from the top 100 cap coins. Besides the fundamentals involved, a key technical reason is the fact that it entered the long-term Buy Zone and almost hit the bottom (Higher Lows trend-line) of the Fibonacci Channel pattern that formed since its first trading days.
However this rebound may be short-lived as despite the Bullish Cross on the 1D LMACD, the price always dipped a little lower after this formation. In fact, the last two rallies in February 2021 and August 2021 were confirmed only after the 1D MA50 (blue trend-line) and the 1D MA100 (green trend-line) formed a Bullish Cross. Basically during these corrections, the 1D MA100 has been acting as a Resistance and its break confirmed the uptrend. This matches perfectly the recent price action and correction, as the 1D MA100 has been the Resistance since January 13 2022.
As a result buy only if you have a long-term perspective as the price may dip towards the -0.236 or even the -0.5 Fibonacci extensions until a permanent bottom is formed. Otherwise, wait for a 1D MA100 break or the Bullish Cross of 1D MA50/100.
--------------------------------------------------------------------------------------------------------
Please like, subscribe and share your ideas and charts with the community!
--------------------------------------------------------------------------------------------------------
KDAUSDTTHIS IS MY IDEA ABOUT KDA , For now KDA set the doube top pattern and going to retrace and after that you can go buy !
NOT FINANCIAL ADVICE
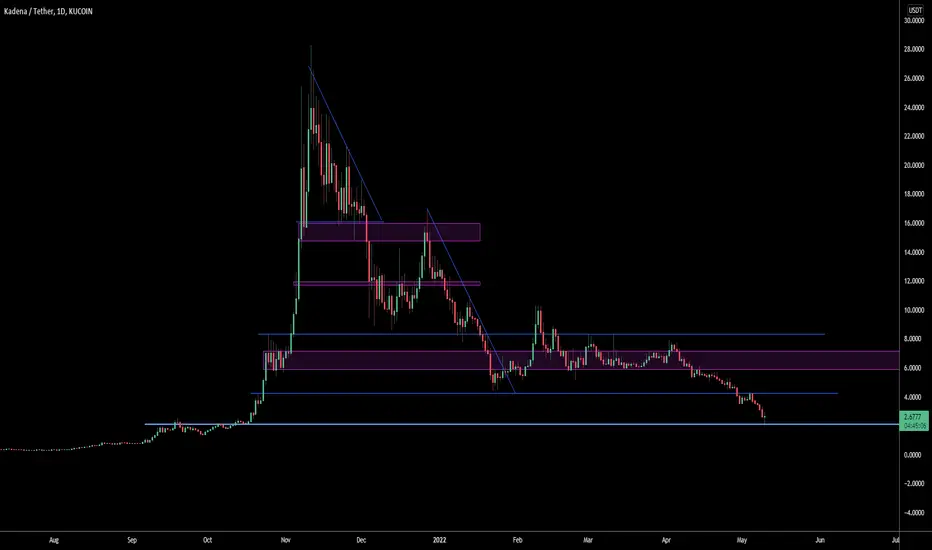
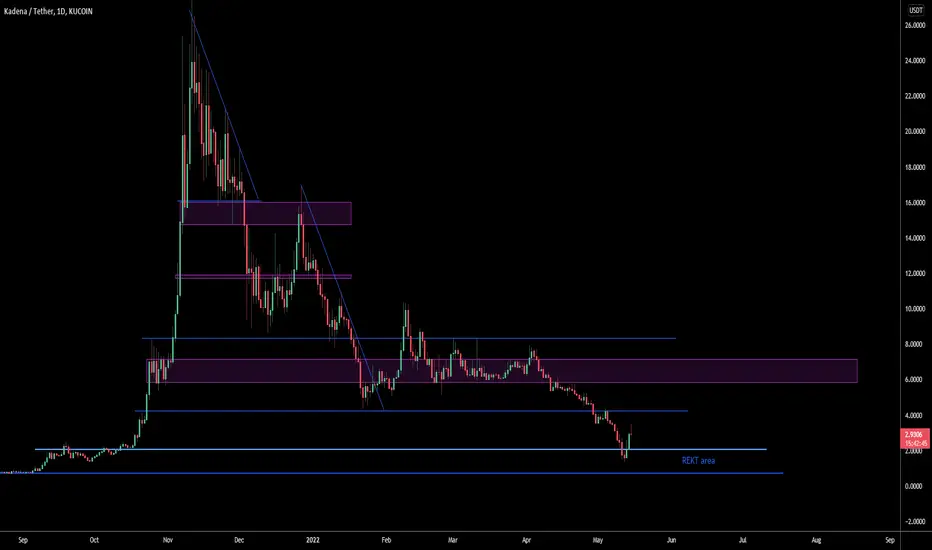
Kadena (KDA) support/resistance lines (update)Just an update on where things with Kadena stand. We had a strong bounce from the Rekt zone showing big strength. Definitely a project to keep your eye on.
ALMOST AT THE BOTTOM - (KADENA UPDATE ANALYSIS)Carrying on with our series of analysis on Kadena(KDA), our search for the bottom is nearing it's end hopefully.
In our previous analysis we identified a falling wedge pattern that could signal a reversal to the upside for kda, however it failed to do any good. Analysis with updates shown below(refer for context);
While we now have our buy region of $2 finally, are we bottomed out yet?
Referring back to our original analysis shown below, we pointed out the $1-$0.9 region to try our luck for volatility for an alternate entry;
This level is in line with the golden pocket.
Other Ideas:
Bringing us to this point in time.
KDA has broken back into its channel up, and also a rising wedge in the process. Our volatility region falls in line with the bottom of the rising wedge structure and the golden pocket. If that were to break then we simply cannot rule out bottom of the channel as a possible price target where we also have strong horizontal support.
Targets will be revised if needed depending on where price finds support.
If you've benefitted from this series of analysis so far, I'm happy it was helpful.
If you agree, pls like share and comment your thoughts below.
As always, feed back is appreciated!
Bitcoin will play a huge role in determining the outcome