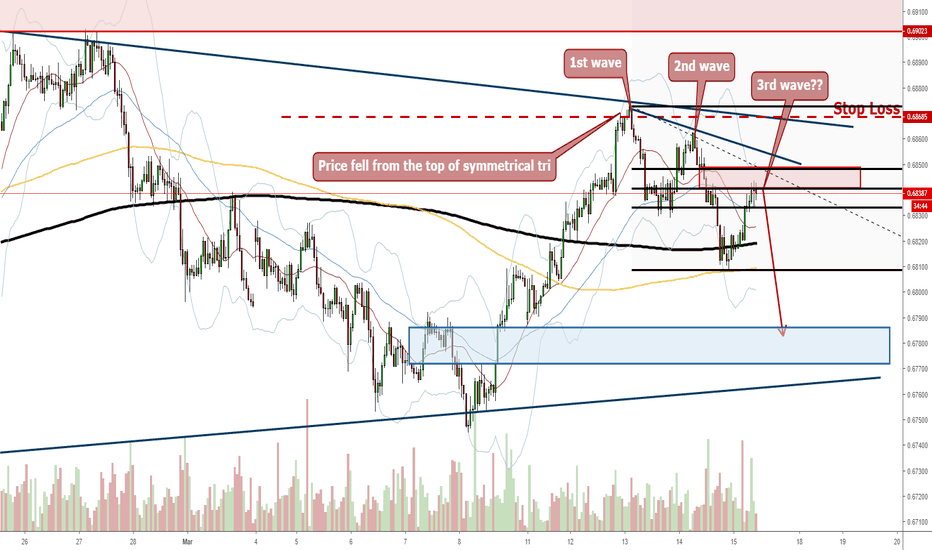
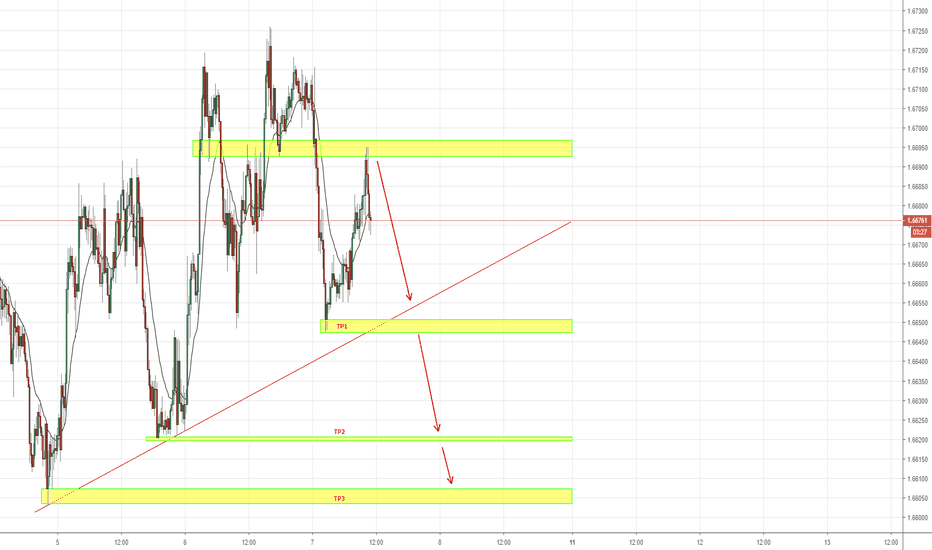
NZDUSD - Ready for 3rd Wave of Downtrend?Continuation of yesterday's forecast on NZDUSD, the price has retraced significantly after the completion of the 2nd wave of a bearish trend.
At this moment, the price is seen hovering near the supply zone at 0.684.
The retracement has hit a volume of 34 pips, similar to the previous wave of retracement just before the price dropped yesterday.
For a confirmation that the price will continue to fall for the 3rd wave, it has to first break below 0.683.
At the same time, we should keep a close watch on the dollar which is seen quite sluggish as it attempts to rebound and climb higher.
Kiwi
EW ANALYSIS IN DETAILS: NZDUSD Forming Bullish Setup?!Hello traders!
Today we will talk about Kiwi (NZDUSD) and we will show you how EW works in details if you have the right approach!
Well, Kiwi made a nice five-wave rally with extended wave (v) into a wave "i" last week, which in EW usually suggests a bullish reversal! So, after every five waves, a three-wave pullback follows in wave "ii", and as you can see, at the beginning of this week, Kiwi slowed down in a three-wave (a)-(b)-(c) correction, which can be approaching the end soon, right here around important 0.6800 support area!
That said, if we see a sharp bounce here in the projected support area, followed by a break back above 0.6865 region, then we can confirm our wave count which can send price even much higher within wave "iii" towards 0.69 - 0.70 area or maybe even higher!
Anyway, keep in mind that corrections can be very complex, for example deeper or more sideways price action. So, as long as price remains above 0.6745 invalidation area, we will remain bullish!
Trade well!
Disclosure: Please be informed that information we provide is NOT a trading recommendation or investment advice. All of our work is for educational purposes only.
NZDUSD Short - Falling from Top of Symmetrical TriVery simple and straightforward forecast here.
The NZDUSD has bee ranging within a symmetrical triangle for the last 6 weeks.
Price has climbed for 3 consecutive days and in the H1 chart, the rising trendline is already seen broken below.
The price has then retraced two waves in the M15 chart after the rising trendline in the H1 chart was broken.
Therefore, this is a straightforward and simple trade idea to short from the top of a major range after signs of reversal has appeared.
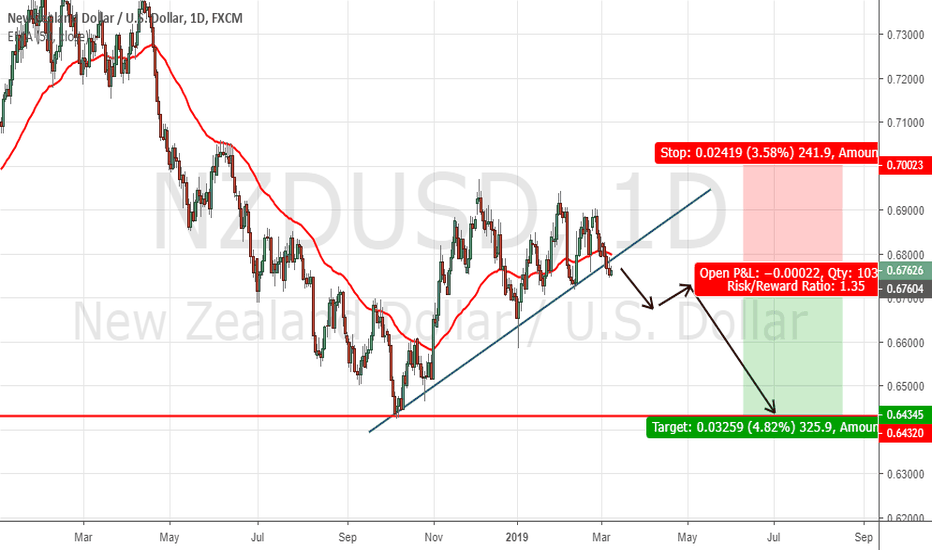
Potential NZDUSD SetupThis setup is based on the 4H chart. The overall trend is bearish, and I expect the price action (PA) to follow through. As I labelled on the chart, an evening star formed suggesting a reversal sign. The ideal situation is that we need to see a reversal signal on the Daily chart, so it will give us a stronger bias.
If the price push up again, I'll sell this pair. Let's see if the market will give us another chance.
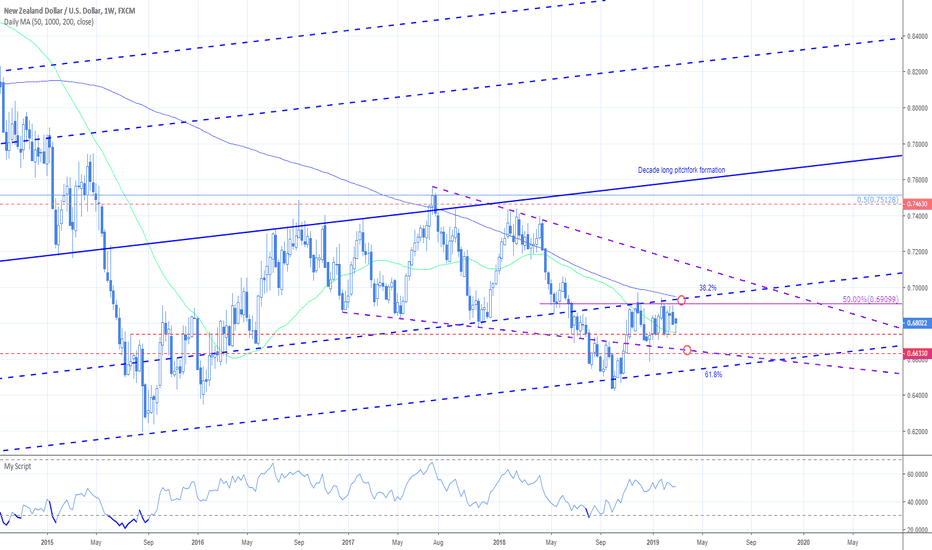
NZDUSD weekly outlookThe kiwi has held its narrow range between the 50% fib retrace @$0.69 & $0.673 which has been a solid pivot area. Now alongside those 2 levels we have 2 moving averages. The 200 day joins the bottom of the range & the 200 week joins the top.
The key formation though is the triangle (purple dashed) so a push through the 200 day and the lower slope of the triangle comes in @$0.665. A break through the 200 Week targets the upper slope. Always keep in mind the long-term pitchfork formation (Blue).
Daily
A shorter term triangle is forming & both slopes also coincide with the moving averages
4 Hour
