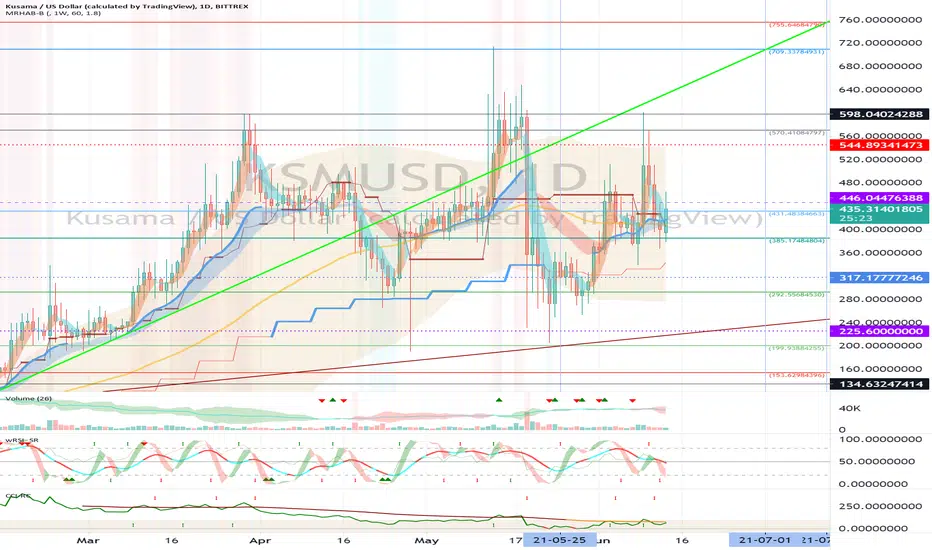
Kusama (KSM) - July 3Hello?
Welcome, traders.
By "following", you can always get new information quickly.
Please also click "Like".
Have a good day.
-------------------------------------
(KSMUSD 1W Chart)
If it moves above the 225.6 point and moves along the uptrend line, I would expect it to turn into an uptrend.
(1D chart)
If the price is maintained in the 199.93884255-292.55684530 range, it is expected to turn into an uptrend.
If it goes down, you should check to see if it finds support at the 153.62984396-199.93884255 zone.
If it falls from the 134.63247414 point, it is likely to enter the mid- to long-term investment zone, so you need to trade cautiously.
-------------------------------------
(KSMBTC 1W chart)
To continue the uptrend, the price must rise above the 0.006193 point to hold the price.
(1D chart)
It must rise above the 0.006898 point to turn into an uptrend.
In particular, it is important to maintain the price above the 0.006193 point.
If it goes down, you should see support at the 0.004715 point.
If it falls from the 0.004715 point, it is likely to enter the mid- to long-term investment zone, so you need to trade cautiously.
------------------------------------------
We recommend that you trade with your average unit price.
This is because, if the price is below your average unit price, whether it is in an uptrend or in a downtrend, there is a high possibility that you will not be able to get a big profit due to the psychological burden.
The center of all trading starts with the average unit price at which you start trading.
If you ignore this, you may be trading in the wrong direction.
Therefore, it is important to find a way to lower the average unit price and adjust the proportion of the investment, ultimately allowing the funds corresponding to the profits to regenerate themselves.
------------------------------------------------------------ -----------------------------------------------------
** All indicators are lagging indicators.
Therefore, it is important to be aware that the indicator moves accordingly with the movement of price and volume.
However, for the sake of convenience, we are talking in reverse for the interpretation of the indicator.
** The wRSI_SR indicator is an indicator created by adding settings and options to the existing Stochastic RSI indicator.
Therefore, the interpretation is the same as the traditional Stochastic RSI indicator. (K, D line -> R, S line)
** The OBV indicator was re-created by applying a formula to the DepthHouse Trading indicator, an indicator disclosed by oh92. (Thanks for this.)
** See support, resistance, and abbreviation points.
** Support or resistance is based on the closing price of the 1D chart.
** All descriptions are for reference only and do not guarantee a profit or loss in investment.
Explanation of abbreviations displayed in the chart
R: A point or section of resistance that requires a response to preserve profits.
S-L: Stop Loss point or section
S: A point or section where you can buy to make a profit as a support point or section.
(Short-term Stop Loss can be said to be a point where profit and loss can be preserved or additional entry through split trading.
GAP refers to the difference in prices that occurred when the stock market, CME, and BAKKT exchanges were closed because they are not traded 24 hours a day.
G1 : Closing price when closed
G2: Opening price
(Example) Gap (G1-G2)
KSMKRW
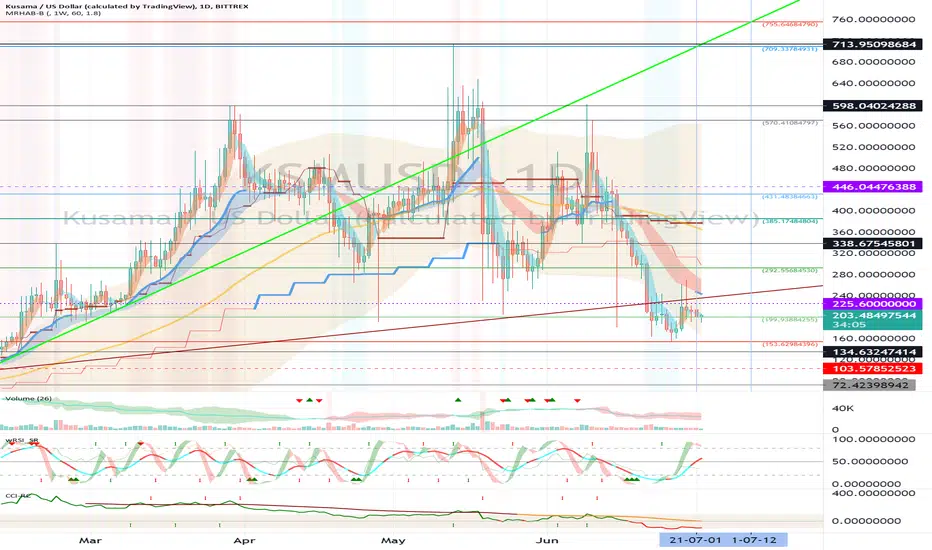
Kusama (KSM) - June 14Hello?
Welcome, traders.
By "following", you can always get new information quickly.
Please also click "Like".
Have a good day.
-------------------------------------
(KSMUSD 1W Chart)
If the price holds above the 225.6 point, it is expected that the uptrend will continue.
(1D chart)
We need to see if we can climb above the 446.04476388 point.
If it goes down, you should check to see if it finds support at the 385.17484804-431.48384663 zone.
If support is found at the 385.17484804-431.48384663 zone, I expect the uptrend to continue.
If it falls in the 292.55684530-317.17777246 section, Stop Loss is required to preserve profit and loss.
However, it may follow an uptrend line, so you need to trade cautiously.
--------------------------------------
(KSMBTC 1W chart)
We need to see if we can continue the uptrend along the uptrend line.
If the price holds above the 0.006193-0.007310 range, we expect to maintain an upward trend.
The 0.004715 point is an important point and it is important not to decline from this point.
(1D chart)
Having completed a double top, I think the downside is more likely.
Accordingly, careful trading is required.
If you fall from the 0.010649 point, you need a short stop loss.
However, caution is advised as it may touch the 0.009502 point and move upwards along the uptrend line.
If it falls in the range of 0.006898-0.007549, Stop Loss is required to preserve profit and loss.
If it rises to the 0.014710-0.015361 section and finds support, it is expected to set a new direction.
------------------------------------------
We recommend that you trade with your average unit price.
This is because, if the price is below your average unit price, whether it is in an uptrend or in a downtrend, there is a high possibility that you will not be able to get a big profit due to psychological burden.
The center of all trading starts with the average unit price at which you start trading.
If you ignore this, you may be trading in the wrong direction.
Therefore, it is important to find a way to lower the average unit price and adjust the proportion of the investment, ultimately allowing the funds corresponding to the profits to regenerate themselves.
------------------------------------------------------------ -----------------------------------------------------
** All indicators are lagging indicators.
Therefore, it is important to be aware that the indicator moves accordingly with the movement of price and volume.
However, for the sake of convenience, we are talking in reverse for the interpretation of the indicator.
** The wRSI_SR indicator is an indicator created by adding settings and options to the existing Stochastic RSI indicator.
Therefore, the interpretation is the same as the traditional Stochastic RSI indicator. (K, D line -> R, S line)
** The OBV indicator was re-created by applying a formula to the DepthHouse Trading indicator, an indicator disclosed by oh92. (Thanks for this.)
** See support, resistance, and abbreviation points.
** Support or resistance is based on the closing price of the 1D chart.
** All descriptions are for reference only and do not guarantee a profit or loss in investment.
Explanation of abbreviations displayed in the chart
R: A point or section of resistance that requires a response to preserve profits.
S-L: Stop Loss point or section
S: A point or section where you can buy to make a profit as a support point or section.
(Short-term Stop Loss can be said to be a point where profit and loss can be preserved or additional entry can be made through split trading. It is a short-term investment perspective.)
GAP refers to the difference in prices that occurred when the stock market, CME, and BAKKT exchanges were closed because they are not traded 24 hours a day.
G1 : Closing price when closed
G2: Opening price
(Example) Gap (G1-G2)
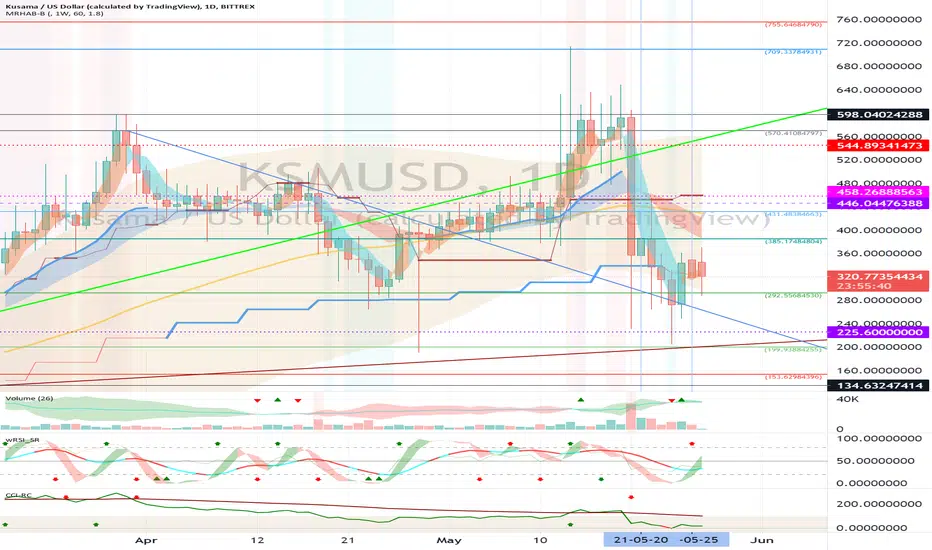
Kusama (KSM) - May 26Hello?
Dear traders, nice to meet you.
By "following" you can always get new information quickly.
Please also click "Like".
Have a good day.
-------------------------------------
(KSMUSD 1W chart)
(1D chart)
We have to see if we can get support at 292.55684530 and rise above the -385.17484804 point.
If it falls at 292.55684530, you need a Stop Loss to preserve profit or loss.
However, if it does not fall below the downtrend line, it is expected to rise, so careful trading is necessary.
If the rise to 385.17484804-431.48384663 gains support, it is expected to lead to further gains.
--------------------------------------
(KSMBTC 1W chart)
(1D chart)
We have to see if we can make a sidewalk in the 7549 Satoshi-9502 Satoshi section.
In particular, it remains to be seen if it can rise along the uptrend line.
If it falls, we need to make sure we get support in the 6898 Satoshi-7549 Satoshi section.
If you fall at the 6898 Satoshi branch, you need Stop Lsos to preserve profit and loss.
However, it may rise along the uptrend line, so careful trading is necessary.
--------------------------------------
It is advisable to trade at your average unit price.
This is because if the price flows below your average unit price, which was on an uptrend or downtrend, there is a high possibility that you will not be able to earn a large profit due to the psychological burden.
The center of every trade starts with the average unit price you start trading.
If you ignore this, you may be trading in the wrong direction.
Therefore, it is important to find a way to lower the average unit price and adjust the proportion of the investment, so that the money that ultimately corresponds to the profit can regenerate the profit.
-------------------------------------------------- -------------------------------------------
** All indicators are lagging indicators.
So, it's important to be aware that the indicator moves accordingly with the movement of price and volume.
Just for the sake of convenience, we are talking upside down for interpretation of the indicators.
** The wRSI_SR indicator is an indicator created by adding settings and options from the existing Stochastic RSI indicator.
Therefore, the interpretation is the same as the conventional stochastic RSI indicator. (K, D line -> R, S line)
** The OBV indicator was re-created by applying a formula to the DepthHouse Trading indicator, an indicator that oh92 disclosed. (Thank you for this.)
** Check support, resistance, and abbreviation points.
** Support or resistance is based on the closing price of the 1D chart.
** All explanations are for reference only and do not guarantee profit or loss on investment.
Explanation of abbreviations displayed on the chart
R: A point or section of resistance that requires a response to preserve profits
S-L: Stop Loss point or section
S: A point or segment that can be bought for profit generation as a support point or segment
(Short-term Stop Loss can be said to be a point where profits and losses can be preserved or additionally entered through installment transactions. It is a short-term investment perspective.
GAP refers to the difference in prices that occurred when the stock market, CME, and BAKKT exchanges were closed because they do not trade 24 hours a day.
G1: Closing price when closed
G2: Market price at the time of opening
(Example) Gap (G1-G2)