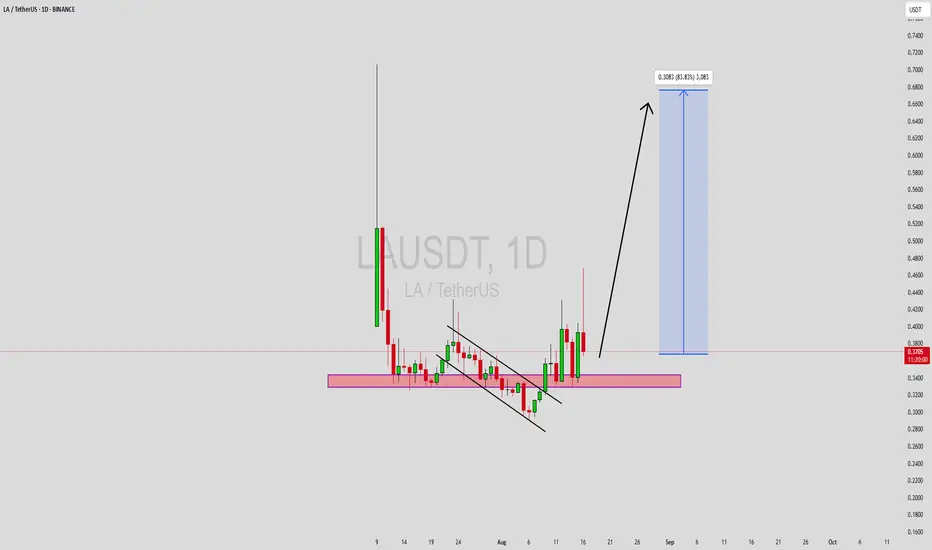
LAUSDT Forming Bullish WaveLAUSDT is currently displaying a bullish wave pattern on the chart, signaling a strong continuation setup that may lead to a significant upside breakout. This wave formation often suggests growing momentum and accumulation, where each successive pullback is followed by a higher low. Combined with strong volume inflows, the technical structure supports a bullish thesis in the short to mid-term.
The price is steadily climbing, forming clear impulsive waves with corrective pullbacks—indicating that buyers are consistently stepping in. This kind of bullish wave pattern, especially when supported by volume and investor activity, often precedes large moves. The current projection shows potential gains of 80% to 90% if price follows through with the wave structure and breaks above key resistance levels.
LAUSDT has started gaining attention among traders due to its technical clarity and well-defined trend behavior. With the crypto market entering a more optimistic phase, setups like this become increasingly reliable. Traders and investors are advised to monitor wave continuation, breakouts above recent highs, and overall volume confirmation to time entries effectively.
✅ Show your support by hitting the like button and
✅ Leaving a comment below! (What is You opinion about this Coin)
Your feedback and engagement keep me inspired to share more insightful market analysis with you!
LABTC
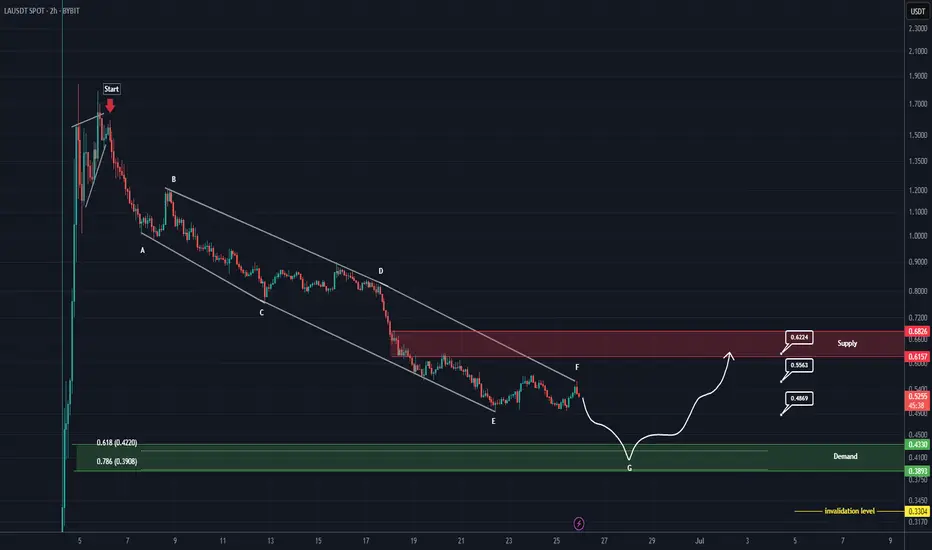
LA Analysis (2H)From the point where we placed the red arrow on the chart, it appears that LA has entered a correction phase.
There isn’t much data available for this coin, but the correction seems to be forming a diametric pattern.
We’ve highlighted the most optimal zone for the completion of the final wave of this diametric (wave G) with a green area on the chart.
Targets are marked on the chart.
A daily candle closing below the invalidation level will invalidate this analysis.
For risk management, please don't forget stop loss and capital management
Comment if you have any questions
Thank You