#LDO/USDT#LDO
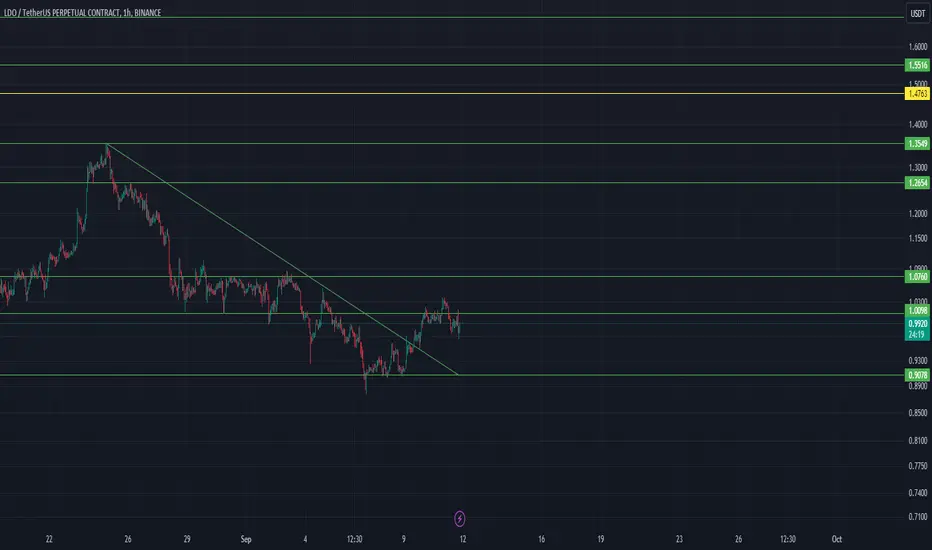
The price is moving within a descending channel on the 1-hour frame, adhering well to it, and is on its way to breaking strongly upwards and retesting it.
We have support from the lower boundary of the descending channel, at 1.128.
We have a downtrend on the RSI indicator that is about to be broken and retested, supporting the upside.
There is a major support area in green at 1.10, which represents a strong basis for the upside.
Don't forget a simple thing: ease and capital.
When you reach the first target, save some money and then change your stop-loss order to an entry order.
For inquiries, please leave a comment.
We have a trend to hold above the 100 Moving Average.
Entry price: 1.139.
First target: 1.172.
Second target: 1.210.
Third target: 1.270.
Don't forget a simple thing: ease and capital.
When you reach your first target, save some money and then change your stop-loss order to an entry order.
For inquiries, please leave a comment.
Thank you.
Ldousdtidea

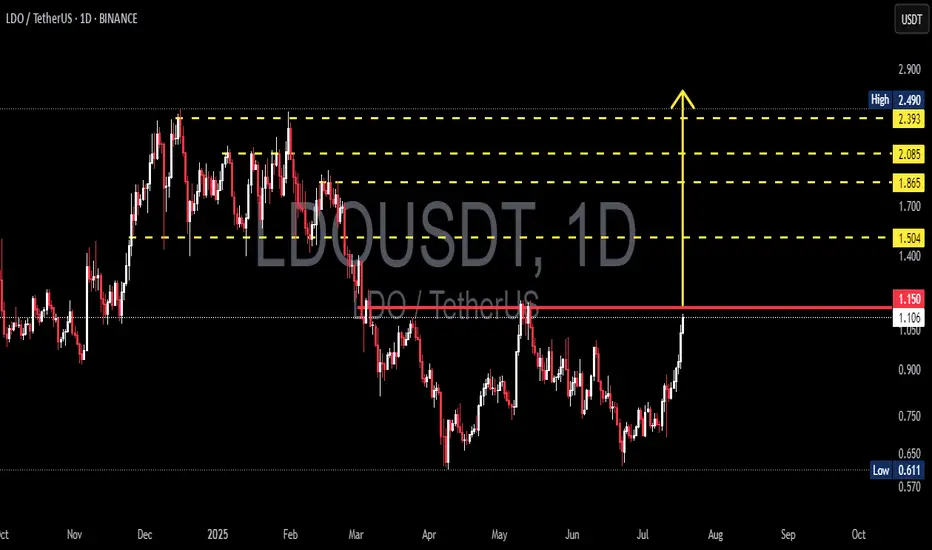
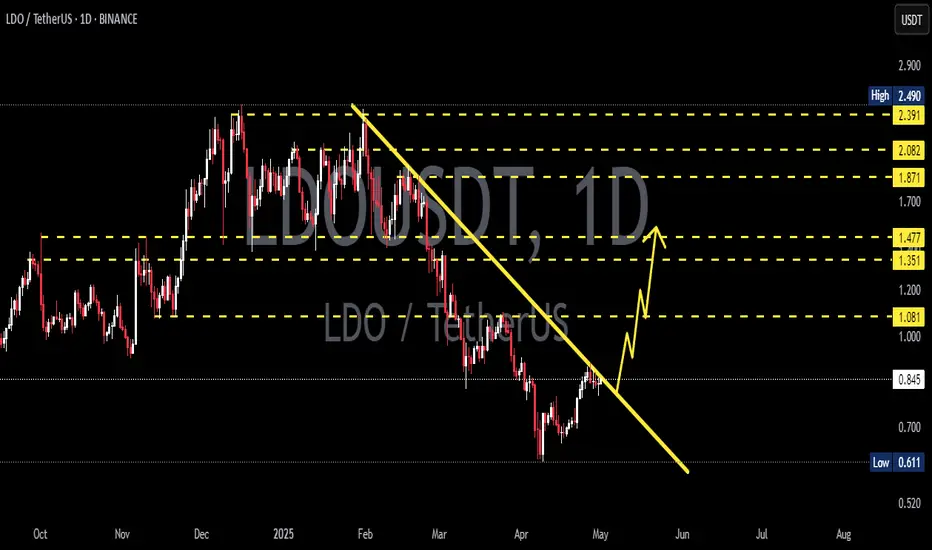
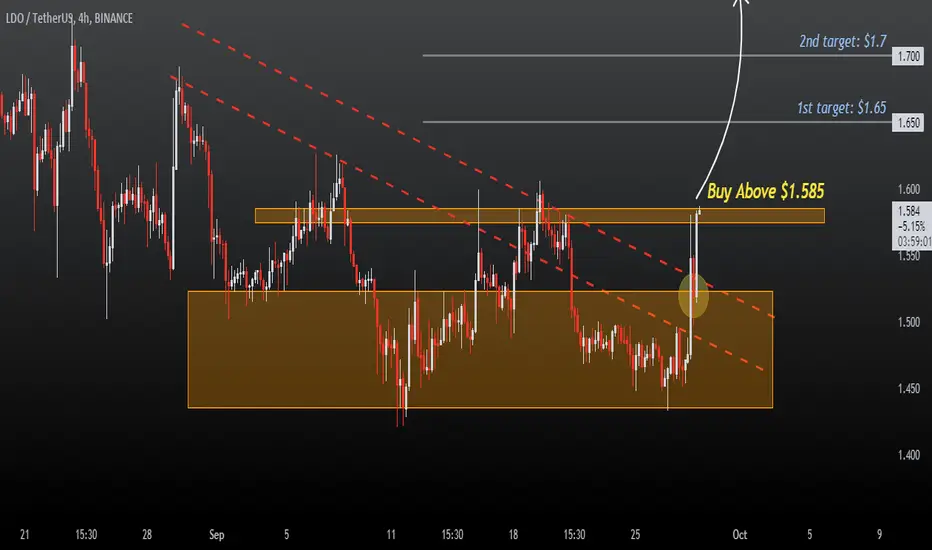
LDO/USDT Breakout Watch Ready to Fly After a Strategic Breakout?🔍 Full Technical Analysis
After months of downtrend and tight consolidation, LDO/USDT is showing clear signs of a bullish resurgence. The breakout above the key psychological resistance at $1.15 opens up a wide path toward higher resistance zones, potentially marking the beginning of a strong upward trend.
📐 Key Pattern Formed:
✅ Double Bottom Pattern
> Clearly visible from May to July 2025, with a neckline at $1.15. This is a classic bullish reversal pattern. The breakout above the neckline confirms the setup, projecting a significant upward move based on the measured height of the pattern.
✅ Horizontal Resistance Breakout
> The $1.15 level acted as a major resistance since April 2025. A clean breakout above it suggests that bulls are regaining control of the market momentum.
✅ Bullish Scenario (Primary Bias)
If the price successfully holds above the $1.15 zone and confirms it as support (successful retest), we may witness a bullish rally targeting the following levels:
🎯 Target 1: $1.504
— A minor resistance and previous consolidation area.
🎯 Target 2: $1.865
— A strong resistance level from earlier distribution zones.
🎯 Target 3: $2.085
— A technically significant level and key reaction point from past price action.
🎯 Target 4: $2.393 – $2.490
— A major supply zone and swing high from early 2025. This serves as the potential final target of the current bullish leg.
🟢 Volume increased during the breakout — a strong confirmation signal that this move is genuine, not a fakeout.
🟢 RSI likely gaining strength — though not shown on this chart, momentum indicators are likely supporting the move with a breakout from neutral levels.
❌ Bearish Scenario (If Breakout Fails)
If the price fails to hold above $1.15 and drops back below $1.05:
🔻 Potential Fakeout Risk
— A correction could send LDO back to:
Minor support at $0.90
Base support at $0.75
Major support at $0.611 (2025’s low)
📉 A breakdown below $0.611 would invalidate the bullish structure entirely, putting LDO back into a strong downtrend.
📊 Final Thoughts:
> LDO/USDT is at a critical decision point. A clean breakout from a strong medium-term structure opens the door for a significant bullish continuation. With pattern confirmation and strong volume support, this setup could mark the beginning of a mid-term uptrend.
The key lies in holding above $1.15 and watching for a healthy retest. This is a premium setup for swing traders and trend followers looking for early entries before a possible major move.
🧠 Trading Tips:
✅ Ideal Entry: On successful retest around $1.15 – $1.10
❌ Stop Loss: Below $1.00
📈 Targets: $1.50, $1.85, $2.08, and $2.49 (scaling out recommended)
#LDO #LDOUSDT #CryptoBreakout #AltcoinRally #TechnicalAnalysis #DoubleBottom #CryptoSignals #TradingViewIdeas #SwingTradeSetup #BullishPattern
LDOUSDT 1D AnalysisLDO ~ 1D Analysis
#LDO Buy gradually after retesting this support block with a short term target of at least 10%+ from here.
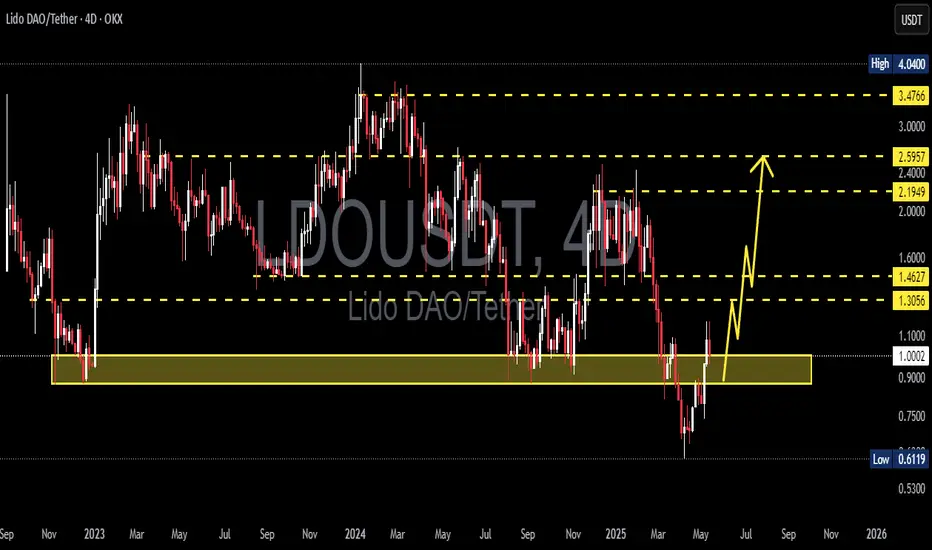
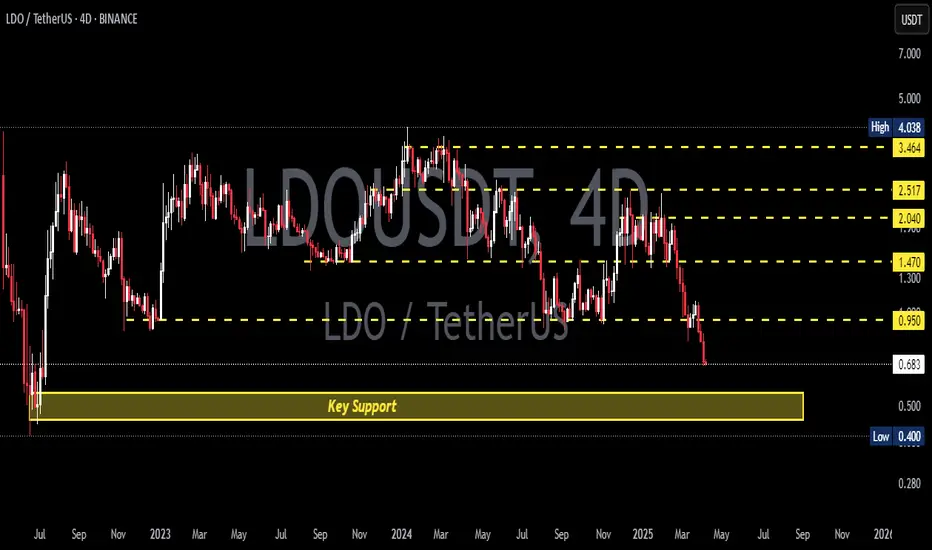
LDOUSDT 4D Analysis LDO ~ 4D Analysis
#LDO Buy gradually from here if you still have confidence in this coin with a short term target of at least 20%++
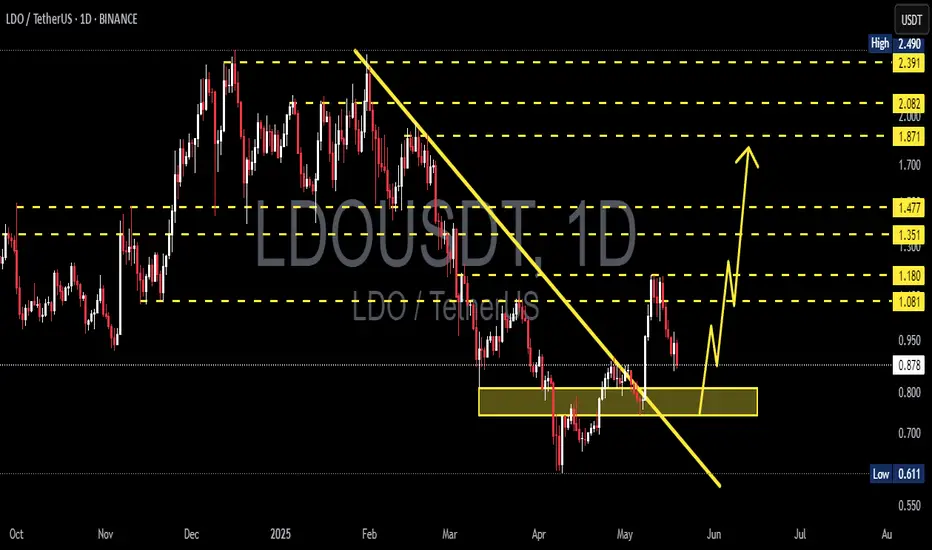
LDOUSDT 1D AnalysisLDO ~ 1D Analysis
#LDO Buy after successfully penetrating this resistant line with a short -term target of at least 10%+ from here.
LDOUSDT 4DLDO ~ 4D Analysis
#LDO Buy when visiting this support with a short -term target of at least 15%+.
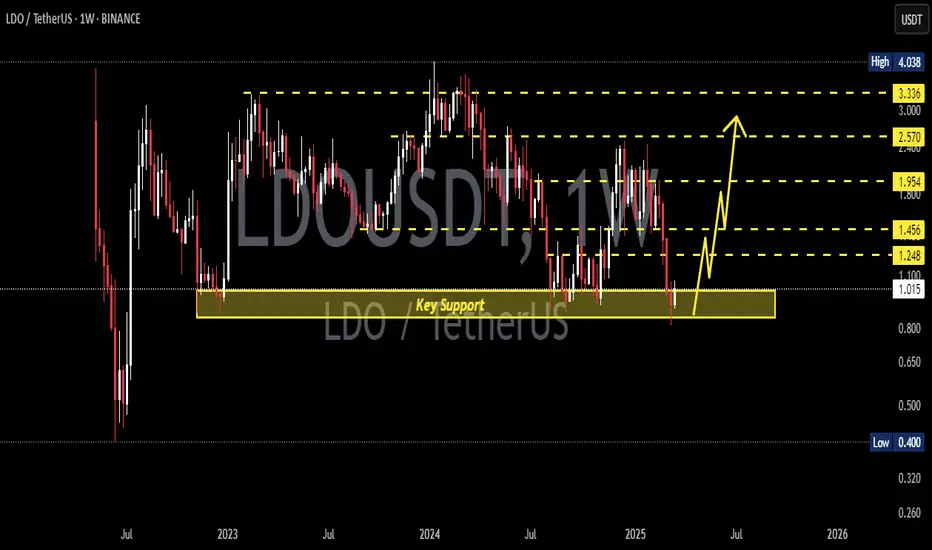
LDOUSDT 1WLDO ~ 1W Analysis
#LDO So far it still continues to maintain this support. Buy gradually from here with a short -term target of at least 20%+.
LDO/USDT Consolidates: Ready for a Breakout After 917 Days?$LDO/USDT is currently trading within a wide sideways range for the past 917 days, consolidating between the key demand/support zone and the key supply/resistance zone.
A potential bullish breakout could occur if the price breaks and sustains above the upper marked resistance zone.
This breakout may lead to a significant upward move, making it a critical level to watch.
DYOR, NFA

LDOUSDT 1WLDO Update ~ 1W
#LDO So far it continues to maintain its bullish structure. This is a very good support Block for gradual rebuys. With a minimum target of 20%+

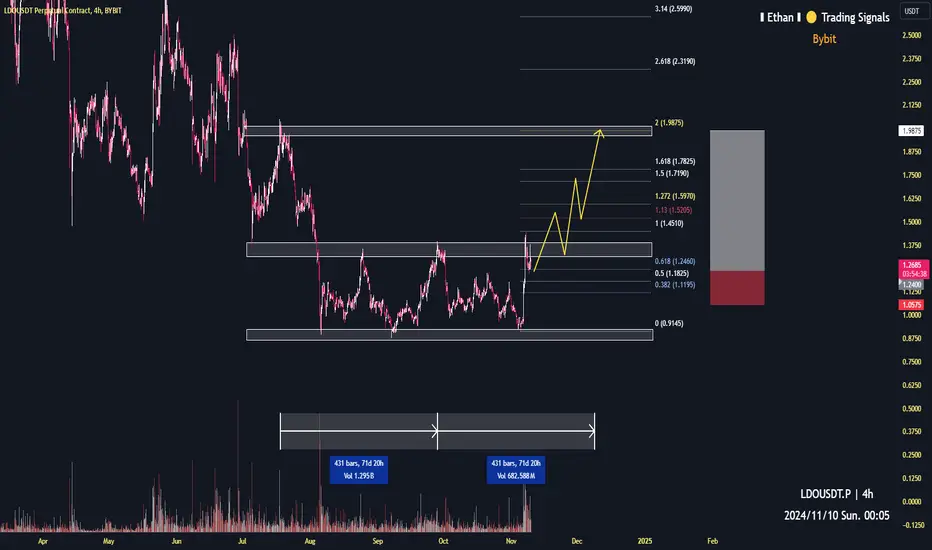
LDO target $1.984h time frame
-
Entry: $1.24
TP: $1.9875
SL: $1.0575
RR: 4.1
-
(1) Symmetrical structure is creating, high possibility to reach previous high
(2) Strong pump recently that bring LDO from $0.87 to $1.45 in two days
(3) Getting support at fib 0.618, which is $1.24
(4) $2.5 will be easy to hit if momentum is enough based on the flipped structure
(5) Stop loss once going below $1.0575
LDOUSDTLDO ~ 1W
#LDO If you still have Conviction on this coin,. You can place your first purchase on this support block. and you can place the second purchase on the next support block.

LDOUSDTLDO ~ 1W ✅
MIL:LDO Our first purchase will be active here.
❗ We will make a second purchase if this key support is unable to withstand bear pressure. and of course you already know our target price for this scenario.

LDOUSDT: READY TO GO LONG at SUPPORTHello,
Welcome to the quick update of LDOUSDT. From the last few months we can see LDOUSDT in a downtrend and has dumped more than 50%.
Currently, it is trading in the range of .9480 to .9981. We can see it breaking the channel and is currently trying to retest. The immediate support levels to watch for are .91 to .94.
We can take a small position at around 0.9621 and DCA until .9081 with a STOPLOSS of 0.8711.
The targets to watch for are:
1.0444
1.0711
1.1324
1.1767
1.3511 and 1.5573 (This is for the long run)
Until then, stay tuned and trade with caution, ensuring strict STOPLOSSES!!
This is not financial advice, please do your research before investing, as we are not responsible for any of your losses or profits.
Please like, share, and comment on this idea if you liked it.
ScramblerG is always there to help and trade with caution but DYOR.
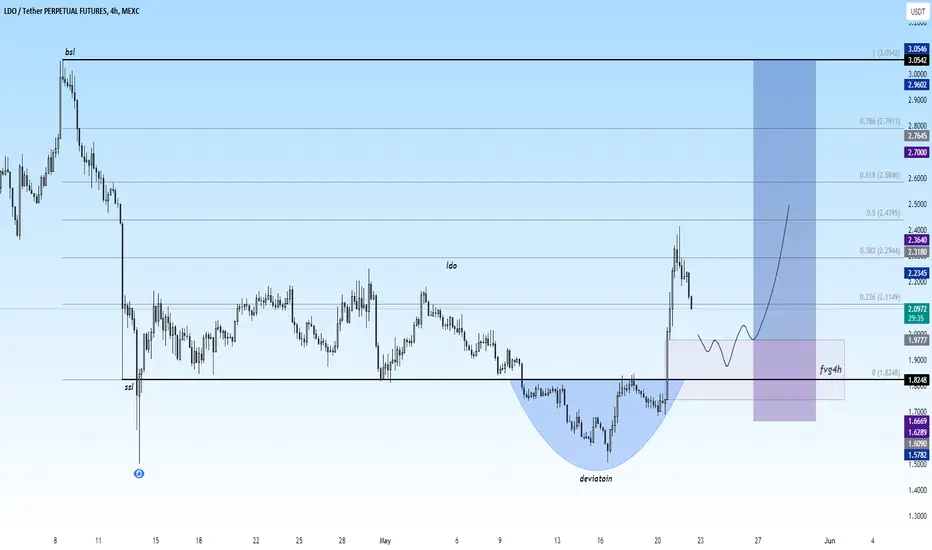
LDO long setupThe bias turned bullish for cryptocurrencies...
Here I share my MIL:LDO long setup...
Wait for:
- SSL
- Deviation
- Demand
- Enter Long
LDOUSD 1WLDO ~ 1W
#LDO This chart really looks bad. Support 1. $1.45 & Support 2. $0.96
I won't say this will happen for sure, But it's a bad chart in our opinion.

LDOUSD 1WLDO ~ 1W 📈
#LDO Make purchases gradually in this Support zone, with a minimum target of 20%+ from here 📈

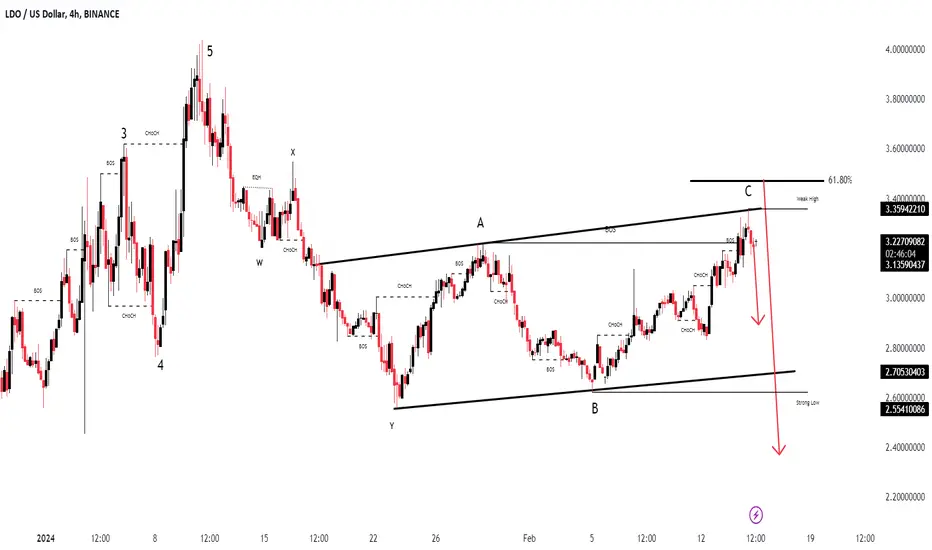
LDOUSD Pair : LDOUSDT
Description :
Impulse Correction
Bullish Channel as an Corrective Pattern in Short Time Frame and Rejection from Upper Trend Line
Completed Impulsive Waves and Corrective Waves " ABC "
Break of Structure and Completed Retracement
LDOUSDT LONGBINANCE:LDOUSDT.P
forgot to share this earlier just got tapped in and already in profit.
1D TF was in uptrend,pulled back and took 4H liquidity and then broke to the upside took the entry on discount zone.

LDO NEXT TARGETS!Hi guys,
.
LDO buy opportunity
.
.
You can find the targets on my chart
.
STAY SAFE AND HAPPY HOLIDAYS

LDOUSDT IdeaLDOUSDT - BINANCE:LDOUSDT
🚨 Risk warning, disclaimer: the above is a personal market judgment and analysis based on published information and historical chart data on The trading view,
And only some of these analyzes are my actual real trades.
I hope Traders consider I am Not responsible for your trades and investment decision.
✅ Please write any advice or suggestions.
✅ Pls send me the name of the currency pair or index that you intend to review and analyze.
LDO - Short Setup in 1 HR TF> Bearish Divergence MatureBINANCE:LDOUSDT.P
LDO - Short Setup
When price Break of H.L. Enter for Short
Target and SL Mentioned
Double Top and Bearish Divergence show weakness in price momentum in coming hours.

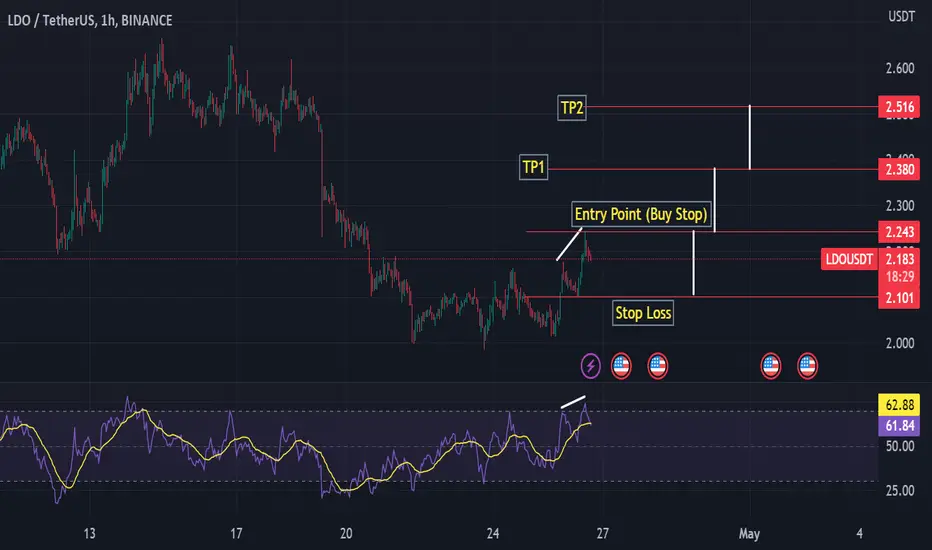
LDOUSDT - Bullish Trend - 1H TFBased on the chart pattern analysis, it appears that the price is forming higher highs (HHs) and higher lows (HLs), which indicates a bullish trend. Furthermore, the Relative Strength Index (RSI) showing divergence is synced currently. I recommend taking a long trade with a risk/reward ratio of 1:1
Please note that this is my personal analysis and trade plan, and it is important for you to conduct your own research and risk management strategies before making any trading decisions.
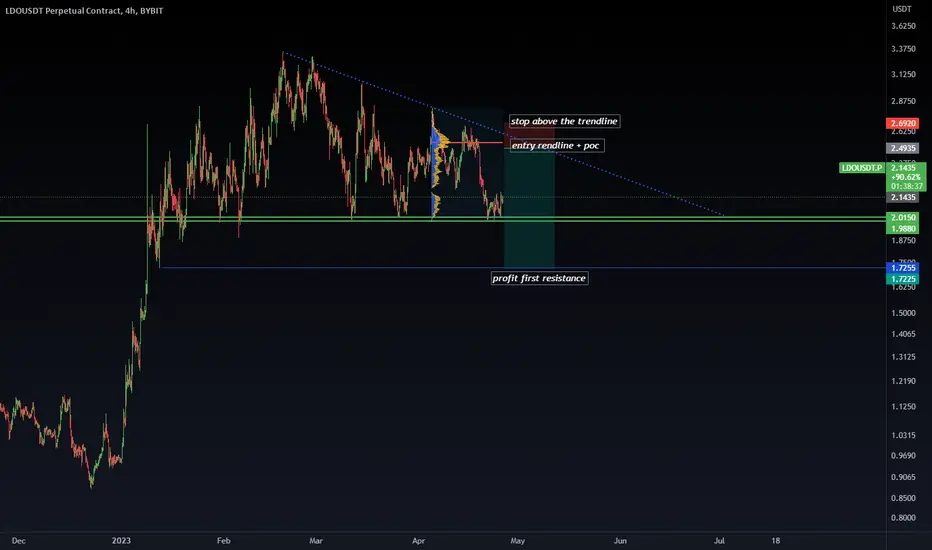
ldo short setup ldo short setup
trendline resistance
Welcome to the bull trader community a completely different level of trading. 📈🐋
Trades / Updates / Insights / Educational Content / Useful Bots & Alerts / And a lot of plans ahead ! 📊📚
The best place to learn and become crypto elite with other like-minded people in the industry !