Why most people fail as retail traders?I see two main reasons which complement each other for the high rate of failure.
First and foremost, the media and the industry promote this idea that it’s easy to become a profitable trader and anybody can go it. This is, of course, not true. Theoretically, anybody can do it if willing to put the effort and approach it as a business. Practically almost nobody approaches trading with the same rigorousness as any other professional endeavor.
Let’s put aside the first reason, about which there is not much we can do. A big chunk of the industry relies on peoples being naive and we’re not going to change that. On top of the first reason, we have a second reason related to people themselves. Most of those who try trading financial markets simply don’t manage their emotions and risk well enough to survive the learning curve.
Managing your own emotions turns out to be a complex endeavor and constantly changing market conditions lengthen the learning curve. One of the things that makes this business so attractive is also the main thing that makes it so difficult to master.
The direct and sometimes violent feedback you receive from the market, after each trading decision, has an astonishing impact on a human’s ability to keep his psychological well being in check and control his own reactions. It has the potential to disrupt executive functions and trigger instinctual “fight or flight” responses. This leads to emotional trading or trading on tilt which quickly generates more losses than any other mistake you could make in this business.
Most other jobs have a protective buffer zone between usual day to day work decisions and the ultimate feedback — end of the month paycheck. This profession doesn’t. Every little call you make has an immediate impact on your capital. Every little mistake can take a portion of your capital away and every good decision can bring it all back and more. This kind of psychological exposure is heavily distressful and being aware of its mechanisms makes a huge difference.
So … psychology differentiates the pro. Don’t get me wrong … professional discretionary traders are not emotionless but are much more aware and in control of their reactions. The successful pro deeply understands that trading is mainly about people's perceptions and the rest are just details.
You may ask yourself how can such a level be reached? A starting point is to stay away from any market, financial instrument, time frame, trading technique, or any combination of those that doesn’t fit who you are deep inside. The least the exposure to triggers that can awake the demons within, the best.
Always seek strategies that you understand and match your inner self. For example … if you are impatient trade shorter time frames, if you are very risk-averse don’t use huge margin, if you are risk-averse but you don’t have enough capital use margin with a tight risk management (maybe options), if you have a statistical mind try quantitative approaches etc. There are infinite possibilities to adapt to yourself and is a must to do it if you want to have a chance.
It always amuses me to see the vast majority of educational resources geared towards what market does when most of the success in this business is knowing how you adapt to the market, whatever it may do. And, of course, the market is, more or less, the other traders.
Learningtrading

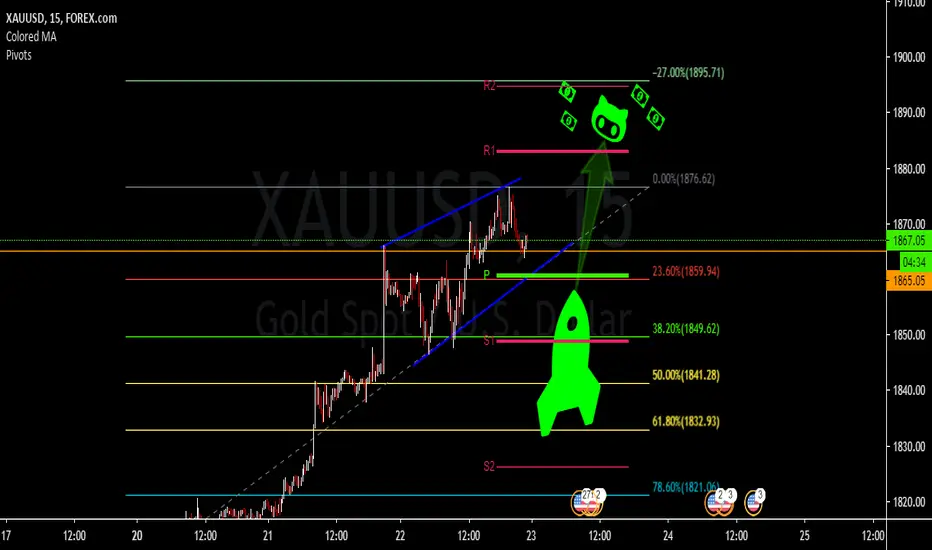
XAUUSD in route for a nice retracement? Watching this retracement closely as we embark on another voyage with gold this year.... how low can we go? (1860-1830's would be ideal)
Like this chart if it brought a smile to your face in this stressful day :D OANDA:XAUUSD
I am having a bit of fun while doing my analysis with this chart, it is good for the heart. I will be posting more thorough analysis from here on
Gold overall trend is bullish(Monthly chart), I believe there won't be a correction until a Vaccine for Covid is passed or around elections.
This chart is for educational purposes, this is not an investment advice.
AFTER CONFIRMING ABOVE 9180$ LET'S SEE IF WE REACH 9500$...LOTS OF LOVE & GOOD LUCK!! HARD TIMES COMING!

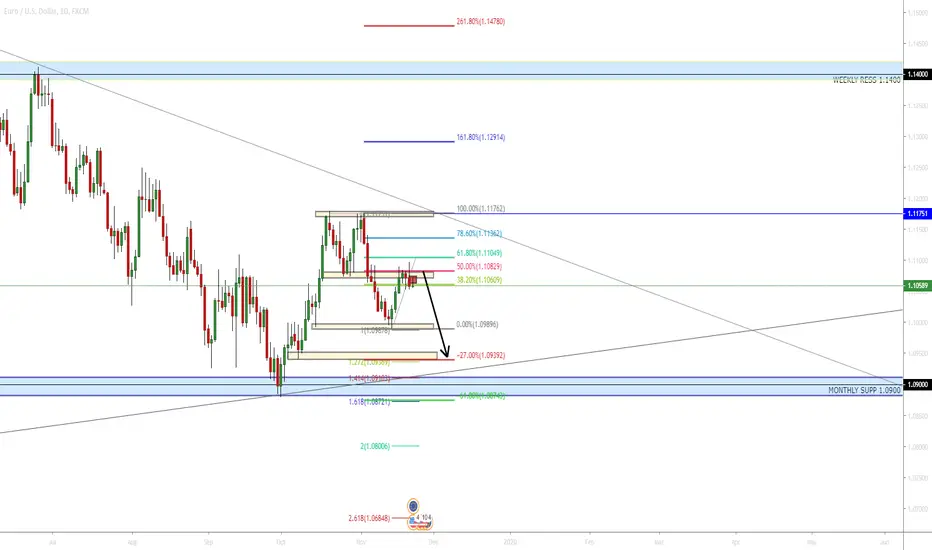
EUR/USD SHORT - DAILY TREND LINE1. Previously created a Double Top,
2. Rejecting nicely from the Fibonacci 50% resistance -> was also previous HL.
3. Downtrend
4. 4H chart creating a shooting star
We have 4 confluences.
Please if you have experience in trading and have a different opinion leave comments and say why as I'm looking to improve my trading analysis. <3
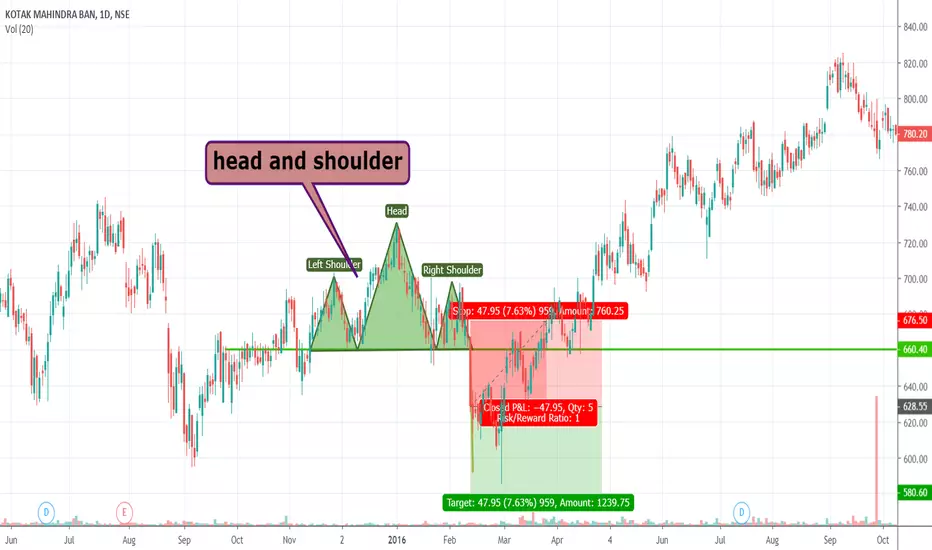
GBPUSD SHORTAfter seeing 3 rising peaks previously, price moved down significantly. I assume a similar pattern will occur now also.

USDCAD SHORT -Price has reached a TL resistance.
1H shows that:
Looking to keep a sell open until 1.30180.


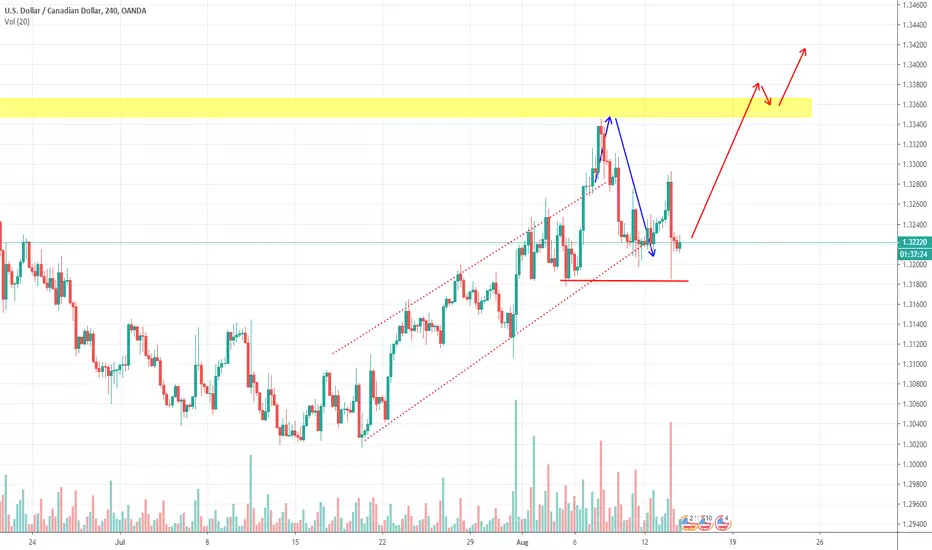
USDCAD Long scenario1.32200 is the suggested price to go long. Price makes a recent double bottom and USD is getting stronger. Use money management plan.
Good trades!
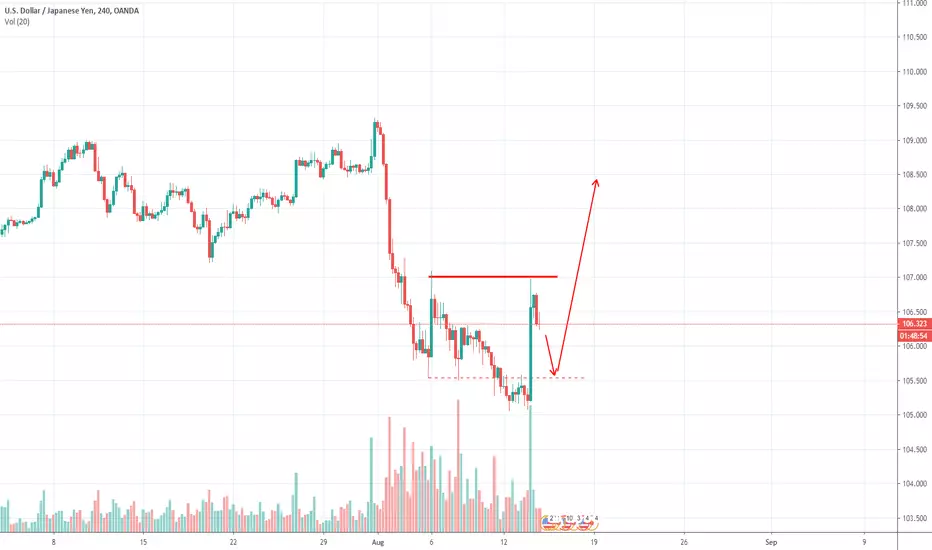
USDJPY New Bullish trend ?After the recent bullish move on USDJPY and knowing USDX is strengthening, the most probable price direction is bullish and we expect to see under and over pattern plays since we make a recent double top. Waiting for price action confirmation at 105.500 level!
NZDUSD ShortDXY is getting stronger and then NZDUSD is in a bearish market profile, the suggested price for sell is in the selling area (around 0.64900)
use a money management plan,
Good trades !!

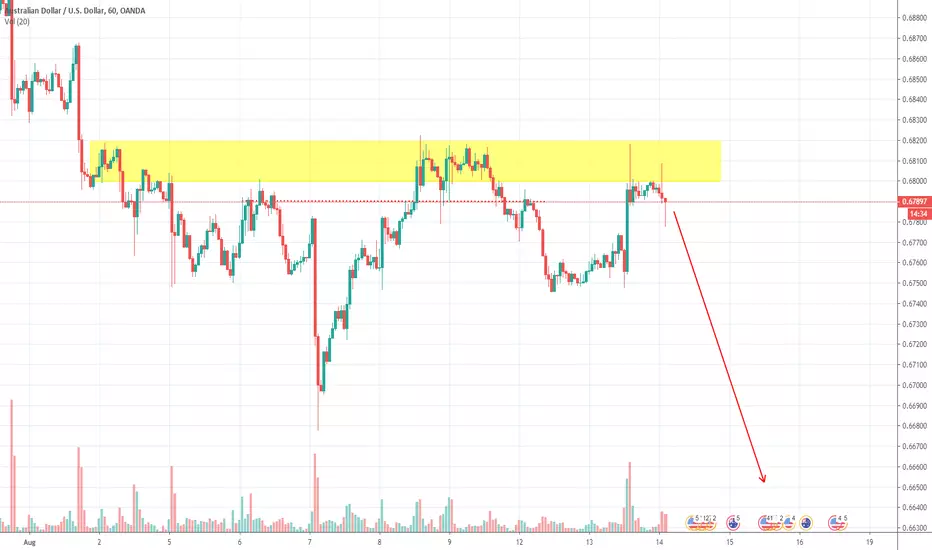
AUDSUD market viewDollar is strengthening and AUDUSD make a clear rejection in the sell area, time to go short from 0.67900. You can use any edge to find your entry and remember using money management plan. Stop loss should be over the supply. take profit is open, hold around two days drops : )
Good trades !
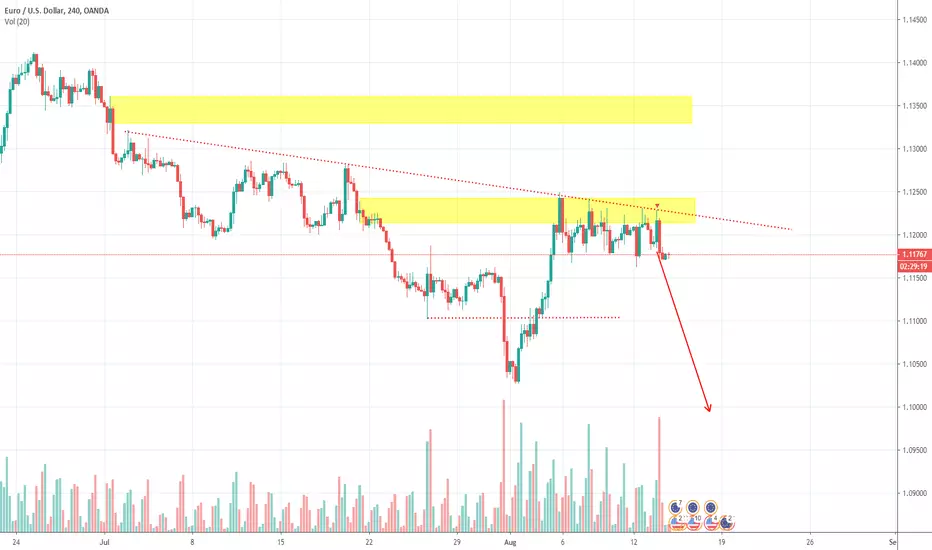
EURUSD Short scenario After making a bearish engulfing from supply level as the Dollar get more strength, the most obvious scenario is a drop. Suggest price to sell, enter at current market price with stop loss over the supply. Good trade !!
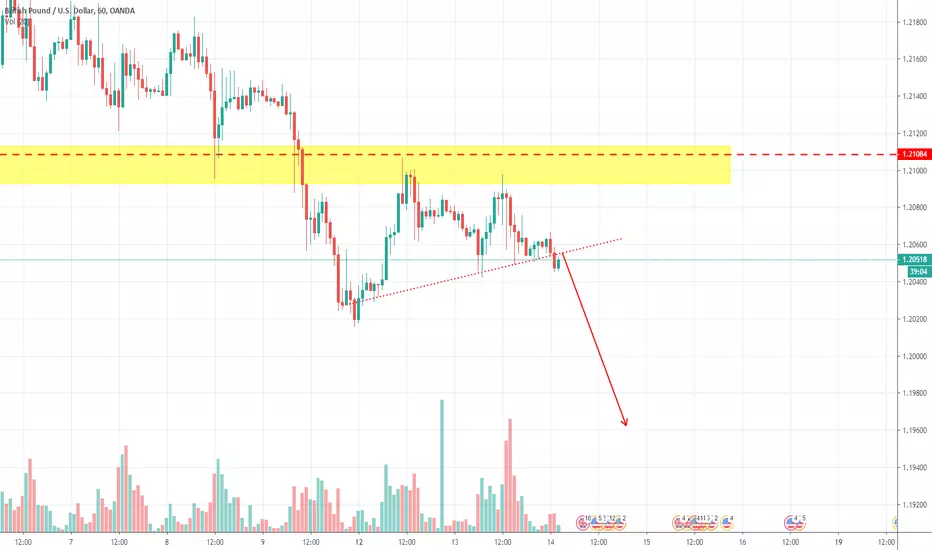
GBPUSD Bearish trendUSD make a bullish day yesterday and close over 94.80. obviously, price decide to move down and entry-level I suggest since it breaks the trendline is 1.20500 to 1.20600.
Sell, Sell, Sell! Keep using money management plan and stop-loss over the supply. Good trade. Take profit is open.
BTC - Elliott wave Analysis from 1/8/19 - Learner's moduleThis post is for those who wish to improve their Elliott wave analysis. Interested traders can comment their wave counts. Wave counts will be updated based on the discussion in the comments. Right or wrong, feel free to comment your wave counts. This post is only meant to learn. My wave counts can be right or wrong, as I am also a learner.
Do read my earlier post(link post shared in the related ideas below) where I analysed the bigger picture of BTC's correction.
Here are some resources for learning Elliott wave theory -
Books :
Five waves to financial freedom by Ramki N. Ramakrishnan(I am currently reading this)
Elliott wave principle by A.J.Frost and Robert Prechter
Mastering Elliott wave Principle by Constance Brown
Online :
elliottwave-forecast.com
school.stockcharts.com
school.stockcharts.com
school.stockcharts.com
bullwaves.org
www.thebalance.com


What is Price Action? All Indicators are a Derivative of PriceThere is no one clear definition of price action. It can be as simple as "Every tick on any given chart, of any given market." However this definition is too broad and does not adequately describe the term. A better definition is "The collective result of buyers and sellers entering the market for any logical reason, which together create reoccurring patterns that can be analyzed and capitalized."
Price action is based on humans behaving rationally, logically, and similarly in similar situations over time, and is the cumulative effect of institutional trading. It has been, and always will remain fundamentally unchanged. If you compare a chart from 100 years ago (such as the crash of 1929) with one of today with the time scales removed, you will not be able to tell the difference between the two. It does not matter if you compare a yearly, monthly, daily, or even 1 minute chart with any other chart of a different time frame. Price action appears the same and works the same in every market, and on every time frame. The institutions cannot hide what they are doing; price action is their foot print.
Price action can be used to invest long term, or day trade any market. It allows a trader or investor to identify opportunities without the use of any indicators. In fact, all indicators are a derivative of price action in one form or another. Interestingly, the patterns which repeat as well as trend tendencies can be observed on different charts, even outside of markets.
Can you tell a difference between these two charts? The first is a daily chart of CSX. The second is a 5 minute chart of the MES (micro s&p). All markets and charts look the same, and behave similarly. Once you understand the information within, you can understand what the institutions are doing at any given time.

USD/JPY - Fibonacci Retracement & Double Top4HR and 1HR Timeframe depicts a double top. Price broke the neckline and is now currently retracing. Price is sitting at Fib Level 38.20% (Green Zone) - Price action indicates that bears have some momentum. I think bears will start to reach resistance right around Fib Level 50.00% if bears continue to remain strong last enter could be around Fib Level 60.00%. If bears show no weakness and close pass the final price entry I would consider this trade a no go as rules would be broken. Ultimately looking for some signal of price action to enter the trade.
Note: There are two key levels that price is currently heading towards. Be on the lookout for some consolidation and signs of entry at these areas of possible opportunity.
Trading Journal #12
- Austin S.

My thoughts on BTC for the next couple of days/weeks.Please as I said in the video keep in mind that this video is for educational purposes, its very far from any type of financial advise!
Feel free to comment and give me your opinion and constructive criticism.
Happy trading everybody!

Market Volatility The vix indicates how volatile the market currently is. Right now, the VIX is sitting at 14.40. A neutral market is indicated by a vix being at 17. Since the vix is sitting on the low end, we should continue to see the market stay relatively safe. However, with all the ongoing issues of a slowing global growth, trade, and poor economic data, it would be best to keep your risk appetite low until things smooth over. The VIX is currently trading below the 50 EMA and 200 EMA.
