ADAUSD Correction DONE New Bull TrendImportant things to note:
I had suspected the correction for ADA was coming to an end.
BTC has confirmed this and will push to its next bullish target producing a new ATH.
There of course will be retracement along the way.
I said the market will be bullish this coming week and it is working out perfectly.
I have shown the price movements on the chart.
We have a new support of 2.08.
ADA price will lag behind a bit from BTC but will still be bullish.
We had a test of 50MA, I said the price will be back.
Once we cross 50MA for good next, ADA will push upward.
Important dates:
I will update all of the Cardano Summit News soon. I have mentioned a little bit during my chart updates. A LOT to look forward to. 5-10 years Cardano will be huge.
I realized ADA was likely out of the correction but I did not see confirmation from BTC. This was because I missed the 2nd lower low which I saw today after going back and looking through all of the timeframes. The correction is officially over. BTC will push to its next bullish target which is a new ATH, and it will go far past that in the coming months. ADA will follow this trend, however the bullish momentum will lag behind BTC a bit like it always does. We have a new support at 2.08 and I have marked the bullish price movements on the chart. We had a 50MA test which I was waiting for. Like I said before this means the price will be back to cross to 50MA and when it does, it will create bullish pressure upwards. This could create a short squeeze down the road when we get closer to expiration. I have said before that we will be bullish this coming week and everything looks like it will fall right into place. There will be retracements along the way, but we are back in a bullish trend. The 1D MACD looks great like I said before and I expect a cross within a few days. This news coming out of the summit was more than I could ask for and I plan to test their protocols very soon. As I said before I would like to develop on their platforms, it is just a little early right now and there aren't too many tools available. Overall, everything I heard confirmed to me that in the next 5-10 years cardano will be HUGE and likely used by the big banks due to their scalability. This was confirmed by the European tokenization firms during the summit. I haven't mentioned the deflation that will likely occur in the future, further increasing the price of ADA. I will be putting out an entire post summarizing the ADA Summit news, so stay tuned, there is a lot to cover. Anyways I will keep and eye on ADA and update you all accordingly! Enjoy!
I am going to make a video soon teaching everyone my approach to charting. I will cover the entire workflow process I go through. I hope you enjoy it.
Tell me what you think?
This is not financial advice. DYODD.
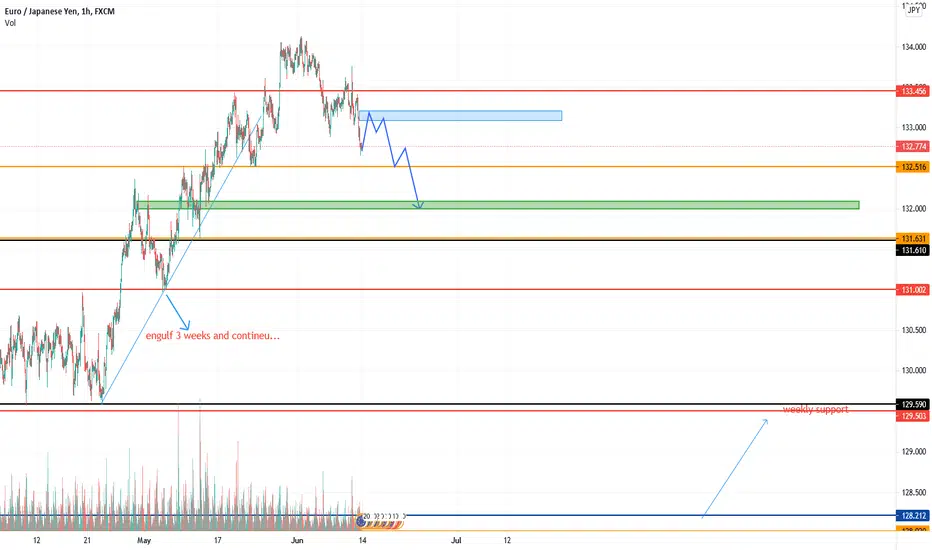
Level

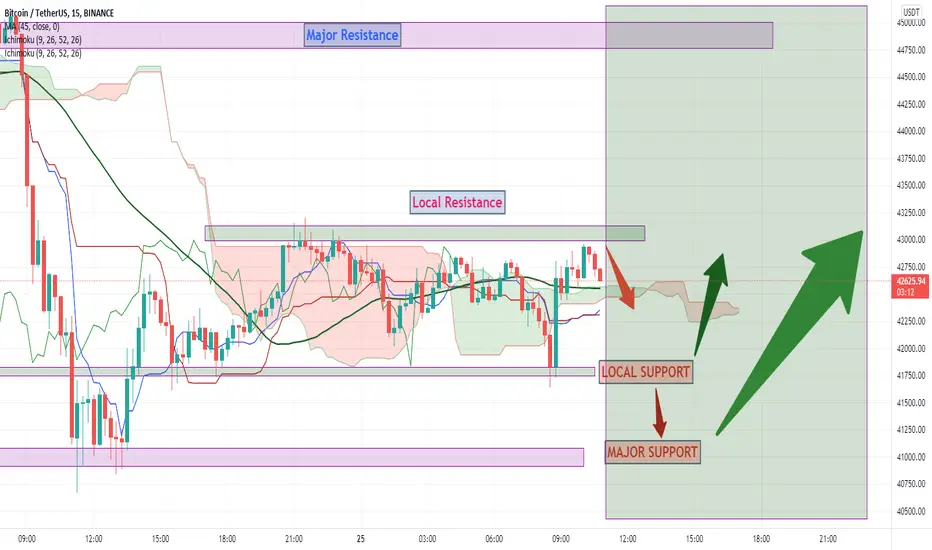
BTC USDT NEXT LEVEL By GURUDEV TRADERSNow You can Short till Local Support and Bounce back to Lock Support you can Buy
CELR double bottomPossible double bottom, a resistance level is a confirmation, RSI and SRSI relatively high, so it's POSSIBLE that we could soon see some kind of relief for indicators cool off in form of consolidation, pullback, or even retest of previous resistance level (red line). That relief could also come in form of retesting resistance level (yellow line) after the breakout, which would be ideal for long trade entry. Short scalp trade could be opened if we get a rejection from breakout level, or if we lose the support that is at 0,9468. Good luck traders

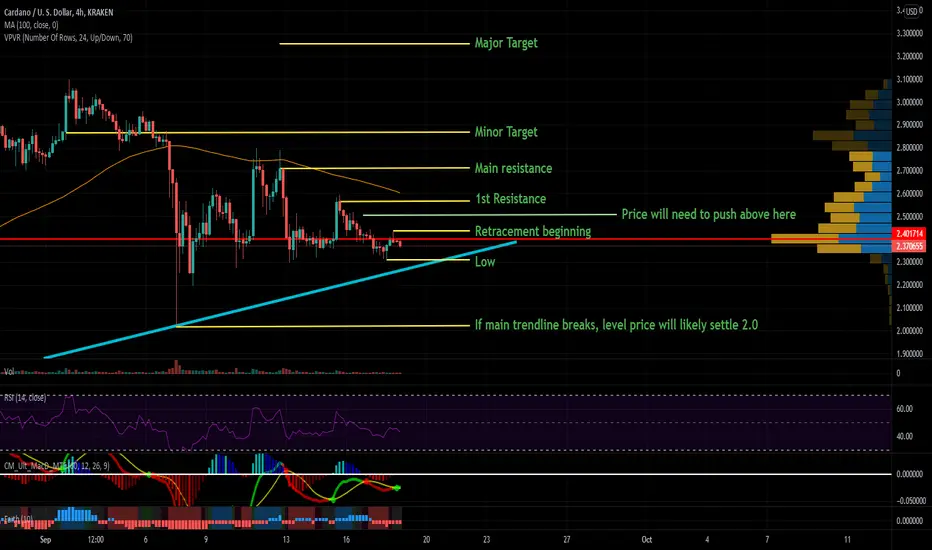
ADAUSD Key Levels ExplainedImportant things to note:
BTC is retracing at the moment. It does not look bearish at the moment. Likely to try the 50k level as I had said before. If bearish impulse price will fall to 42k.
Low at 2.31
Price moved to 2.44 and started retracing.
2.5 is the level ADA will need to hold to push higher.
I have noted the resistance levels ADA will need to test to push higher.
I have shown my minor target and major target on the chart.
If price breaks trendline it will head to 2.0
Bears have been profit booking every single rally.
Price is at key retracement level at the moment.
All of my levels are backed up by trend analysis and patterns.
Important Dates to Take Note of:
ADA Summit Sep 25-26 2021 (likely to produce more important dates)
BTC looks like it is retracing to test the 50k level right now and has held the 48k level that I had mentioned before. If there is a bearish impulse, you should expect 42k. So since I had some time sit down and analyze the market a bit more, I have decided to put out an accurate mapping of the price movements. The bullish divergence signaled a reversal which we are seeing right now with the small breakout to the upside on the 1H chart. The price is at a key retracement level for the new trend at the moment. Previously, bears had taken hold of ADA by profit booking every single push. The bullish divergence was the first sign things may be turning around. The price will need to hold 2.5 if it wants to push past resistance and if bullish sentiment remains, that is where I believe ADA is going. If the price make it to 2.5 if will likely run to the minor target. If things take a turn for the worse and BTC falls, ADA will break its trendline which will signal a drop the 2.0. However, right now, there is no sign that will happen. Things look good at the moment. Feel free to set alerts on the main trendline as well as the various levels I have mentioned on my chart! If you are trying to learn TA, I recommend picking up a book, learning, and start charting. Do not worry about being right or wrong, simply chart. I want everyone here to learn as much as they can and be able to apply it to their own charts and investments. I will continue to keep an eye on ADA and update you all accordingly! Thanks again!!
Also, it is worth mentioning that TradingView has reached out to me and offered me very kind words, and showed me some support. I thought that was very nice of them and it was very unexpected. Though, I never planned for any of this to happen at all. I was constantly making charts for myself and my friends and some of them suggested I post them publicly. I never imagined any of this would happen, if I did, I would have waited until I had a bit more free time LOL. However, it makes me really happy to know that people are learning from my charts and hopefully it will encourage you all to learn technical analysis for yourselves! In a couple weeks I will have more time to make the educational content you have been asking for, and I will likely chart a wide spectrum of assets. Thank you again for all of the support, it means more to me than you know!
Now for some good news. As a person who follows ADA closely, I know that the adoption of the platform will happen very quickly with the release of smart contracts on the 12th of September. In fact, I think it was built with such a great foundation, I might just do an entire post on the fundamentals of Cardano sometime in the future. Pretty soon, we will see NFTs being created, DeFi, applications being developed, and overall strong adoption of the ADA blockchain platform as a whole. If there will be any immediate reason for ADA to move higher, it will likely be news coming from the summit on the 25-26 of September. So I would keep an eye on their twitter accounts around that time.
Again, I apologize for having less time to post at the moment, but that will change in a couple weeks.
I am going to make a video soon teaching everyone my approach to charting. I will cover the entire workflow process I go through. I hope you enjoy it.
Tell me what you think?
This is not financial advice. DYODD.
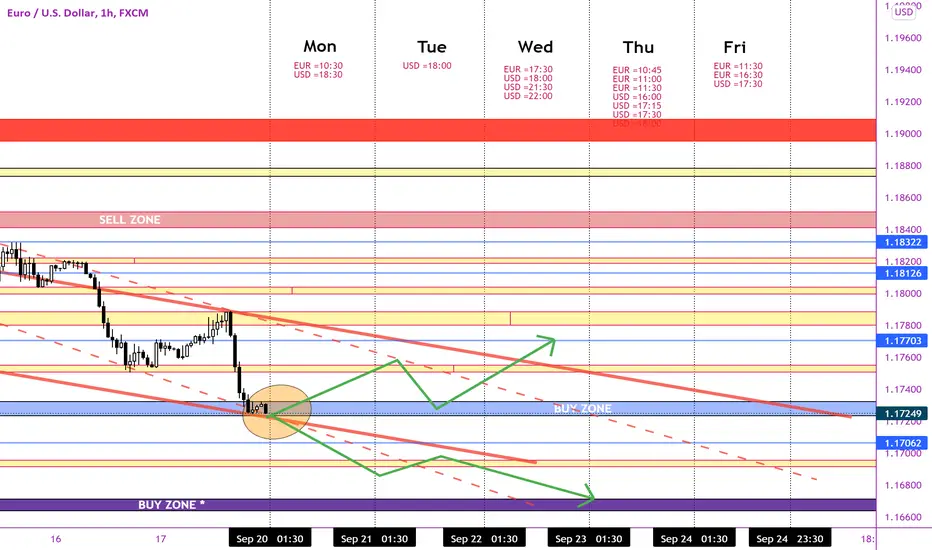
EURUSD chart forecastIn the name of God
Hi
The current price is in the range ( blue BUY ZONE ). Several modes can be considered:
1- The price should move upwards and towards ( SELL ZONE ) after a pullback. ----- LONG
2- The price should move upwards and then downwards after a pullback. Simply put, a volatile market.
3- The price should move downwards and towards ( purple BUY ZONE ) after a pullback. ----SHORT
Of course, given the economic data that is about to be released, and given the level of support that exists, it is very unlikely that the price will move below the purple ( BUY ZONE ) level.
In my opinion, the bullish market and the volatile market are the most likely.
Also, since the chart is in a downward trend, the floor and ceiling of this canal are a good place to enter.
This is my first analysis. I hope you help me become a professional with your good comments.
ETHO first Ichimoku data ETHO finally allows to use Ichimoku cloud on 1D Timeframe to analyse and extract some data from it. Even though it's raw data right now, it's still allows to find target and stop loss levels with data from EWO and MACD. Based on Ichimoku, ETHO will find itself at 0.014 soon. Levels below:
SL: 0.0815
Buy price: 0.1030-0.1070
TL: 0.1485

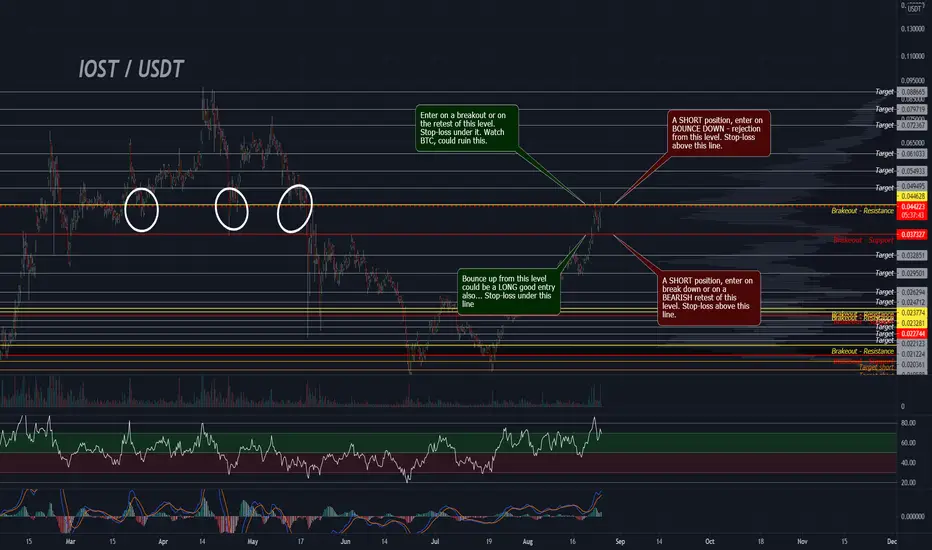
IOST time to breakout, or get rejected?IOST broke level that this year was big support multiple times. Now right on it. This could be a turning point, will we see rejection and correction, or bounce back up? Any case is interesting for trading... Long or short, never mind. Volume is good, RSI has more space up before oversold, MACD looks like it could go down. We will have to wait and see... Set your alarms, it could be profitable...
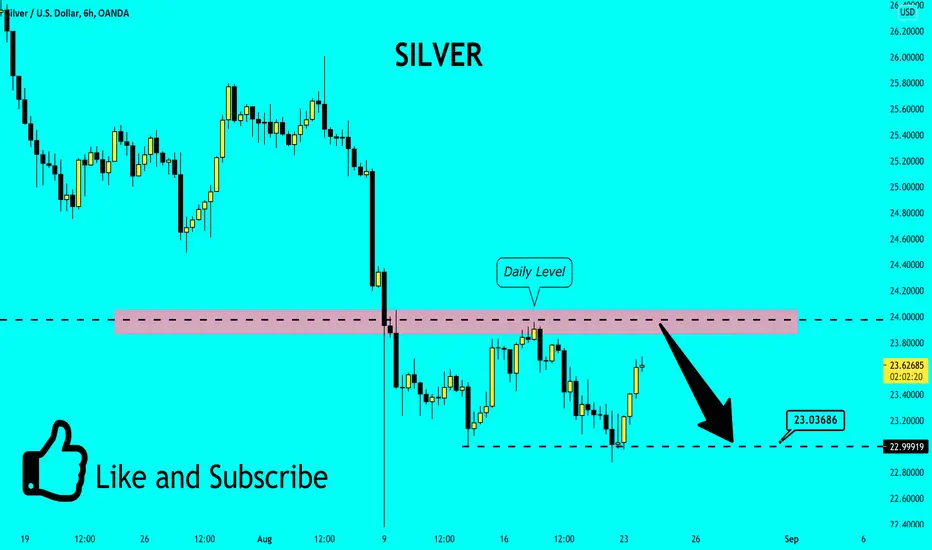
✅SILVER WILL GO DOWN|SHORT🔥
✅SILVER is moving up following Gold
On the Dollar index weakness
But the price is below a strong daily level
Therefore, we are waiting for the retest
And from there you can sell
SHORT🔥
✅Like and subscribe to never miss a new idea!✅
When to buy back into Cardano?Cardano has show great strengh in price since 20/21 july. Almost a gain of 148%! I didn't expect such a rise in price tough. Totally missed it cause i was more focused on other crypto's. It seems obvious that Cardano is working hard to strenthen there fundaments of their blockchain platform by making it more future proof.
I understand that a lot of people want to buy in Cardano right now. However i woudn't recommed it for the short term. After every rapid rise of price, their comes a downside. Also Bitcoin has gained these days and is reaching important support levels. I people want to buy Cardano wait for the price to go down and try to enter at a lower price.
In the chart i've highlighted three buy zones. The lower the buy-zone how bigger the chances of a big bounce to the upside will be. The first buy-zone is around $ 1.88. The second buy-zone is arond $1.6 because thats the support of the a previouw tradingrange which lasted almost 6 months... The third buy-zone is arond $ 1 - $ 1.12 which i think should be a no brainer for an entry.
So ... I expect soms downside momentum of Cardano as the price has gained so much already. So a short position would be smarter in my opinion. Also Bitcoin is leaning towards important resistence which could lead to downside momentum for altcoin also. The buyzones indicated in the chart could help by finding a new entry after a retrancement in price of Cardano.

XAUUSD 17/10/2021A bit of story on what i think of XAUUSD today ..
I am just learning. Opinions are more than welcome

The uptrend will remain stableBase on the supply and demand zones in the EURUSD in this week we can see the correction of this pair in first 2 days and then continuation of uptrend.
SLP time for long finally, or?SLP in a downtrend for quite some time, now forming a falling wedge. Is this it? Maybe not but watch it, you don't want to miss it...

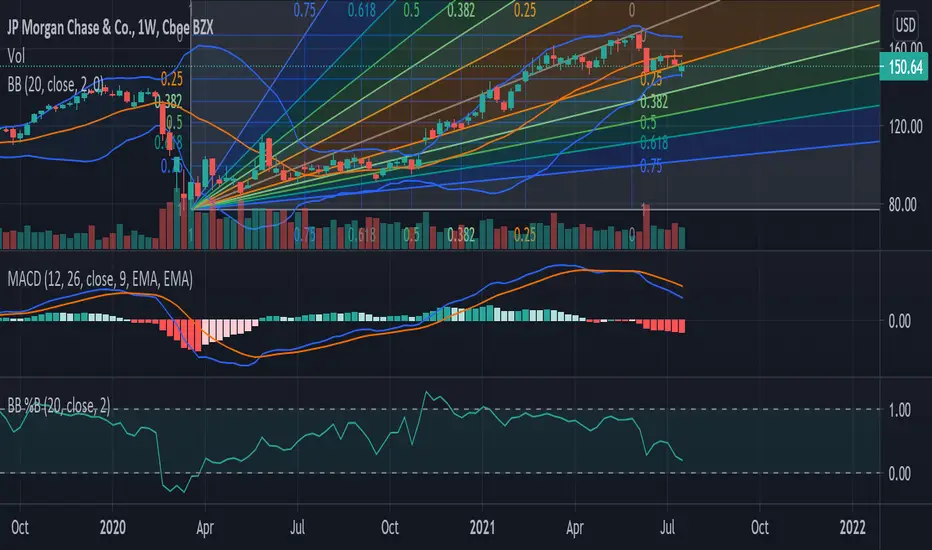
WATCH JP Morgan(critical Point)JPM is in a critical state as seen by it resting at its Fibonacci support. It can either break to the downside, allowing for a entry at 140 or it may reverse. In order to conclude the direction that this stock is going, watch the daily and weekly for a turnaround via the MACD. A reduction of bearish momentum within the weekly and bullish momentum within the daily suggest a reversal.
-Bullish Price Target 160
-Bearish Price Target 140
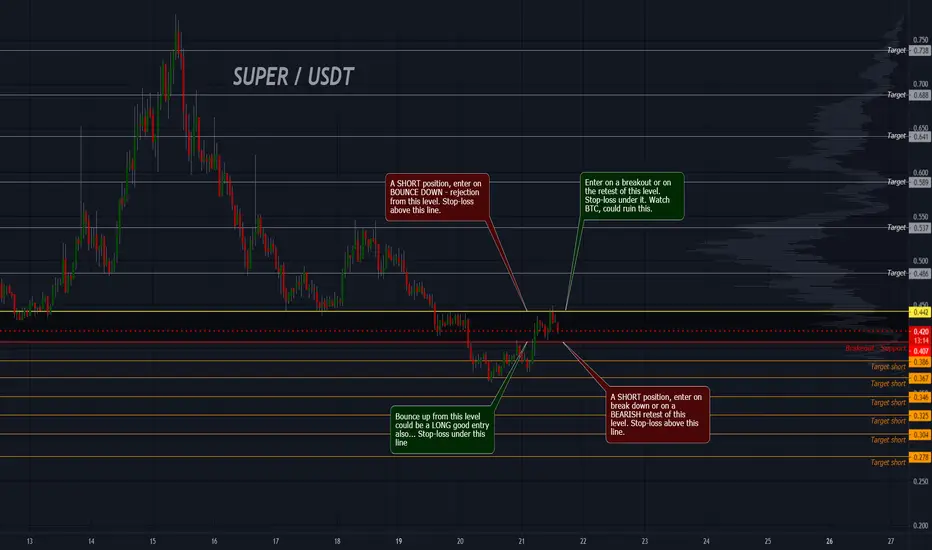
SUPER: Possible nice runnerSUPER looks like it could have a nice and fast run, I will be ready to catch this one...
AXS More to come?Is waited for correction nearing the end or just starting... we are now at a big support level, so there is the chance to bounce here, but if we break it, it should be the next big move down...

EUR/NZD - 4HR StructureStructure levels have been identified for EN. Bulls have been sitting at 1.6880 but will selling pressure continue and violate this support level? However, we could see a push to 1.70 once again! Have a great trading week guys!

CHF/JPY - Lovely Downside PotentialWe've seen a pullback, lower high formed and more downside over the last couple of days. We're riding price down, long term targets around 117.80
Technically wise, we have seen a break from ascending structure, overextended bullish cycle, hawkish JPY outlook, price retraced to test trendline and key level in the market.

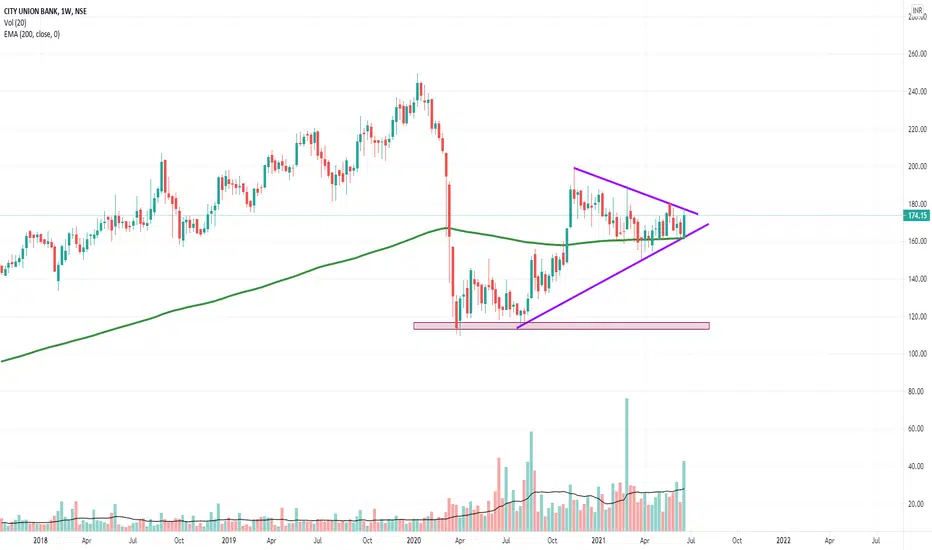
CITY UNION BANK NEAR BREAK OUTCUB is nearing a triangle break out. Volumes are also coming. Watch out for this level, it can give very good movement in the coming days.

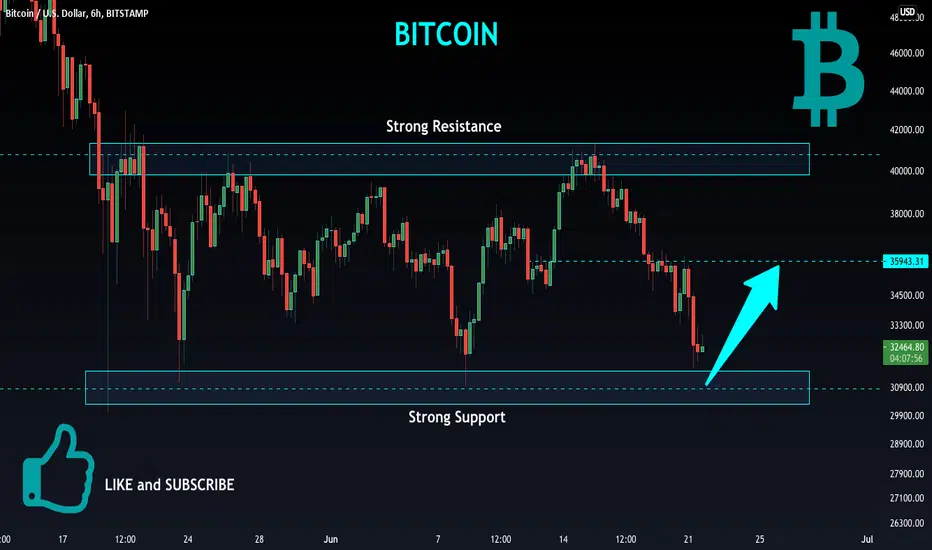
BITCOIN Will Go UP From Support! Buy!
Hello,Traders!
BITCOIN is trading between support and resistance
And it is now retesting the horizontal support
Thus,I am expecting a pullback from the level
And a bullish reaction with the target half way towards the resistance above
Buy!
Like, comment and subscribe to boost your trading!
See other ideas below too!
CHF/JPY - Rollercoaster Ride Last Week🎢We took advantage of the downside movement last week on this pair. Check out how 4HR levels have been violated. Another bearish week?
We have seen the JPY reverse last week after lockdown restrictions have eased for the majority of cities in Japan.
We are currently at a key long term level in price - a break of this level will mean further downside movement this week!