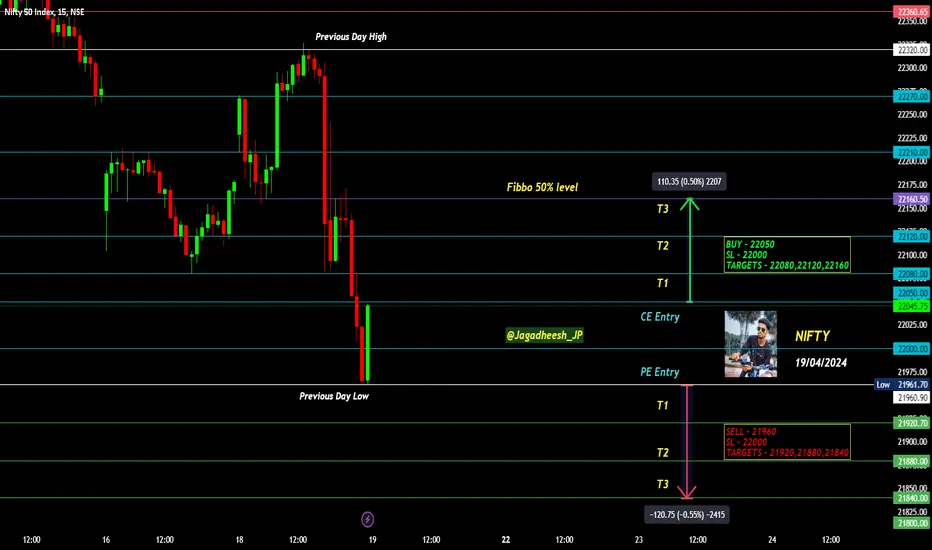
NIFTY INTRADAY LEVELS FOR 19/04/2024BUY ABOVE - 22050
SL - 22000
TARGETS - 22080,22120,22160
SELL BELOW - 21960
SL - 22000
TARGETS - 21920,21880,21840
NO TRADE ZONE - 21960 to 22050
Previous Day High - 22320
Previous Day Low - 21960
Based on price action major support & resistance's are here, the red lines acts as resistances, the green lines acts as supports. If the price breaks the support/resistance, it will move to the next support/resistance line. White lines indicates previous day high & low, high acts as a resistance & low acts as a support for next day.
Trendlines are also significant to price action. If the price is above/below the trendlines, can expect an UP/DOWN with aggressive move.
Please NOTE: this levels are for intraday trading only.
Disclaimer - All information on this page is for educational purposes only,
we are not SEBI Registered, Please consult a SEBI registered financial advisor for your financial matters before investing And taking any decision. We are not responsible for any profit/loss you made.
Request your support and engagement by liking and commenting & follow to provide encouragement
HAPPY TRADING 👍
Levels
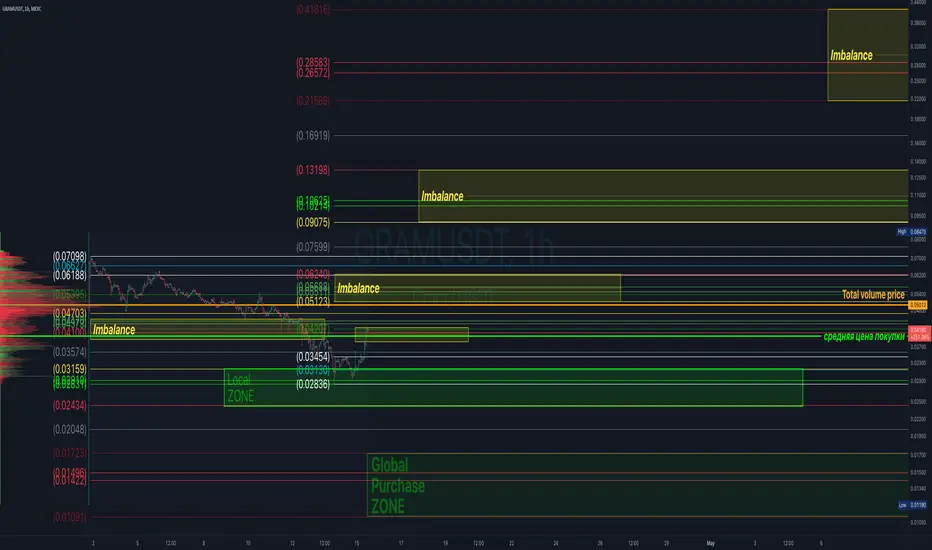
GRAM Global!!!And so the graph is a little bit clearer!
making adjustments!
The volume price has moved lower to 0.05.
A good local zone of 0.031-0.028 has appeared.
Buy level at 0.0291.
A global zone of 0.0172-0.0109 has appeared.
Buy level 0,0149
Growth imbalance
Zones 0.0512-0.0624
Level 0.055
Zone 0.0907-0.1319
Level 0.102
Zone 0.216-0.418
Level 0.265-0.285 (maybe I'll close some or all of it?)
Zone 1.77-6.58 Most likely to sell?
Support And Resistance Lines Are Not Real: Prove Me WrongIn this video, I draw random lines on the chart to prove a point. I think we need to ask ourselves the following questions to become better traders:
How will I define support and resistance consistently ?
How will I use support and resistance in my trading?
Do I need support and resistance in my trading?
Is support and resistance a reliable measure for markets?
Are the lines that I have been drawing for so long actually meaningful?

Lets Keep Things Simple!Let's keep everything simple. Here at the levels to trade in-between!
Calculate Your Risk/Reward so you don't lose more than 1% of your account per trade.
Every day the charts provide new information. You have to adjust or get REKT.
Love it or hate it, hit that thumbs up and share your thoughts below!
This is not financial advice. This is for educational purposes only.
NIFTY INTRADAY LEVELS FOR 18/03/2024BUY ABOVE - 22060
SL - 22010
TARGETS - 22120,22170,22210
SELL BELOW - 21980
SL - 22010
TARGETS - 21940,21900,21850
NO TRADE ZONE - 21980 to 22060
Previous Day High - 22120
Previous Day Low - 21940
Based on price action major support & resistance's are here, the red lines acts as resistances, the green lines acts as supports. If the price breaks the support/resistance, it will move to the next support/resistance line. White lines indicates previous day high & low, high acts as a resistance & low acts as a support for next day.
Trendlines are also significant to price action. If the price is above/below the trendlines, can expect an UP/DOWN with aggressive move.
Please NOTE: this levels are for intraday trading only.
Disclaimer - All information on this page is for educational purposes only,
we are not SEBI Registered, Please consult a SEBI registered financial advisor for your financial matters before investing And taking any decision. We are not responsible for any profit/loss you made.
Request your support and engagement by liking and commenting & follow to provide encouragement
HAPPY TRADING 👍

NIFTY INTRADAY LEVELS FOR 15/03/2024BUY ABOVE - 22170
SL - 22100
TARGETS - 22210,22270,22310
SELL BELOW - 22060
SL - 22100
TARGETS - 21980,21900,21850
NO TRADE ZONE - 22060 to 22170
Previous Day High - 22210
Previous Day Low - 21900
Based on price action major support & resistance's are here, the red lines acts as resistances, the green lines acts as supports. If the price breaks the support/resistance, it will move to the next support/resistance line. White lines indicates previous day high & low, high acts as a resistance & low acts as a support for next day.
Trendlines are also significant to price action. If the price is above/below the trendlines, can expect an UP/DOWN with aggressive move.
Please NOTE: this levels are for intraday trading only.
Disclaimer - All information on this page is for educational purposes only,
we are not SEBI Registered, Please consult a SEBI registered financial advisor for your financial matters before investing And taking any decision. We are not responsible for any profit/loss you made.
Request your support and engagement by liking and commenting & follow to provide encouragement
HAPPY TRADING 👍

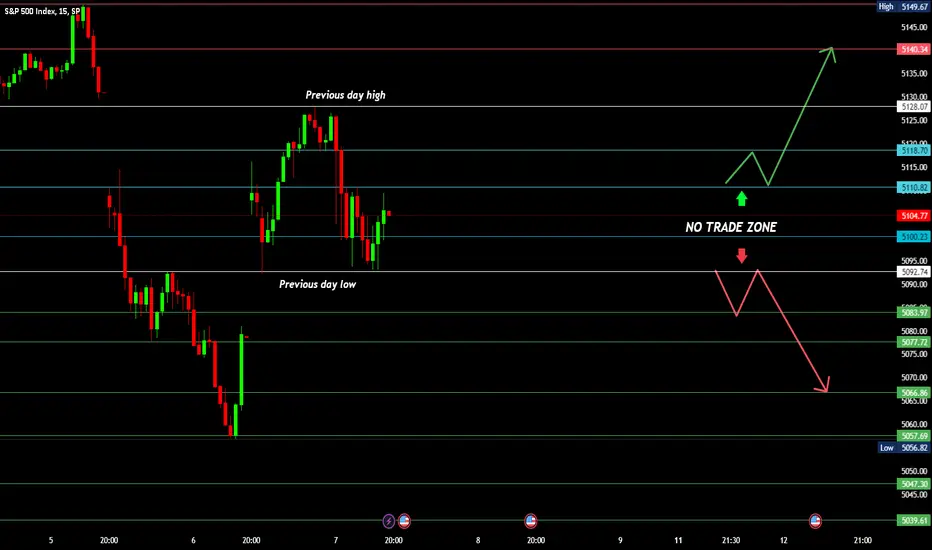
S&P 500 INTRADAY LEVELS FOR 15/03/2024BUY ABOVE - 5160
SL - 5150
TARGETS - 5170,5178,5188
SELL BELOW - 5140
SL - 5150
TARGETS - 5120,5109,5100
NO TRADE ZONE - 5140 to 5160
Previous Day High - 5178
Previous Day Low - 5122
Based on price action major support & resistance's are here, the red lines acts as resistances, the green lines acts as supports. If the price breaks the support/resistance, it will move to the next support/resistance line. White lines indicates previous day high & low, high acts as a resistance & low acts as a support for next day.
Trendlines are also significant to price action. If the price is above/below the trendlines, can expect an UP/DOWN with aggressive move.
Please NOTE: this levels are for intraday trading only.
Disclaimer - All information on this page is for educational purposes only,
we are not SEBI Registered, Please consult a SEBI registered financial advisor for your financial matters before investing And taking any decision. We are not responsible for any profit/loss you made.
Request your support and engagement by liking and commenting & follow to provide encouragement
HAPPY TRADING 👍

NIFTY INTRADAY LEVELS FOR 14/03/2024BUY - 47200
SL - 47050
TARGETS - 47500,47650,47800
SELL - 46870
SL - 47050
TARGETS - 46750,46560,46450
NO TRADE ZONE - 46870 to 47200
Previous Day High - 47500
Previous Day Low - 46870
Based on price action major support & resistance's are here, the red lines acts as resistances, the green lines acts as supports. If the price breaks the support/resistance, it will move to the next support/resistance line. White lines indicates previous day high & low, high acts as a resistance & low acts as a support for next day.
Trendlines are also significant to price action. If the price is above/below the trendlines, can expect an UP/DOWN with aggressive move.
Please NOTE: this levels are for intraday trading only.
Disclaimer - All information on this page is for educational purposes only,
we are not SEBI Registered, Please consult a SEBI registered financial advisor for your financial matters before investing And taking any decision. We are not responsible for any profit/loss you made.
Request your support and engagement by liking and commenting & follow to provide encouragement
HAPPY TRADING 👍

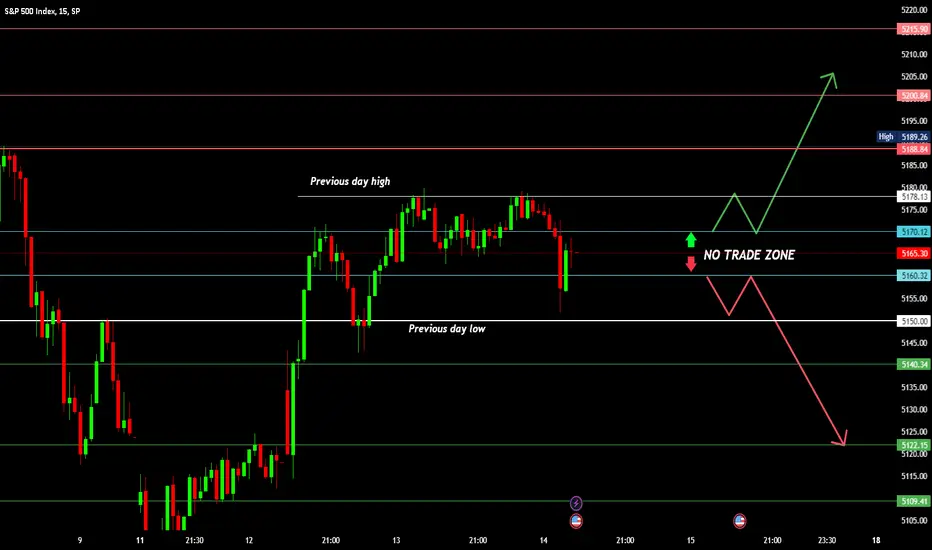
S&P 500 INTRADAY LEVELS FOR 14/03/2024BUY ABOVE - 5170
SL - 5160
TARGETS - 5178,5188,5200
SELL BELOW - 5160
SL - 5170
TARGETS - 5150,5140,5122
NO TRADE ZONE - 5150 to 5178
Previous Day High - 5178
Previous Day Low - 5150
Based on price action major support & resistance's are here, the red lines acts as resistances, the green lines acts as supports. If the price breaks the support/resistance, it will move to the next support/resistance line. White lines indicates previous day high & low, high acts as a resistance & low acts as a support for next day.
Trendlines are also significant to price action. If the price is above/below the trendlines, can expect an UP/DOWN with aggressive move.
Please NOTE: this levels are for intraday trading only.
Disclaimer - All information on this page is for educational purposes only,
we are not SEBI Registered, Please consult a SEBI registered financial advisor for your financial matters before investing And taking any decision. We are not responsible for any profit/loss you made.
Request your support and engagement by liking and commenting & follow to provide encouragement
HAPPY TRADING 👍
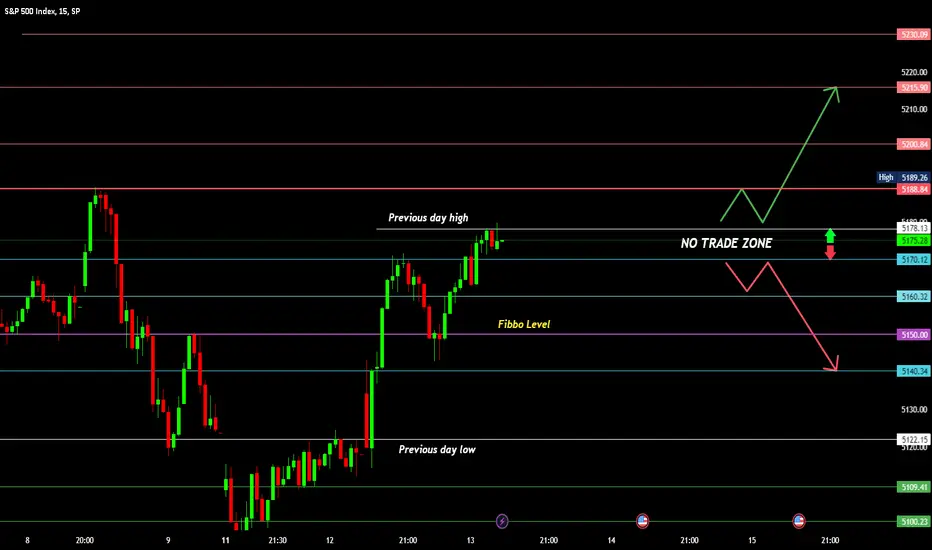
S&P 500 INTRADAY LEVELS FOR 13/03/2024BUY ABOVE - 5178
SL - 5170
TARGETS - 5188,5200,5215
SELL BELOW - 5170
SL - 5178
TARGETS - 5160,5150,5140
NO TRADE ZONE - 5170 to 5178
Previous Day High - 5178
Previous Day Low - 5122
Based on price action major support & resistance's are here, the red lines acts as resistances, the green lines acts as supports. If the price breaks the support/resistance, it will move to the next support/resistance line. White lines indicates previous day high & low, high acts as a resistance & low acts as a support for next day.
Trendlines are also significant to price action. If the price is above/below the trendlines, can expect an UP/DOWN with aggressive move.
Please NOTE: this levels are for intraday trading only.
Disclaimer - All information on this page is for educational purposes only,
we are not SEBI Registered, Please consult a SEBI registered financial advisor for your financial matters before investing And taking any decision. We are not responsible for any profit/loss you made.
Request your support and engagement by liking and commenting & follow to provide encouragement
HAPPY TRADING 👍
NIFTY INTRADAY LEVELS FOR 13/03/2024BUY ABOVE - 22390
SL - 22350
TARGETS - 22440,22520,22580
SELL BELOW - 22310
SL - 22350
TARGETS - 22270,22230,22170
NO TRADE ZONE - 22310 to 22390
Previous Day High - 22440
Previous Day Low - 22270
Based on price action major support & resistance's are here, the red lines acts as resistances, the green lines acts as supports. If the price breaks the support/resistance, it will move to the next support/resistance line. White lines indicates previous day high & low, high acts as a resistance & low acts as a support for next day.
Trendlines are also significant to price action. If the price is above/below the trendlines, can expect an UP/DOWN with aggressive move.
Please NOTE: this levels are for intraday trading only.
Disclaimer - All information on this page is for educational purposes only,
we are not SEBI Registered, Please consult a SEBI registered financial advisor for your financial matters before investing And taking any decision. We are not responsible for any profit/loss you made.
Request your support and engagement by liking and commenting & follow to provide encouragement
HAPPY TRADING 👍

BANK NIFTY INTRADAY LEVELS FOR 13/03/2024BUY ABOVE - 47400
SL - 47230
TARGETS - 47500,47650,47750
SELL BELOW - 47230
SL - 47400
TARGETS - 47080,46900,46750
NO TRADE ZONE - 47210 to 47400
Previous Day High - 47800
Previous Day Low - 46900
Based on price action major support & resistance's are here, the red lines acts as resistances, the green lines acts as supports. If the price breaks the support/resistance, it will move to the next support/resistance line. White lines indicates previous day high & low, high acts as a resistance & low acts as a support for next day.
Trendlines are also significant to price action. If the price is above/below the trendlines, can expect an UP/DOWN with aggressive move.
Please NOTE: this levels are for intraday trading only.
Disclaimer - All information on this page is for educational purposes only,
we are not SEBI Registered, Please consult a SEBI registered financial advisor for your financial matters before investing And taking any decision. We are not responsible for any profit/loss you made.
Request your support and engagement by liking and commenting & follow to provide encouragement
HAPPY TRADING 👍

NIFTY INYTRADAY LEVELS FOR 12/03/2024BUY ABOVE - 22430
SL - 22380
TARGETS - 22470,22520,22580
SELL BELOW - 22350
SL - 22380
TARGETS - 22310,22270,22230
NO TRADE ZONE - 22310 to 22380
Previous Day High - 22520
Previous Day Low - 22310
Based on price action major support & resistance's are here, the red lines acts as resistances, the green lines acts as supports. If the price breaks the support/resistance, it will move to the next support/resistance line. White lines indicates previous day high & low, high acts as a resistance & low acts as a support for next day.
Trendlines are also significant to price action. If the price is above/below the trendlines, can expect an UP/DOWN with aggressive move.
Please NOTE: this levels are for intraday trading only.
Disclaimer - All information on this page is for educational purposes only,
we are not SEBI Registered, Please consult a SEBI registered financial advisor for your financial matters before investing And taking any decision. We are not responsible for any profit/loss you made.
Request your support and engagement by liking and commenting & follow to provide encouragement
HAPPY TRADING 👍

BANK NIFTY INTRADAY LEVELS FOR 12/03/2024BUY ABOVE - 47400
SL - 47230
TARGETS - 47500,47650,47750
SELL BELOW - 47230
SL - 47400
TARGETS - 47080,46900,46750
NO TRADE ZONE - 47230 to 47400
Previous Day High - 47880
Previous Day Low - 47230
Based on price action major support & resistance's are here, the red lines acts as resistances, the green lines acts as supports. If the price breaks the support/resistance, it will move to the next support/resistance line. White lines indicates previous day high & low, high acts as a resistance & low acts as a support for next day.
Trendlines are also significant to price action. If the price is above/below the trendlines, can expect an UP/DOWN with aggressive move.
Please NOTE: this levels are for intraday trading only.
Disclaimer - All information on this page is for educational purposes only,
we are not SEBI Registered, Please consult a SEBI registered financial advisor for your financial matters before investing And taking any decision. We are not responsible for any profit/loss you made.
Request your support and engagement by liking and commenting & follow to provide encouragement
HAPPY TRADING 👍

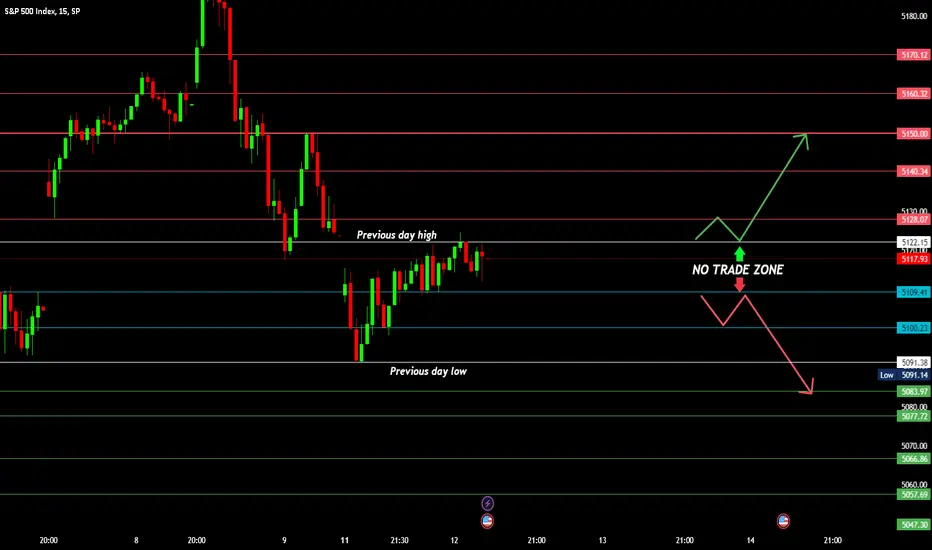
S&P 500 INTRADAY LEVELS FOR 12/03/2024BUY ABOVE - 5122
SL - 5109
TARGETS - 5128,5140,5150
SELL BELOW - 5109
SL - 5122
TARGETS - 5100,5091,5083
NO TRADE ZONE - 5109 to 5122
Previous Day High - 5122
Previous Day Low - 5091
Based on price action major support & resistance's are here, the red lines acts as resistances, the green lines acts as supports. If the price breaks the support/resistance, it will move to the next support/resistance line. White lines indicates previous day high & low, high acts as a resistance & low acts as a support for next day.
Trendlines are also significant to price action. If the price is above/below the trendlines, can expect an UP/DOWN with aggressive move.
Please NOTE: this levels are for intraday trading only.
Disclaimer - All information on this page is for educational purposes only,
we are not SEBI Registered, Please consult a SEBI registered financial advisor for your financial matters before investing And taking any decision. We are not responsible for any profit/loss you made.
Request your support and engagement by liking and commenting & follow to provide encouragement
HAPPY TRADING 👍
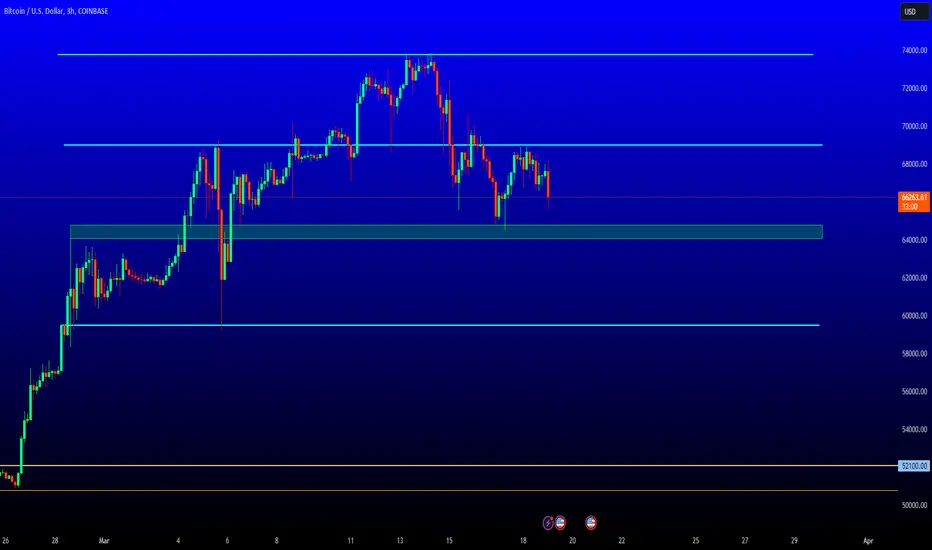
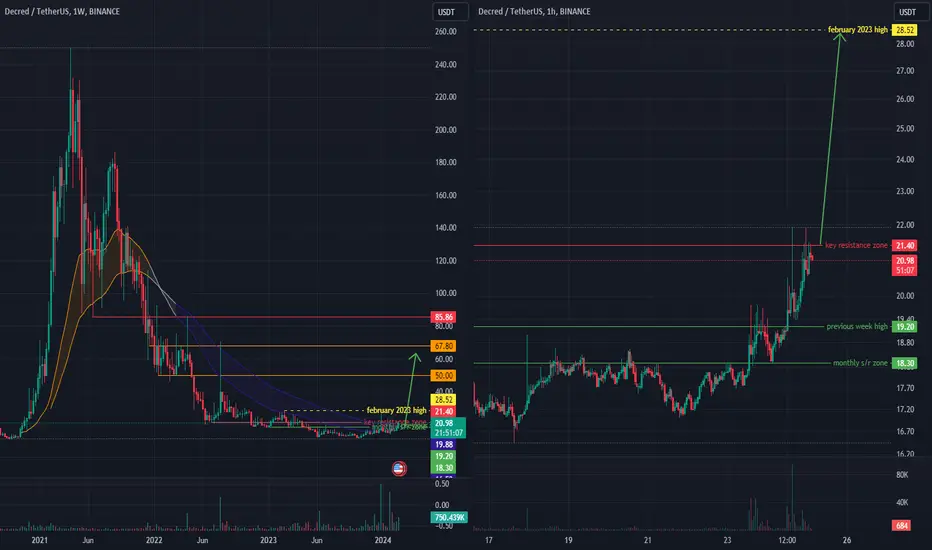
Decred: Bullish Breakout Imminent?Considering the prevailing bullish sentiment in the market and the pattern observed on other cryptocurrencies throughout the crypto sphere that have broken out of a prolonged accumulation phase, it can be expected that DCR will eventually follow the general trend and repeat the pattern that we have already seen on many other coins.
Decred has been facing resistance at the $18.3 level since May 2023, but recent price action on the 1-hour and 4-hour timeframes indicates a breakout and retest above this level.
The next significant level to watch is $21.4, which has historically been a key support/resistance level for Decred. While there are signs of weakness on the 1-hour timeframe, such as candles with long shadows that could provoke short positions, there is still no confirmation of a breakdown in the upward structure. The 1-week candle seems strong, and the overall asset shows significant buying volume. This indicates that Decred may be able to consolidate above $21.4 and keep moving upwards successfully.
A breakout and consolidation above $21.4 could lead to increased volatility and larger price swings on higher timeframes, with potential profit-taking zones and resistance levels at $50, $67, and $85. Additionally, the February 2023 high of $28.52 may also present a next strong resistance level in the short-term future.
BANK NIFTY INTRADAY LEVELS FOR 11/03/2024BUY ABOVE - 47980
SL - 47880
TARGETS - 48070,48160,48310
SELL BELOW - 47750
SL - 47880
TARGETS - 47650,47500,47360
NO TRADE ZONE - 47750 to 47980
Previous Day High - 48070
Previous Day Low - 47750
Based on price action major support & resistance's are here, the red lines acts as resistances, the green lines acts as supports. If the price breaks the support/resistance, it will move to the next support/resistance line. White lines indicates previous day high & low, high acts as a resistance & low acts as a support for next day.
Trendlines are also significant to price action. If the price is above/below the trendlines, can expect an UP/DOWN with aggressive move.
Please NOTE: this levels are for intraday trading only.
Disclaimer - All information on this page is for educational purposes only,
we are not SEBI Registered, Please consult a SEBI registered financial advisor for your financial matters before investing And taking any decision. We are not responsible for any profit/loss you made.
Request your support and engagement by liking and commenting & follow to provide encouragement
HAPPY TRADING 👍

NIFTY INTRADAY LEVELS FOR 11/03/2024BUY ABOVE - 22520
SL - 22500
TARGETS - 22580,22650,22700
SELL BELOW - 22470
SL - 22500
TARGETS - 22430,22380,22350
NO TRADE ZONE - 22470 to 22520
Previous Day High - 22520
Previous Day Low - 22430
Based on price action major support & resistance's are here, the red lines acts as resistances, the green lines acts as supports. If the price breaks the support/resistance, it will move to the next support/resistance line. White lines indicates previous day high & low, high acts as a resistance & low acts as a support for next day.
Trendlines are also significant to price action. If the price is above/below the trendlines, can expect an UP/DOWN with aggressive move.
Please NOTE: this levels are for intraday trading only.
Disclaimer - All information on this page is for educational purposes only,
we are not SEBI Registered, Please consult a SEBI registered financial advisor for your financial matters before investing And taking any decision. We are not responsible for any profit/loss you made.
Request your support and engagement by liking and commenting & follow to provide encouragement
HAPPY TRADING 👍

S&P 500 INTRADAY LEVELS FOR 11/03/2024BUY ABOVE - 5128
SL - 5118
TARGETS - 5140,5150,5160
SELL BELOW - 5118
SL - 5128
TARGETS - 5110,5100,5092
NO TRADE ZONE - 5092 to 5110
Previous Day High - 5188
Previous Day Low - 5118
Based on price action major support & resistance's are here, the red lines acts as resistances, the green lines acts as supports. If the price breaks the support/resistance, it will move to the next support/resistance line. White lines indicates previous day high & low, high acts as a resistance & low acts as a support for next day.
Trendlines are also significant to price action. If the price is above/below the trendlines, can expect an UP/DOWN with aggressive move.
Please NOTE: this levels are for intraday trading only.
Disclaimer - All information on this page is for educational purposes only,
we are not SEBI Registered, Please consult a SEBI registered financial advisor for your financial matters before investing And taking any decision. We are not responsible for any profit/loss you made.
Request your support and engagement by liking and commenting & follow to provide encouragement
HAPPY TRADING 👍

BITCOIN CATS BUILDING LEVELS1catusdt seems to build a new trend level that could get a new confirmation for a break.
at this moment the coin seems interesting for the trend.
This is a daily trend, Mange always the risks with coins that have high rank levels.
There is no guarantee in the markets.

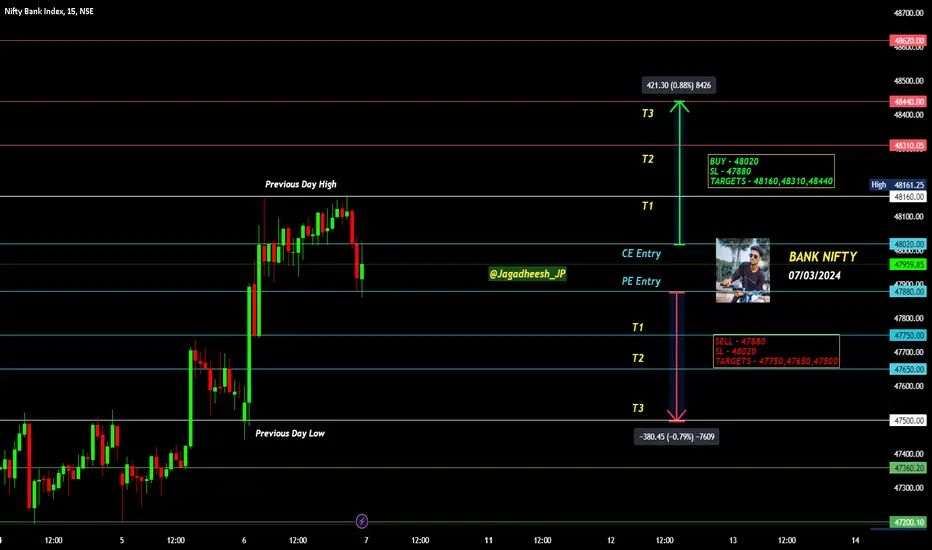
BANK NIFTY INTRADAY LEVELS FOR 07/03/2024BUY ABOVE - 48020
SL - 47880
TARGETS - 48160,48310,48440
SELL BELOW - 47880
SL - 48020
TARGETS - 47750,47650,47500
NO TRADE ZONE - 47880 to 48020
Previous Day High - 48160
Previous Day Low - 47500
Based on price action major support & resistance's are here, the red lines acts as resistances, the green lines acts as supports. If the price breaks the support/resistance, it will move to the next support/resistance line. White lines indicates previous day high & low, high acts as a resistance & low acts as a support for next day.
Trendlines are also significant to price action. If the price is above/below the trendlines, can expect an UP/DOWN with aggressive move.
Please NOTE: this levels are for intraday trading only.
Disclaimer - All information on this page is for educational purposes only,
we are not SEBI Registered, Please consult a SEBI registered financial advisor for your financial matters before investing And taking any decision. We are not responsible for any profit/loss you made.
Request your support and engagement by liking and commenting & follow to provide encouragement
HAPPY TRADING 👍
NIFTY INTRADAY LEVELS FOR 07/03/2024BUY ABOVE - 22500
SL - 22430
TARGETS - 22580,22650,22700
SELL BELOW - 22430
SL - 22500
TARGETS - 22380,22350,22310
NO TRADE ZONE - 22430 to 22500
Previous Day High - 22500
Previous Day Low - 22230
Based on price action major support & resistance's are here, the red lines acts as resistances, the green lines acts as supports. If the price breaks the support/resistance, it will move to the next support/resistance line. White lines indicates previous day high & low, high acts as a resistance & low acts as a support for next day.
Trendlines are also significant to price action. If the price is above/below the trendlines, can expect an UP/DOWN with aggressive move.
Please NOTE: this levels are for intraday trading only.
Disclaimer - All information on this page is for educational purposes only,
we are not SEBI Registered, Please consult a SEBI registered financial advisor for your financial matters before investing And taking any decision. We are not responsible for any profit/loss you made.
Request your support and engagement by liking and commenting & follow to provide encouragement
HAPPY TRADING 👍

S&P 500 INTRADAY LEVELS FOR 07/03/2024BUY ABOVE - 5110
SL - 5100
TARGETS - 5118,5128,5140
SELL BELOW - 5092
SL - 5100
TARGETS - 5083,5077,5066
NO TRADE ZONE - 5092 to 5110
Previous Day High - 5128
Previous Day Low - 5092
Based on price action major support & resistance's are here, the red lines acts as resistances, the green lines acts as supports. If the price breaks the support/resistance, it will move to the next support/resistance line. White lines indicates previous day high & low, high acts as a resistance & low acts as a support for next day.
Trendlines are also significant to price action. If the price is above/below the trendlines, can expect an UP/DOWN with aggressive move.
Please NOTE: this levels are for intraday trading only.
Disclaimer - All information on this page is for educational purposes only,
we are not SEBI Registered, Please consult a SEBI registered financial advisor for your financial matters before investing And taking any decision. We are not responsible for any profit/loss you made.
Request your support and engagement by liking and commenting & follow to provide encouragement
HAPPY TRADING 👍