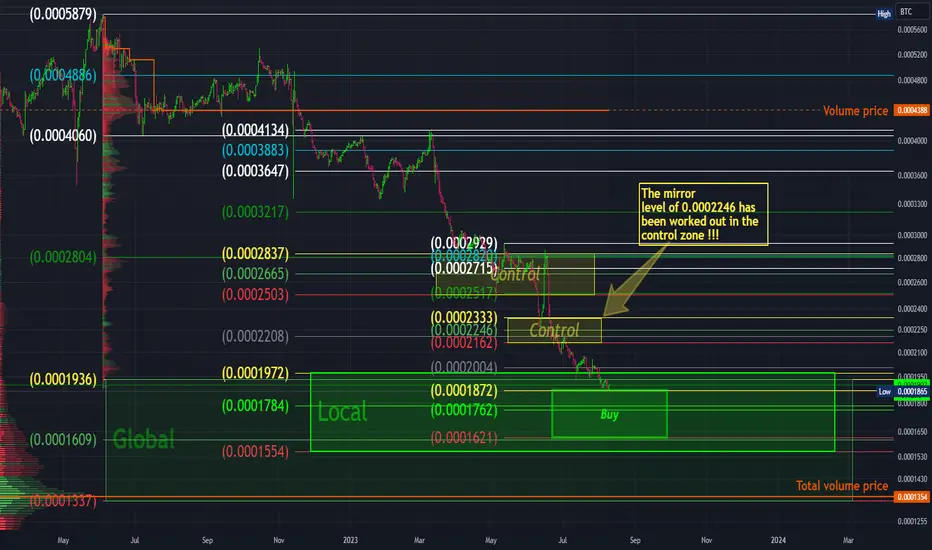
KCSBTC Buy !!!Sweet Shopping zone 0.0001872-0.0001621
Purchase level 0.0001762
You can buy all three levels with a ladder !!!
A small lesson on the price of volume, zone and level of control !!!
The price of the total volume is 0.0001354
Suppose:
At this price, the average purchase of the exchange itself turned out!
The volume price of 0.0004388 is the average selling price.
The difference is the profit of the exchange itself on its own token !!!
What happens at the levels in the zones?
In the control zone, the mirror level of 0.0002246 worked out !!!
Thank you all!
Have a good trade!
Levels
BANK NIFY INTRADAY LEVELS FOR 09/08/2023BUY ABOVE - 45100
SL - 44930
TARGETS - 45270,45470,45630
SELL BELOW - 44900
SL - 45010
TARGETS - 44770,44550,44280
Previous Day High - 45100
Previous Day Low - 44818
I am sharing BANK NIFTY levels this levels acts as important support & resistance for intraday. if you want to trade with this levels wait for 15 min Candle closing above that levels. You can trade with breakout and reversal both.
In this channel, I share my expertise in trading strategies, technical analysis, and market trends to help you make informed decisions in your trading ventures.
Stay tuned for daily updates, in-depth market analyses, and real-time trading scenarios to witness firsthand how we transform from Zero to Hero in the trading world. My Only aim is to empower you with the knowledge and skills necessary to navigate the complexities of the financial markets successfully.
Based on price action major support & resistance's are here, the red lines acts as resistances, the green lines acts as supports. If the price breaks the support/resistance, it will move to the next support/resistance line. White lines indicates previous day high & low, high acts as a resistance & low acts as a support for next day.
Trendlines are also significant to price action. If the price is above/below the trendlines, can expect an UP/DOWN with aggressive move.
Please NOTE: this levels are for intraday trading only.
Disclaimer - All information on this page is for educational purposes only,
we are not SEBI Registered, Please consult a SEBI registered financial advisor for your financial matters before investing And taking any decision. We are not responsible for any profit/loss you made.
Request your support and engagement by liking and commenting & follow to provide encouragement
HAPPY TRADING 👍

BTC/USD: Cycles Levels and Trends until 2030📈 BTC Projection Until 2030: A Historical Data Approach
Delving deep into Bitcoin's past can often illuminate its future. In this analysis, we're extrapolating BTC's potential trajectory up to the year 2030 based on several pivotal data points from its historical cycles:
Bitcoin Rainbow Chart V2: A visual representation of Bitcoin's price spectrum, this chart serves as a guide to potential target levels. Its color-coded valuation bands give a snapshot of where Bitcoin stands in its market phase. "Bitcoin Rainbow Chart V2" offers a holistic view of how BTC has been priced over various market phases.
1428-Day Cycle: A peculiar consistency in Bitcoin's behavior is the ~1428-day cycling period observed between its All-Time Highs (ATHs) and between its bottoms. This cyclical nature suggests periods of highs and lows in almost regular intervals.
Bear & Bull Market Indicators: Using two main indicators, we will outline the potential Bear & Bull market levels and trends, providing a clearer vision of Bitcoin's price movements and market status up to 2030.
Together, these data points paint a comprehensive roadmap of Bitcoin's potential journey over the next decade. Join us in this deep-dive analysis, whether you're an experienced trader or new to the crypto space.
Thierry Beaucamp
Welthee / Agileeo

NIFTY INTRADAY LEVELS FOR 09/08/2023BUY ABOVE - 19620
SL - 19580
TARGETS - 19680,19730,19765
SELL BELOW - 19530
SL - 19560
TARGETS - 19500,19430,19350
Previous Day High - 19634
Previous Day Low - 19530
Watch that major trend line... after breakout that trend line only we can expect buying chance in the market
I am sharing NIFTY levels this levels acts as important support & resistance for intraday. if you want to trade with this levels wait for 15 min Candle closing above that levels. You can trade with breakout and reversal both.
In this channel, I share my expertise in trading strategies, technical analysis, and market trends to help you make informed decisions in your trading ventures.
Stay tuned for daily updates, in-depth market analyses, and real-time trading scenarios to witness firsthand how we transform from Zero to Hero in the trading world. My Only aim is to empower you with the knowledge and skills necessary to navigate the complexities of the financial markets successfully.
Based on price action major support & resistance's are here, the red lines acts as resistances, the green lines acts as supports. If the price breaks the support/resistance, it will move to the next support/resistance line. White lines indicates previous day high & low, high acts as a resistance & low acts as a support for next day.
Please NOTE: this levels are for intraday trading only.
Disclaimer - All information on this page is for educational purposes only,
we are not SEBI Registered, Please consult a SEBI registered financial advisor for your financial matters before investing And taking any decision. We are not responsible for any profit/loss you made.
Request your support and engagement by liking and commenting & follow to provide encouragement
HAPPY TRADING 👍

BANK NIFTY INTRADAY LEVELS FOR 08/08/2023BUY ABOVE - 45000
SL - 44880
TARGETS - 45130,45270,45470
SELL BELOW - 44770
SL - 44910
TARGETS - 44550,44280,44070
Previous Day High - 45000
Previous Day Low - 44770
I am sharing BANK NIFTY levels this levels acts as important support & resistance for intraday. if you want to trade with this levels wait for 15 min Candle closing above that levels. You can trade with breakout and reversal both.
Based on price action major support & resistance's are here, the red lines acts as resistances, the green lines acts as supports. If the price breaks the support/resistance, it will move to the next support/resistance line. White lines indicates previous day high & low, high acts as a resistance & low acts as a support for next day.
Trendlines are also significant to price action. If the price is above/below the trendlines, can expect an UP/DOWN with aggressive move.
Please NOTE: this levels are for intraday trading only.
Disclaimer - All information on this page is for educational purposes only,
we are not SEBI Registered, Please consult a SEBI registered financial advisor for your financial matters before investing And taking any decision. We are not responsible for any profit/loss you made.
Request your support and engagement by liking and commenting & follow to provide encouragement
HAPPY TRADING 👍

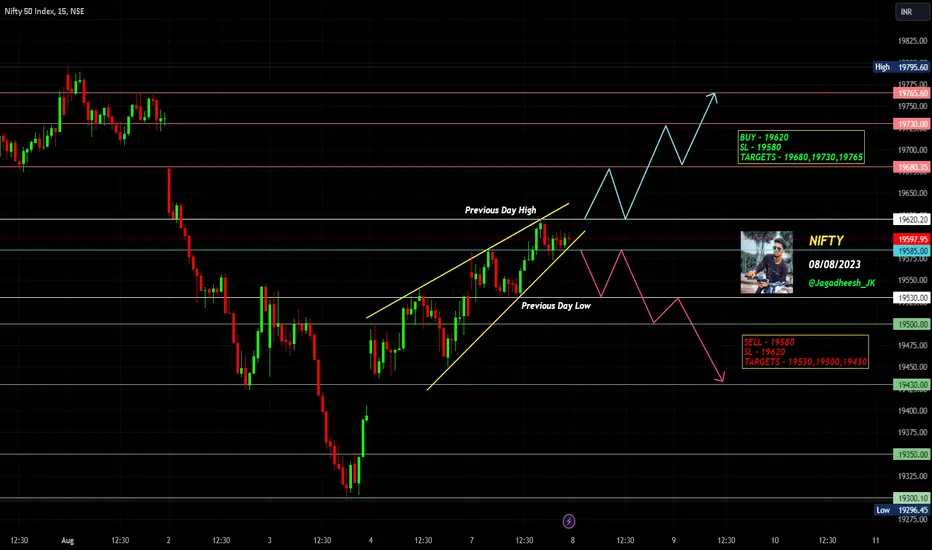
NIFTY INTRADAY LEVELS FOR 08/08/2023BUY ABOVE - 19620
SL - 19580
TARGETS - 19680,19730,19765
SELL BELOW - 19580
SL - 19620
TARGETS - 19530,19500,19430
Previous Day High - 19620
Previous Day Low - 19530
I am sharing NIFTY levels this levels acts as important support & resistance for intraday. if you want to trade with this levels wait for 15 min Candle closing above that levels. You can trade with breakout and reversal both.
Based on price action major support & resistance's are here, the red lines acts as resistances, the green lines acts as supports. If the price breaks the support/resistance, it will move to the next support/resistance line. White lines indicates previous day high & low, high acts as a resistance & low acts as a support for next day.
Please NOTE: this levels are for intraday trading only.
Disclaimer - All information on this page is for educational purposes only,
we are not SEBI Registered, Please consult a SEBI registered financial advisor for your financial matters before investing And taking any decision. We are not responsible for any profit/loss you made.
Request your support and engagement by liking and commenting & follow to provide encouragement
HAPPY TRADING 👍
NIFTY INTRADAY LEVELS FOR 07/08/2023INVERSE HEAD & SHOULDER PATTERN
BUY ABOVE - 19540
SL - 19500
TARGETS - 19610,19640,19680
SELL BELOW - 19500
SL - 19540
TARGETS - 19430,19350,19300
NOTE: I'm not available on Monday. Please not this levels & trade safely with this levels only Okay
Previous Day High - 19540
Previous Day Low - 19430
I am sharing NIFTY levels this levels acts as important support & resistance for intraday. if you want to trade with this levels wait for 15 min Candle closing above that levels. You can trade with breakout and reversal both.
Based on price action major support & resistance's are here, the red lines acts as resistances, the green lines acts as supports. If the price breaks the support/resistance, it will move to the next support/resistance line. White lines indicates previous day high & low, high acts as a resistance & low acts as a support for next day.
Please NOTE: this levels are for intraday trading only.
Disclaimer - All information on this page is for educational purposes only,
we are not SEBI Registered, Please consult a SEBI registered financial advisor for your financial matters before investing And taking any decision. We are not responsible for any profit/loss you made.
Request your support and engagement by liking and commenting & follow to provide encouragement
HAPPY TRADING 👍

BANK NIFTY INTRADAY LEVELS FOR 07/08/2023INVERSE HEAD & SHOULDER PATTERN
BUY ABOVE - 44550
SL - 44430
TARGETS - 44730,44980,45130
SELL BELOW - 44280
SL - 44420
TARGETS - 44070,43830,43570
Previous Day High - 45040
Previous Day Low - 44280
NOTE: I'm not available on Monday. Please not this levels & trade safely with this levels only Okay
I am sharing BANK NIFTY levels this levels acts as important support & resistance for intraday. if you want to trade with this levels wait for 15 min Candle closing above that levels. You can trade with breakout and reversal both.
Based on price action major support & resistance's are here, the red lines acts as resistances, the green lines acts as supports. If the price breaks the support/resistance, it will move to the next support/resistance line. White lines indicates previous day high & low, high acts as a resistance & low acts as a support for next day.
Trendlines are also significant to price action. If the price is above/below the trendlines, can expect an UP/DOWN with aggressive move.
Please NOTE: this levels are for intraday trading only.
Disclaimer - All information on this page is for educational purposes only,
we are not SEBI Registered, Please consult a SEBI registered financial advisor for your financial matters before investing And taking any decision. We are not responsible for any profit/loss you made.
Request your support and engagement by liking and commenting & follow to provide encouragement
HAPPY TRADING 👍

BANK NIFTY INTRADAY LEVELS FOR 04/08/2023BUY ABOVE - 44550
SL - 44430
TARGETS - 44730,44980,45130
SELL BELOW - 44280
SL - 44420
TARGETS - 44070,43830,43570
Previous Day High - 45040
Previous Day Low - 44280
I am sharing BANK NIFTY levels this levels acts as important support & resistance for intraday. if you want to trade with this levels wait for 15 min Candle closing above that levels. You can trade with breakout and reversal both.
Based on price action major support & resistance's are here, the red lines acts as resistances, the green lines acts as supports. If the price breaks the support/resistance, it will move to the next support/resistance line. White lines indicates previous day high & low, high acts as a resistance & low acts as a support for next day.
Trendlines are also significant to price action. If the price is above/below the trendlines, can expect an UP/DOWN with aggressive move.
Please NOTE: this levels are for intraday trading only.
Disclaimer - All information on this page is for educational purposes only,
we are not SEBI Registered, Please consult a SEBI registered financial advisor for your financial matters before investing And taking any decision. We are not responsible for any profit/loss you made.
Request your support and engagement by liking and commenting & follow to provide encouragement
HAPPY TRADING 👍

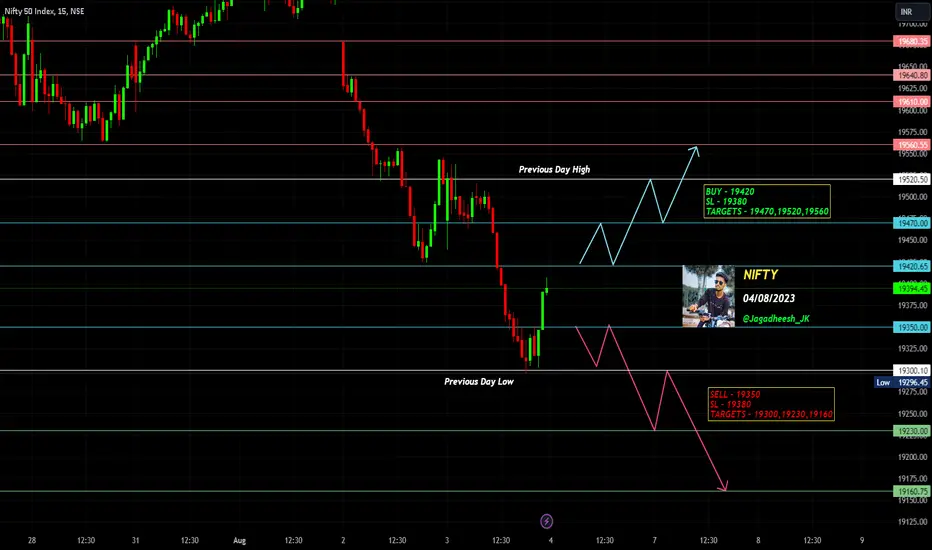
NIFTY INTRADAY LEVELS FOR 04/08/2023BUY ABOVE - 19420
SL - 19380
TARGETS - 19470,19520,19560
SELL BELOW - 19350
SL - 19380
TARGETS - 19300,19230,19160
Previous Day High - 19537
Previous Day Low - 19296
I am sharing NIFTY levels this levels acts as important support & resistance for intraday. if you want to trade with this levels wait for 15 min Candle closing above that levels. You can trade with breakout and reversal both.
Based on price action major support & resistance's are here, the red lines acts as resistances, the green lines acts as supports. If the price breaks the support/resistance, it will move to the next support/resistance line. White lines indicates previous day high & low, high acts as a resistance & low acts as a support for next day.
Please NOTE: this levels are for intraday trading only.
Disclaimer - All information on this page is for educational purposes only,
we are not SEBI Registered, Please consult a SEBI registered financial advisor for your financial matters before investing And taking any decision. We are not responsible for any profit/loss you made.
Request your support and engagement by liking and commenting & follow to provide encouragement
HAPPY TRADING 👍
Bitcoin with a Breakout/ReTest Remains BullishTraders,
Two posts ago, I showed this bullish triangle. I expected one more drop down inside the triangle and I stated the price support would range between 28,300 and 28,800. We got our drop and we got our support. I remained bullish.
One post ago, I anticipated a breakout to the upside due to patterns remaining bullish. We got our breakout to the upside.
But now where are we at? Well, IMO and according to the charts, we are still positioned biased to the upside. Due to the credit rating downgrade in the U.S., markets are pulling back. Our only question is whether they will now turn bearish? Or, will they remain irrational and bullish. My bet is on the latter but we shall soon find out.
Bitcoin is pulling back with the markets to test the topside of previous resistance as support. If it holds, we'll continue up. If support fails and we drop below 28,500 ish, I will have to reassess the chart.
For now, this classic retest remains yet another bullish signal.
Best,
Stew

BANK NIFTY INTRADAY LEVELS FOR 03/08/2023BUY ABOVE - 45130
SL - 44980
TARGETS - 45270,45400,45630
SELL BELOW - 45980
SL - 45130
TARGETS - 44730,44550,44280
Previous Day High - 45800
Previous Day Low - 45470
I am sharing BANK NIFTY levels this levels acts as important support & resistance for intraday. if you want to trade with this levels wait for 15 min Candle closing above that levels. You can trade with breakout and reversal both.
Based on price action major support & resistance's are here, the red lines acts as resistances, the green lines acts as supports. If the price breaks the support/resistance, it will move to the next support/resistance line. White lines indicates previous day high & low, high acts as a resistance & low acts as a support for next day.
Trendlines are also significant to price action. If the price is above/below the trendlines, can expect an UP/DOWN with aggressive move.
Please NOTE: this levels are for intraday trading only.
Disclaimer - All information on this page is for educational purposes only,
we are not SEBI Registered, Please consult a SEBI registered financial advisor for your financial matters before investing And taking any decision. We are not responsible for any profit/loss you made.
Request your support and engagement by liking and commenting & follow to provide encouragement
HAPPY TRADING 👍

NIFTY INTRADAY LEVELS FOR 03/08/2023BUY ABOVE - 19760
SL - 19730
TARGETS - 19790,19820,19870
SELL BELOW - 19700
SL - 19730
TARGETS - 19660,19610,19560
Previous Day High - 19680
Previous Day Low - 19420
I am sharing NIFTY levels this levels acts as important support & resistance for intraday. if you want to trade with this levels wait for 15 min Candle closing above that levels. You can trade with breakout and reversal both.
Based on price action major support & resistance's are here, the red lines acts as resistances, the green lines acts as supports. If the price breaks the support/resistance, it will move to the next support/resistance line. White lines indicates previous day high & low, high acts as a resistance & low acts as a support for next day.
Please NOTE: this levels are for intraday trading only.
Disclaimer - All information on this page is for educational purposes only,
we are not SEBI Registered, Please consult a SEBI registered financial advisor for your financial matters before investing And taking any decision. We are not responsible for any profit/loss you made.
Request your support and engagement by liking and commenting & follow to provide encouragement
HAPPY TRADING 👍

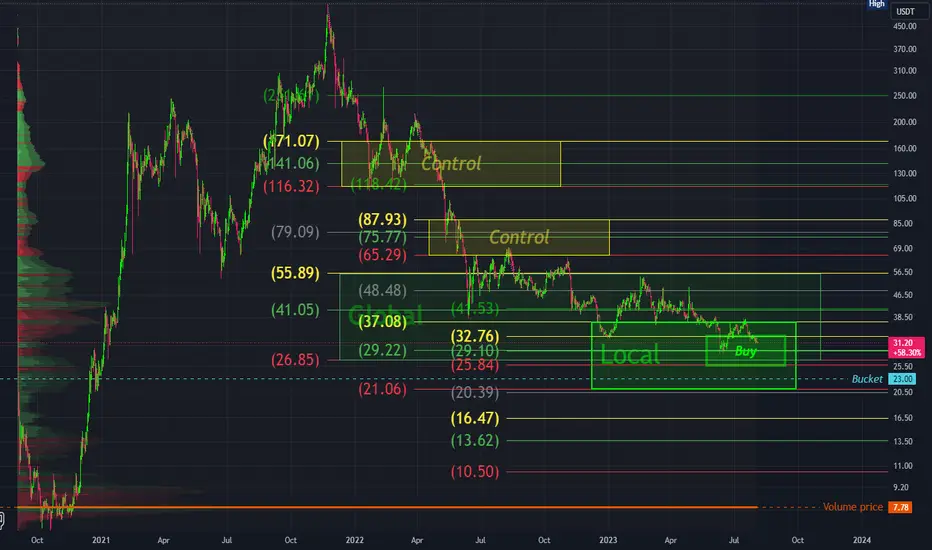
EGLD in the buy zone!!!EGLD is in the global buy zone 55.89-26.85
Local buy zone 37.08-21.06
Buy zone 32.76-25.84
Buy Level 29.10
A bucket of $23 (maybe backache)!
Volume price was 7.78
The one who has accumulated volume at this price is still holding it!!!
It follows that the price should be pushed well above the previous high!!!
BANK NIFTY INTRADAY LEVELS FOR 02/08/2023BUY ABOVE - 45630
SL - 45490
TARGETS - 45800,45940,46100
SELL BELOW - 45470
SL - 45630
TARGETS - 45290,45100,44920
Previous Day High - 45800
Previous Day Low - 45470
If Bank Nifty breaks that trend line... We will see fast momentum into Downside
I am sharing BANK NIFTY levels this levels acts as important support & resistance for intraday. if you want to trade with this levels wait for 15 min Candle closing above that levels. You can trade with breakout and reversal both.
Based on price action major support & resistance's are here, the red lines acts as resistances, the green lines acts as supports. If the price breaks the support/resistance, it will move to the next support/resistance line. White lines indicates previous day high & low, high acts as a resistance & low acts as a support for next day.
Trendlines are also significant to price action. If the price is above/below the trendlines, can expect an UP/DOWN with aggressive move.
Please NOTE: this levels are for intraday trading only.
Disclaimer - All information on this page is for educational purposes only,
we are not SEBI Registered, Please consult a SEBI registered financial advisor for your financial matters before investing And taking any decision. We are not responsible for any profit/loss you made.
Request your support and engagement by liking and commenting & follow to provide encouragement
HAPPY TRADING 👍

NIFTY SYMMETRICAL TRIANGLE FOR 02/08/2023BUY ABOVE - 19760
SL - 19730
TARGETS - 19790,19820,19870
SELL BELOW - 19700
SL - 19730
TARGETS - 19660,19610,19560
Previous Day High - 19790
Previous Day Low - 19700
I am sharing NIFTY levels this levels acts as important support & resistance for intraday. if you want to trade with this levels wait for 15 min Candle closing above that levels. You can trade with breakout and reversal both.
Based on price action major support & resistance's are here, the red lines acts as resistances, the green lines acts as supports. If the price breaks the support/resistance, it will move to the next support/resistance line. White lines indicates previous day high & low, high acts as a resistance & low acts as a support for next day.
Please NOTE: this levels are for intraday trading only.
Disclaimer - All information on this page is for educational purposes only,
we are not SEBI Registered, Please consult a SEBI registered financial advisor for your financial matters before investing And taking any decision. We are not responsible for any profit/loss you made.
Request your support and engagement by liking and commenting & follow to provide encouragement
HAPPY TRADING 👍

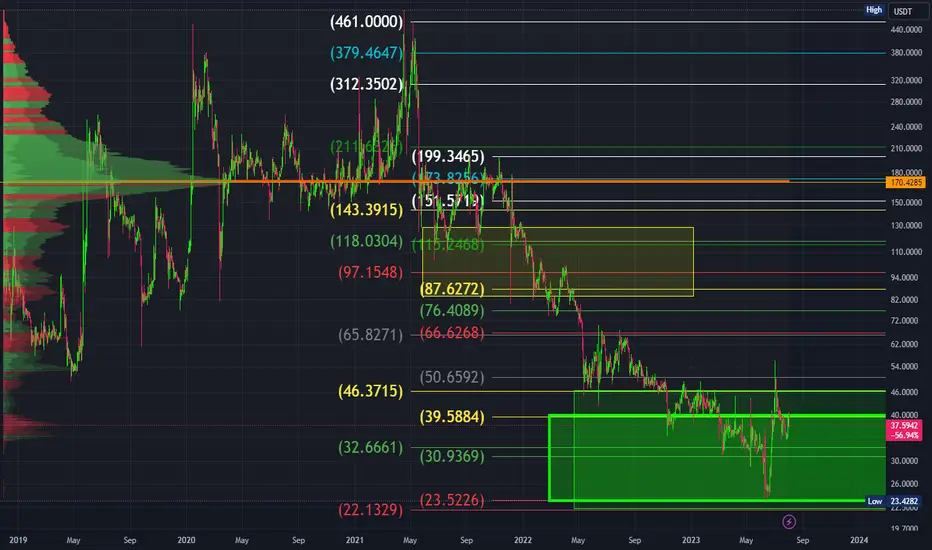
BSV in the buy zone!!!BSV is in a global buy green zone 46.371-22.132
Local buy zone 39.588-23.522
Buy Level 30.936
The entire local area is eligible for purchase !!!
The volume price is 170.42 orange.
I don't think that at this level someone gained volume, rather there was a sale!!!
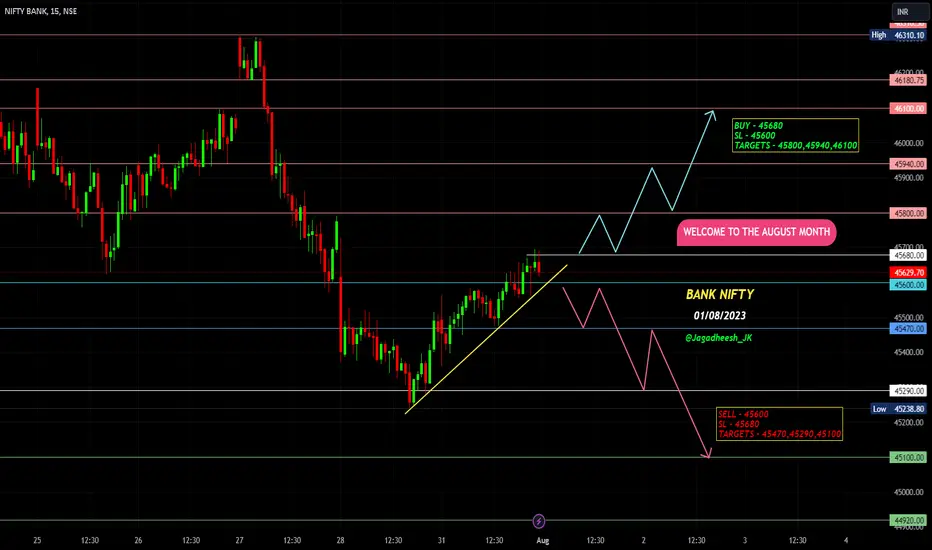
BANK NIFTY INTRADAY LEVELS FOR 01/08/2023BUY ABOVE - 45680
SL - 45600
TARGETS - 45800,45940,46100
SELL BELOW - 45600
SL - 45680
TARGETS - 45470,45290,45100
Previous Day High - 45680
Previous Day Low - 45360
If Bank Nifty breaks that trend line... We will see fast momentum into Downside
I am sharing BANK NIFTY levels this levels acts as important support & resistance for intraday. if you want to trade with this levels wait for 15 min Candle closing above that levels. You can trade with breakout and reversal both.
Based on price action major support & resistance's are here, the red lines acts as resistances, the green lines acts as supports. If the price breaks the support/resistance, it will move to the next support/resistance line. White lines indicates previous day high & low, high acts as a resistance & low acts as a support for next day.
Trendlines are also significant to price action. If the price is above/below the trendlines, can expect an UP/DOWN with aggressive move.
Please NOTE: this levels are for intraday trading only.
Disclaimer - All information on this page is for educational purposes only,
we are not SEBI Registered, Please consult a SEBI registered financial advisor for your financial matters before investing And taking any decision. We are not responsible for any profit/loss you made.
Request your support and engagement by liking and commenting & follow to provide encouragement
HAPPY TRADING 👍
NIFTY INTRADAY LEVELS FOR 01/08/2023BUY ABOVE - 19760
SL - 19720
TARGETS - 19820,19870,19950
SELL BELOW - 19700
SL - 19730
TARGETS - 19660,19610,19560
Previous Day High - 19770
Previous Day Low - 19600
If Nifty breaks that major trend line... We will see fast momentum into upside
I am sharing NIFTY levels this levels acts as important support & resistance for intraday. if you want to trade with this levels wait for 15 min Candle closing above that levels. You can trade with breakout and reversal both.
Based on price action major support & resistance's are here, the red lines acts as resistances, the green lines acts as supports. If the price breaks the support/resistance, it will move to the next support/resistance line. White lines indicates previous day high & low, high acts as a resistance & low acts as a support for next day.
Please NOTE: this levels are for intraday trading only.
Disclaimer - All information on this page is for educational purposes only,
we are not SEBI Registered, Please consult a SEBI registered financial advisor for your financial matters before investing And taking any decision. We are not responsible for any profit/loss you made.
Request your support and engagement by liking and commenting & follow to provide encouragement
HAPPY TRADING 👍

NIFTY INTRADAY LEVELS FOR 31/07/2023BUY ABOVE - 19660
SL - 19630
TARGETS - 19700,19760,19820
SELL BELOW - 19610
SL - 19640
TARGETS - 19560,19520,19470
Previous Day High - 19700
Previous Day Low - 19560
I am sharing NIFTY levels this levels acts as important support & resistance for intraday. if you want to trade with this levels wait for 15 min Candle closing above that levels. You can trade with breakout and reversal both.
Based on price action major support & resistance's are here, the red lines acts as resistances, the green lines acts as supports. If the price breaks the support/resistance, it will move to the next support/resistance line. White lines indicates previous day high & low, high acts as a resistance & low acts as a support for next day.
Please NOTE: this levels are for intraday trading only.
Disclaimer - All information on this page is for educational purposes only,
we are not SEBI Registered, Please consult a SEBI registered financial advisor for your financial matters before investing And taking any decision. We are not responsible for any profit/loss you made.
Request your support and engagement by liking and commenting & follow to provide encouragement
HAPPY TRADING 👍

BANK NIFTY INTRADAY LEVELS FOR 31/07/2023BUY ABOVE - 45600
SL - 45480
TARGETS - 45800,45940,46100
SELL BELOW - 45290
SL - 45380
TARGETS - 45100,44920,44800
Previous Day High - 45730
Previous Day Low - 45240
I am sharing BANK NIFTY levels this levels acts as important support & resistance for intraday. if you want to trade with this levels wait for 15 min Candle closing above that levels. You can trade with breakout and reversal both.
Based on price action major support & resistance's are here, the red lines acts as resistances, the green lines acts as supports. If the price breaks the support/resistance, it will move to the next support/resistance line. White lines indicates previous day high & low, high acts as a resistance & low acts as a support for next day.
Trendlines are also significant to price action. If the price is above/below the trendlines, can expect an UP/DOWN with aggressive move.
Please NOTE: this levels are for intraday trading only.
Disclaimer - All information on this page is for educational purposes only,
we are not SEBI Registered, Please consult a SEBI registered financial advisor for your financial matters before investing And taking any decision. We are not responsible for any profit/loss you made.
Request your support and engagement by liking and commenting & follow to provide encouragement
HAPPY TRADING 👍

Bank NIFTY Points of Interest for MondayThese are the levels where prices will tend to react. Don't treat these levels as Support or Resistance. Market will most likely continue bearish trend as huge Call writing is seen on 45600 onwards and huge Call writing on 46000 levels. Use your favorite indicators to assess bullishness or bearishness but try to trade level to level

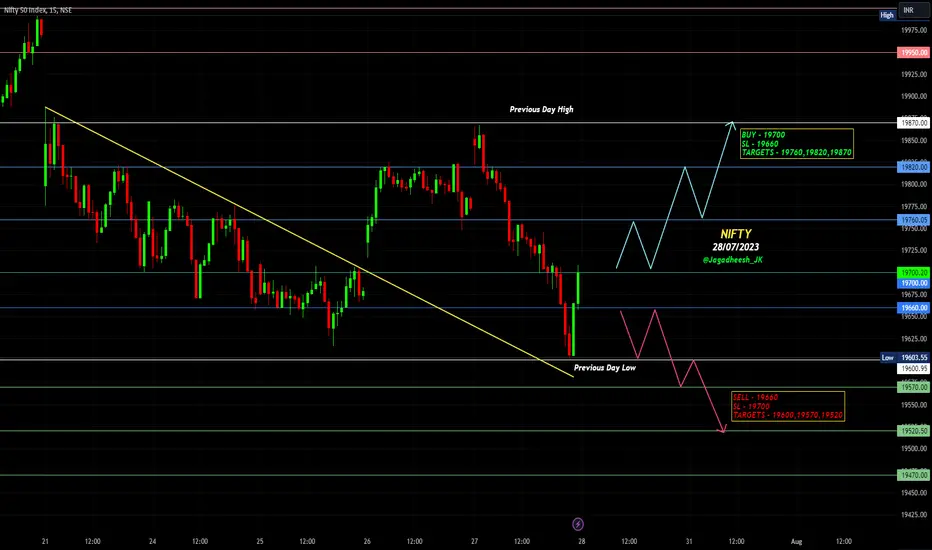
NIFTY INTRADAY LEVELS FOR 28/07/2023BUY ABOVE - 19700
SL - 19660
TARGETS - 19760,19820,19870
SELL BELOW - 19660
SL - 19700
TARGETS - 19600,19570,19520
Previous Day High - 19870
Previous Day Low - 19600
I am sharing NIFTY levels this levels acts as important support & resistance for intraday. if you want to trade with this levels wait for 15 min Candle closing above that levels. You can trade with breakout and reversal both.
Based on price action major support & resistance's are here, the red lines acts as resistances, the green lines acts as supports. If the price breaks the support/resistance, it will move to the next support/resistance line. White lines indicates previous day high & low, high acts as a resistance & low acts as a support for next day.
Please NOTE: this levels are for intraday trading only.
Disclaimer - All information on this page is for educational purposes only,
we are not SEBI Registered, Please consult a SEBI registered financial advisor for your financial matters before investing And taking any decision. We are not responsible for any profit/loss you made.
Request your support and engagement by liking and commenting & follow to provide encouragement
HAPPY TRADING 👍