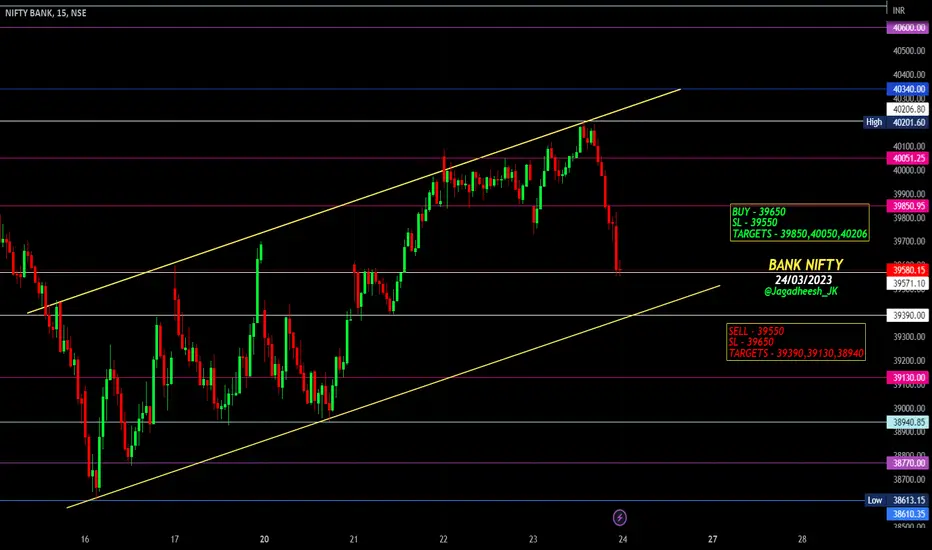
BANK NIFTY ANALYSIS - 24/03/2023BUY - 39650
SL - 39550
TARGETS - 39850,40050,40206
SELL - 39550
SL - 39650
TARGETS - 39390,39130,38940
Trade Safe & Happy Trading Guys
This is only for educational purpose so TAKE YOUR OWN RISK REWARD
Levels
NIFTY ANALYSIS - 24/03/2023Buy Above - 17130
SL - 17060
Targets - 17210,17320,17370
Sell Below - 17060
SL - 17100
Targets - 16950,16850,16790
Trade Safe & Happy Trading Guys
This is only for educational purpose so TAKE YOUR OWN RISK REWARD

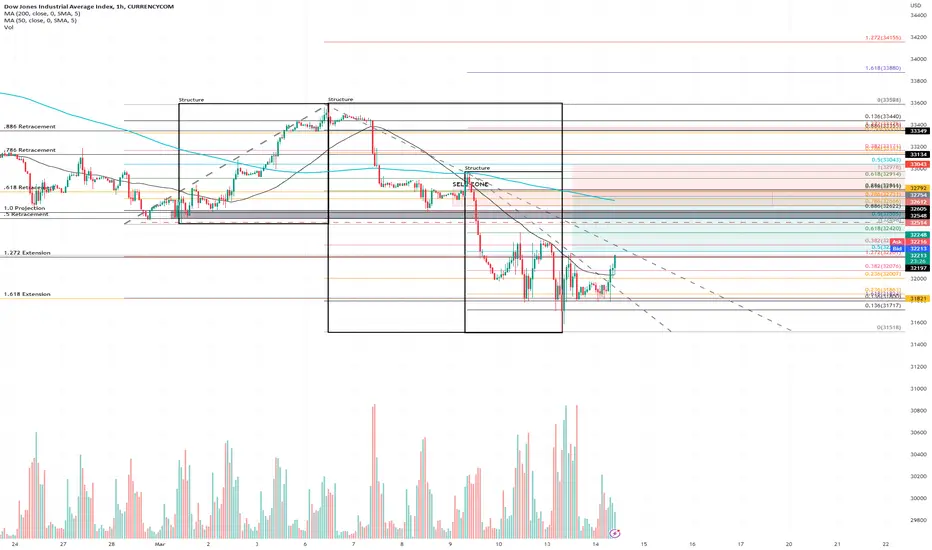
US30: Downtrend to ContinueI think the market will continue its downtrend, once price action reaches this zone. I anticipate a lot of choppiness and consolidation, so be patient with the entries and wise with the risk. If you get stopped out, again, be patient and wait for another opportunity at strong resistance.
I identified 3 different structures here and used them to plot levels on the chart.
Structure 1 (L2H) is the up structure that gave us the 1.272 & 1.618 extensions, giving us some signs that the market may be about to pull back and rally for a bit.
Structure 2 (H2L) is the larger structure that gives us three retracement levels. The .5, .618, and the .786-.886 zone. We should pay attention to these levels of interest when price arrives.
Structure 3 (H2L) is the smaller down structure that gives us a second set of levels to consider, primarily the .786 & .886 retracement. This is the structure that price is currently trading in and the one we'll use to determine how the market is trending as it approaches significant levels.
The Sell Zone I have marked is the confluence between the .618 of S2, and the .786-.886 of S3. This area also coincides with a potential testing of the 200MA, Several resistance zones that the market may retest, a 1.0 price projection, and the .5 retracement of S2. This is a large area to consider, so as always, be responsible with your risk. If the market doesn't reach our levels and sells off quickly then no worries, there will be other trades. No FOMO!
---
Levels of Development LLC is providing this material for this site and any other related sources (including newsletters, blog posts, videos, social media, and other communications) for educational purposes only. We are not providing legal, accounting, or financial advisory services, and this is not a solicitation or recommendation to buy or sell any stocks, options, or other financial instruments or investments. Examples that address specific assets, stocks, options, or other financial instrument transactions are for illustrative purposes only and may not represent specific trades or transactions that we have conducted. We may use examples that are different or the opposite of transactions we have conducted or positions we hold.
All investing and trading in the securities market involve risk. Any decision to place trades in the financial markets, including trading in stock or options or other financial instruments, is a personal decision that should only be made after thorough research, including a personal risk and financial assessment, and the engagement of professional assistance to the extent you believe necessary.
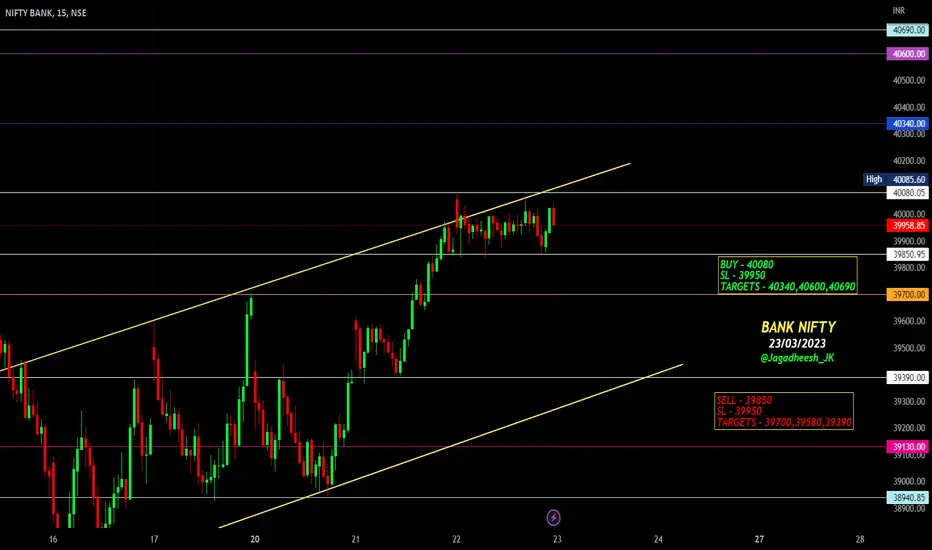
BANK NIFTY ANALYSIS - 23/03/2023Buy Above - 40080
SL - 39950
Targets - 40340,40600,40690
Sell Below - 39850
SL - 39950
Targets - 39700,39580,39390
Trade Safe & Happy Trading Guys
This is only for educational purpose so TAKE YOUR OWN RISK REWARD
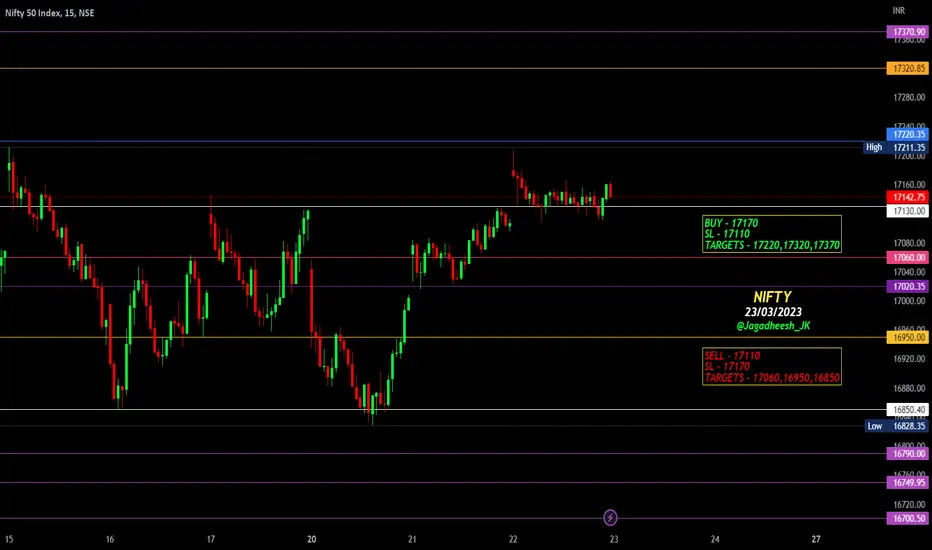
NIFTY ANALYSIS - 23/03/2023Buy Above - 17170
SL - 17110
Targets - 17220,17320,17370
Sell Below - 17110
SL - 17170
Targets - 17060,16950,16850
Trade Safe & Happy Trading Guys
This is only for educational purpose so TAKE YOUR OWN RISK REWARD
BANK NIFTY ANALYSIS - 22/03/2023Buy Above - 39970
SL - 39860
Targets - 40080,40340,40600
Sell Below - 39700
SL - 39770
Targets - 39580,39390,39130
Trade Safe & Happy Trading Guys
This is only for educational purpose so TAKE YOUR OWN RISK REWARD

NIFTY ANALYSIS - 22/03/2023Buy Above - 17130
SL - 17090
Targets - 17220,17320,17370
Sell Below - 17060
SL - 17090
Targets - 17020,16950,16850
Trade Safe & Happy Trading Guys
This is only for educational purpose so TAKE YOUR OWN RISK REWARD

Key Levels and Stocks to Watch Leading Up to FOMC MeetingAs the market anticipates the upcoming Federal Open Market Committee (FOMC) meeting, investors are keeping a close eye on key levels and stocks that may experience significant movements. In this article, we will discuss the potential scenarios for the S&P 500 Index (SPX), Nasdaq 100 (QQQ), and several prominent stocks, as well as the importance of the FOMC meeting in shaping market momentum.
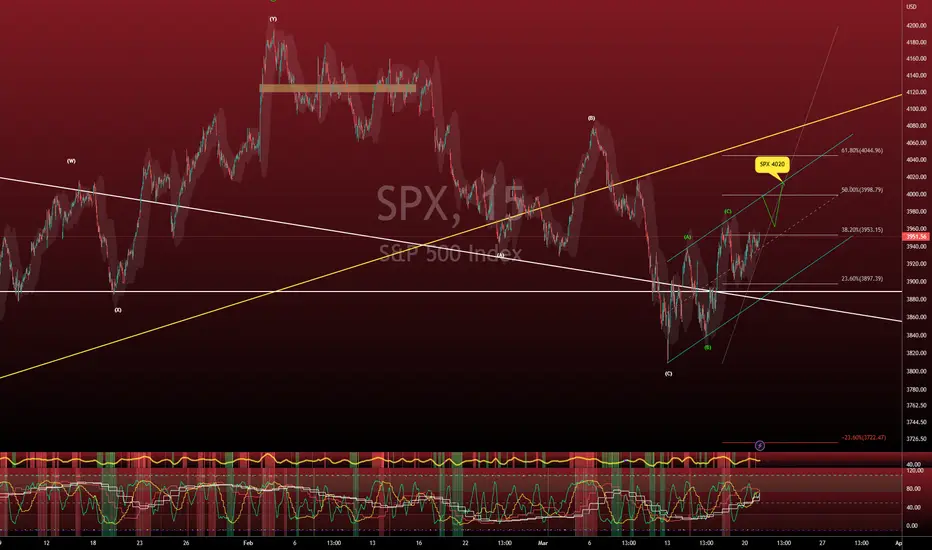
SPX and QQQ: Key Levels to Watch
SPX appears to be setting up for a test of the 4000 level, with the potential to run up to 4020 if it can break through the resistance. The FOMC meeting will play a crucial role in determining market direction, so investors should monitor developments closely.
Similarly, QQQ is approaching the 309 level, currently up almost 2 points in premarket trading. A break above 309 could lead to a test of the 315 level. As with the SPX, the FOMC meeting will be a key factor in shaping the QQQ's performance.
Stocks to Monitor: TSLA, AAPL, NVDA, AMD, META, and MSFT
Tesla (TSLA) is poised for a potential move towards 190, with 196 as the next target level.
Apple (AAPL) is best positioned if it can maintain support at 157.
NVIDIA (NVDA) is setting up for a move towards 269, with premarket trading showing an increase of almost 4 points.
Advanced Micro Devices (AMD) still has the potential to reach the 100 level.
Meta Platforms (META) may experience a 5-point gap up if it can break above 205, with the potential to run up to 213.
Microsoft (MSFT) appears somewhat weak at present, with a stronger outlook if it can move through the 276 level.
Market Momentum and FOMC Meeting
As the market begins to gain momentum on the upside, it is essential for investors to monitor the FOMC meeting's outcome. Ideally, a strong close near the 4000 level for the SPX and 309 for the QQQ would indicate a bullish market environment leading into the FOMC meeting.
In anticipation of the FOMC meeting, you should remain vigilant and monitor key levels for the SPX, QQQ, and select individual stocks. The market's momentum leading into the meeting will play a significant role in shaping future trends, so staying informed on the latest developments is critical for successful investment strategies.
BANK NIFTY ANALYSIS - 21/03/2023DOUBLE BOTTOM PATTERN
Buy Above - 39400
SL - 39330
Targets - 39700,39900,40080
Sell Below - 39300
SL - 39400
Targets - 39130,38940,38770
Trade Safe & Happy Trading Guys
This is only for educational purpose so TAKE YOUR OWN RISK REWARD

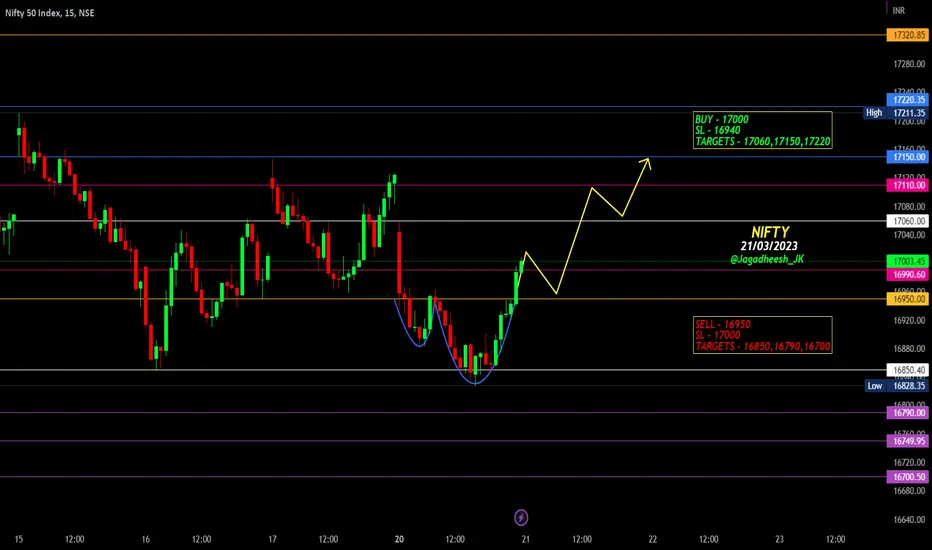
NIFTY ANALYSIS - 21/03/2023Buy Above - 17000
SL - 16940
Targets - 17060,17150,17220
Sell Below - 16940
SL - 17000
Targets - 16850,16790,16700
Trade Safe & Happy Trading Guys
This is only for educational purpose so TAKE YOUR OWN RISK REWARD
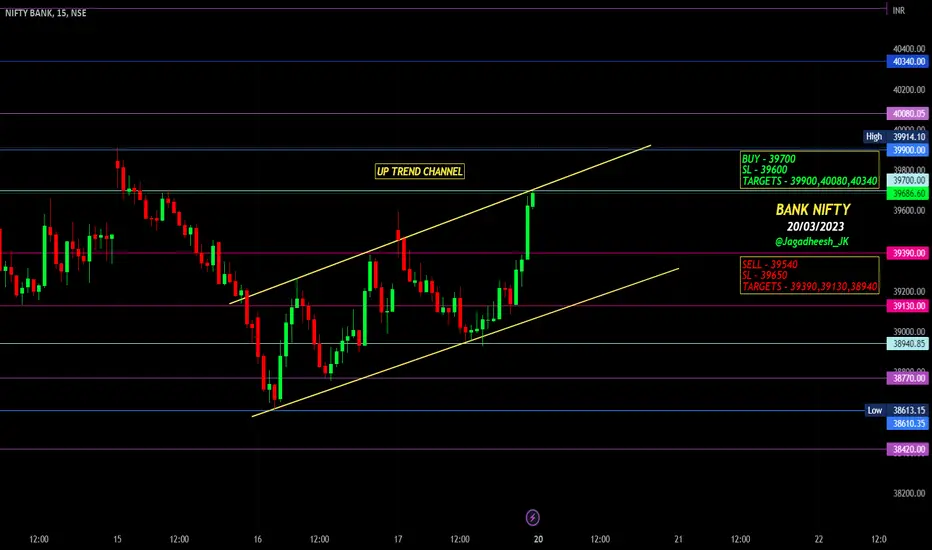
BANK NIFTY ANALYSIS - 20/03/2023UP TREND CHANNEL
Buy Above - 39700
SL - 39600
Targets - 39900,40080,40340
Sell - 39540
SL - 39650
Targets - 39390,39130,38940
Trade Safe & Happy Trading Guys
This is only for educational purpose so TAKE YOUR OWN RISK REWARD
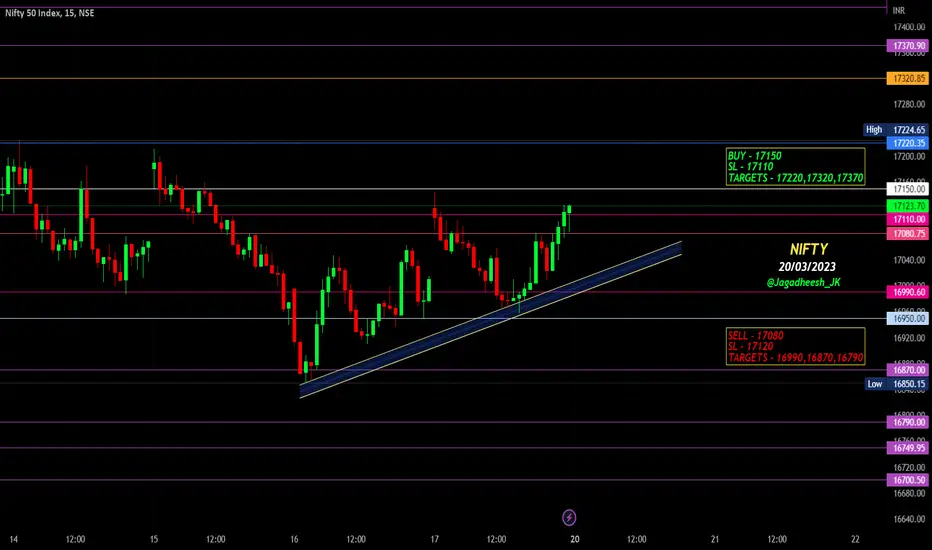
NIFTY ANALYSIS - 20/03/2023Buy Above - 17150
SL - 17110
Targets - 17220,17320,17370
Sell Below - 17080
SL - 17120
Targets - 16990,16870,16790
Trade Safe & Happy Trading Guys
This is only for educational purpose so TAKE YOUR OWN RISK REWARD
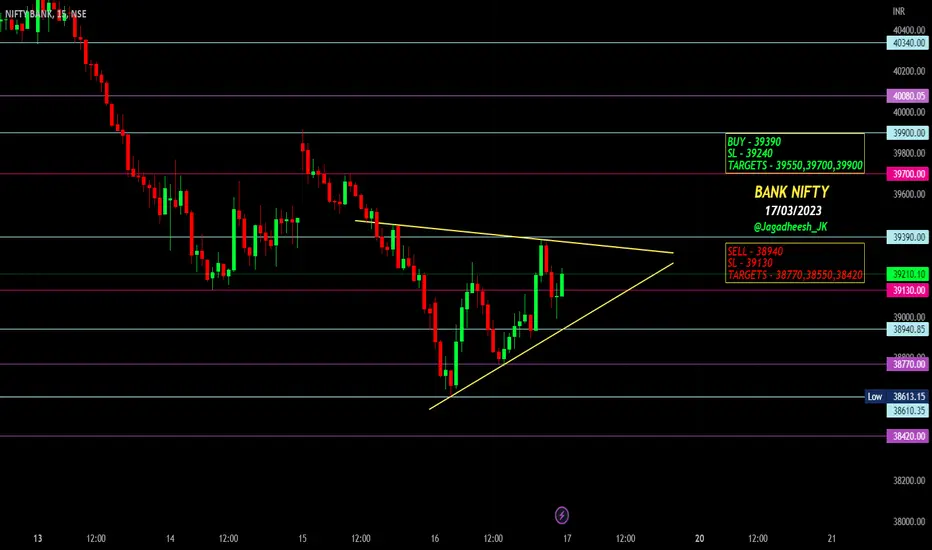
BANK NIFTY ANALYSIS - 17/03/2023Buy Above - 39390
SL - 39240
Targets - 39550,39700,39900
Sell Below - 38940
SL - 39130
Targets - 38770,38550,38420
Trade Safe & Happy Trading Guys
This is only for educational purpose so TAKE YOUR OWN RISK REWARD
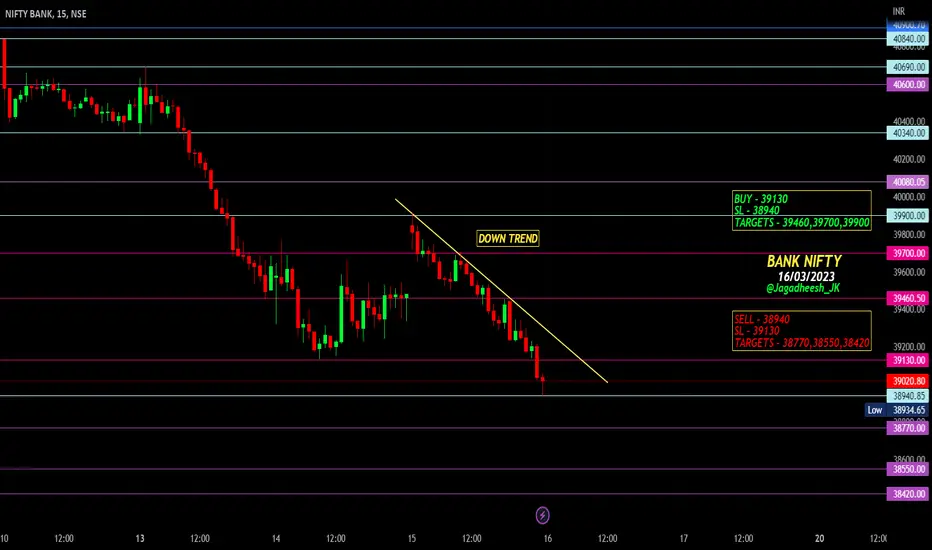
BANK NIFTY - 16/03/2023DOWN TREND
Buy Above - 39130
SL - 38940
Targets - 39460,39700,39900
Sell Below - 38940
SL - 39130
Targets - 38770,38550,38420
Trade Safe & Happy Trading Guys
This is only for educational purpose so TAKE YOUR OWN RISK REWARD
NIFTY ANALYSIS - 16/03/2023 Buy Above - 16990
SL - 16940
Targets - 17110,17220,17320
Sell Below - 16940
SL - 16990
Targets - 16870,16790,16700
Trade Safe & Happy Trading Guys
This is only for educational purpose so TAKE YOUR OWN RISK REWARD

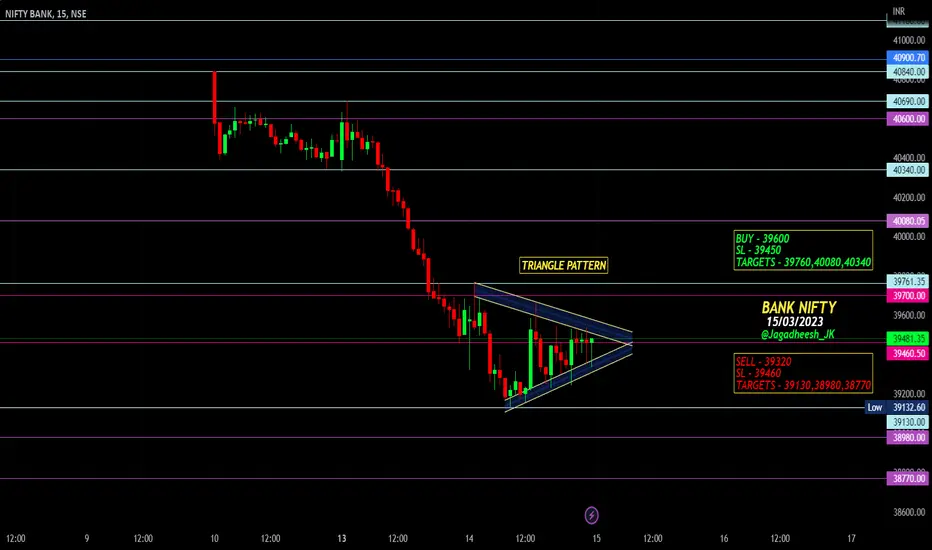
BANK NIFTY ANALYSIS - 15/03/2023TRIANGLE PATTERN
Buy Above - 39600
SL - 39450
Targets - 39760,40080,40340
Sell Below - 39320
SL - 39460
Targets - 39180,38980,38770
Trade Safe & Happy Trading Guys
This is only for educational purpose so TAKE YOUR OWN RISK REWARD
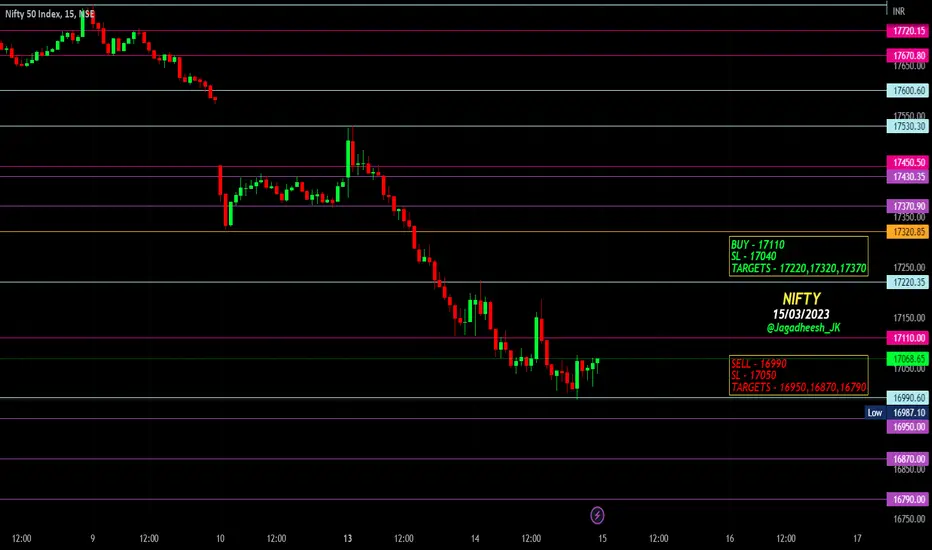
NIFTY ANALYSIS - 15/03/2023Buy above - 17110
SL - 17040
Targets - 17220,17320,17370
Sell Below - 16990
SL - 17050
Targets - 16950,16870,16790
Trade Safe & Happy Trading Guys
This is only for educational purpose so TAKE YOUR OWN RISK REWARD
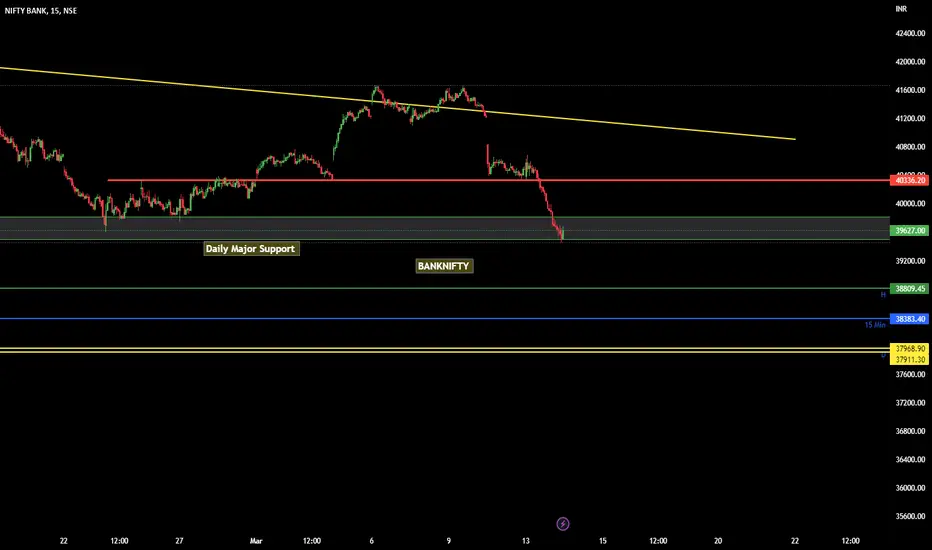
BANKNIFTY : on daily supportBANKNIFTY closed is near major daily support level. Once it break we may see next daily support in coming days.
Levels of daily, hourly & 15min timeframe marked on chart for today. Follow Price action & trend
Like, Share, Comment for regular updates.
Disclaimer
I am not sebi registered analyst
My studies are Educational purpose only
Please consult with your Financial advisor before trading or investing
I may be 100% wrong as its my personal trade.
First Learn and then remove "L"
BANK NIFTY ANALYSIS - 14/03/2023Buy Above - 39700
SL - 39550
Targets - 39830,40080,40340
Sell Below - 39460
SL - 39600
Targets - 39200,38980,38770
Trade Safe & Happy Trading Guys
This is only for educational purpose so TAKE YOUR OWN RISK REWARD

NIFTY ANALYSIS - 14/03/2023DOWN TREND PATTERN
Buy Above - 17200
SL - 17130
Targets - 17260,17320,17370,17430
Sell Below - 17110
SL - 17180
Targets - 17080,16950,16870
Trade Safe & Happy Trading Guys
This is only for educational purpose so TAKE YOUR OWN RISK REWARD

NIFTY at ??????After gap down on friday sharp selling coming on next week.
last month support on 17250 - 17300 level it will brake.
market will break 17000 in this month that will take new level on chart.
some high weightage stock are week on chart.
data is negative.
sharp selling is upcoming in short.

BANK NIFTY ANALYSIS - 13/03/2023Buy Above - 40540
SL - 40460
Targets - 40600,40730,40900,41100
Sell Below - 40340
SL - 40440
Targets - 40080,39830,39700
Trade Safe & Happy Trading Guys
This is only for educational purpose so TAKE YOUR OWN RISK REWARD

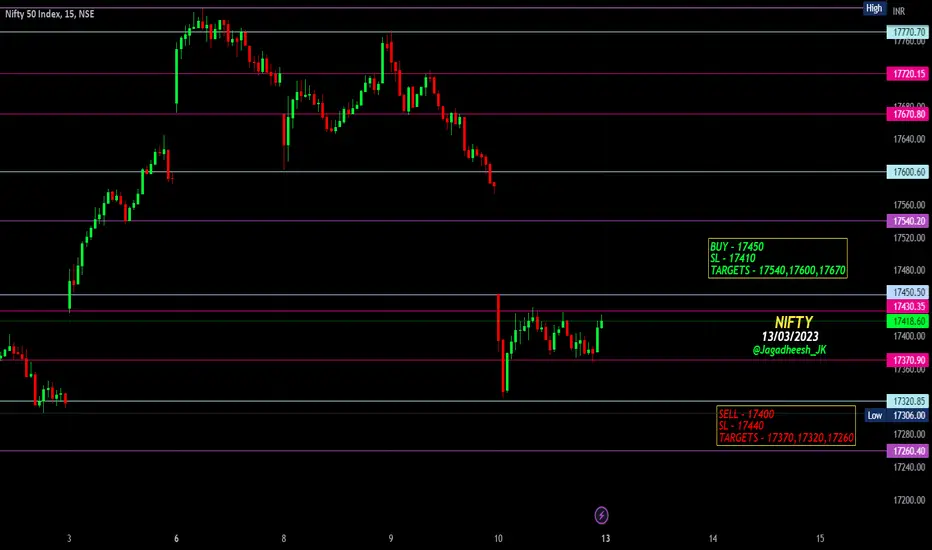
NIFTY ANALYSIS - 13/03/2023Buy Above - 17450
SL - 17410
Targets - 17540,17600,17670
Sell Below - 17400
SL - 17440
Targets - 17370,17320,17260
Trade Safe & Happy Trading Guys
This is only for educational purpose so TAKE YOUR OWN RISK REWARD