Buy DASH BTC (Long term or Leveraged Entry)Alright guys. Been working and backtesting this. There's so much money to be made, and the opportunity to flip accounts quickly and safely are at an all time high, thanks to the de-centralized and mostly unmanipulated marketplace, making the market (charts) very transparent for the experienced technical trader.
So with any trade there's a couple simple principles EVERYONE looks at when determining a trade.
Market Structure
Retracements from a recent obvious high or low
Bulls vs Bears
Bulls vs Bears explained: The more and more I look through charts, in this case the very bullish crypto charts, there is a give in take. When a sign that the sellers want to come in and take their profits, the major bullish players throughout the world will take notice and allow the bears to take their profits. It's the only way to maintain a healthy give and take market. Especially in a healthy bullish market, which is definitely where we are at right now.
PLEASE NOTEAlso, there is one final confirmation before price heads back towards the previous high. Once EVERYTHING has been accounted for when looking for a buy (Price hit it's natural retrace point. Bearish market structure is broken. Buyers show up. And when the sellers DON'T show up) This confirmation is a bullish engulfing candle reversal on top of the 10 ema. This is a powerful long term play that works really quite well on the Weekly and Daily and even 4h timeframes. And, you can choose to have a tight stop loss... a little more risky, but the returns are much greater, even in the long run. One more thing on this signal, it must be OBVIOUS that price wants to chill and stay closed above the 10 ema.
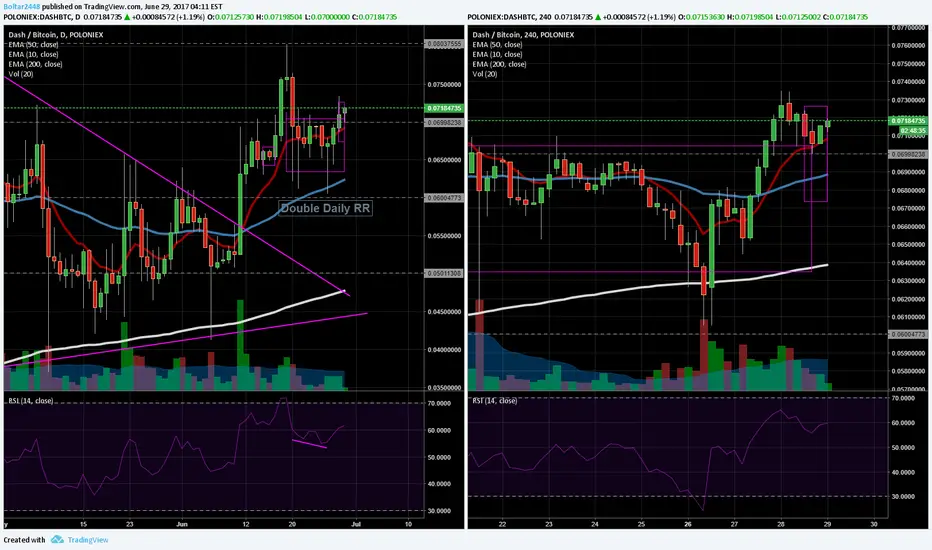
DASH BTC 6-29-17
Now that I have kinda emptied my head, let's get into what I see here in DASH :)
(I apologize for the tight screenshot of the Daily. Gotta make that money to get a sweet setup.)
On the DAILY:
First, please refer to your own naked daily chart of DASH. This is all a learning process guys, and we need to work together to dominate this game.
We had a very obvious rise, and a very obvious retracement, which is where price is at now. During the retracement, price quickly came to a point that the buyers would not let the bears pass. Enough time has now passed for the bears to notice, and to take profit ASAP. Now we had just made a little new high (shown on my screenshot). So this is where I would look to take a long term entry.
But I like to be specific. Let's wait for confirmation on the retracement and we can get a perhaps perfect entry, and have a tighter, more specific stop loss.
On this little retracement, it made a W towards the ultimate bullish trend. And, it happened to be divergent. (Rsi, tdi) Divergent and OBVIOUS M's and W's on retracements towards the peak formation are probably the strongest tells of a trade.
There's also another way of looking at this, and I want some of you to look for it too.
On this little retracement shown on the Daily screenshot, it made two perfect bullish candle formations touching and closing consistently above the 10ema that look FUCKING PRETTY. This is the maybe number one sign that the bears are mostly out of the game and the bulls can take their trades.
Boom. Take the trade. Long term.
And for risk takers, like me, here is a possible way to start making more money or btc or whatever.
Once you have all the confirmations on the Weekly or Daily, take a 4h entry as well, with a 4h SL, and look to take a 1:2 or 1:3 profit based on your risk/Stop loss.
Here on the right, After it made it's W towards the upside on first rise that broke market structure on the daily, we need a new high made on the 4h, and an obvious candle reversal against the 10 EMA
This is an opportunity to take a 4h entry on a Daily trade. You can have your SL a below the most recent red candle on the screenshot. Upto you. Actually, putting it at or below the 50EMA looks to be a good option.
Take profit 2x or 3x your risk. This is at least a 75%+ trade.
Leveraged
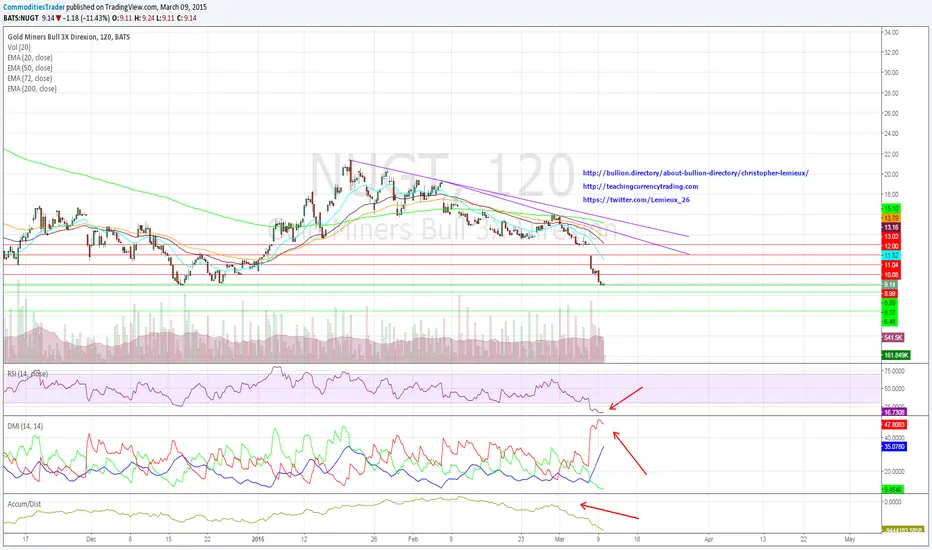
Bullish Leveraged Gold ETFs Get Hammered – A Pullback Warranted?Given the large gains seen over the last two days, there could be support in the cards for leveraged minor ETFs following profit taking. NUGT, Direxion Daily Gold Miners, is the 3x leverage of the Market Vectors Gold Miners ETF (GDX).
Price action is heavily to the downside, reaching support at $9.11 – forming a triple-bottom on the two-hour chart. Price visited this level on December 16 and 24, and NUGT is currently treading water. A short-term pullback is probable given the steep oversold condition, with the RSI at 16. The – DMI has ticked lower, signaling that downside could take a breather. However, the ADX is still sloping upward which is indicative of strong trend continuation.
Next, the underlying benchmark GDX is showing the same negative sentiment. The chart, in many ways, is similar to NUGT. If the gold miners ETF can rally to the targeted resistance level of $18.46, this would represent a 9.51 percent increase in NUGT, or a move to $9.98 and just shy of the $10.08 resistance level. If prices can extend to the second resistance target of $18.74, NUGT could potentially extend to $10.33.
Conversely, there is the likelihood that the intraday trend could continue lower. In this case, if GDX were to trade lower to the first support level of $17.55 then NUGT could move lower to $8.37 and break the triple-bottom support. A larger move to $17.35 would reflect a 28.5 percent loss in NUGT, causing the bearish ETF to fall to $6.48.
As always, intraday charts are vulnerable to significant volatility caused by headline risk and potential outlook is only suitable for the next few trading sessions.
See full post here: bullion.directory
LEVERAGE: The Legitimate UsageImagine you have a strategy and you found that the optimal risk you should take is 4%.
In other words with this strategy you should put 4% of your capital at risk in every trade to grow your account the fastest.
If you enter a trade with 100% of your capital, the SL % is the % you put at risk. NOT the whole position size. So by entering a trade with all of your money and setting a 4% SL you only put 4% of your money at risk at all times !
Now let's examine the following situation keeping our strategy in mind.
Imagine a perfectly oscillating market (for demonstration only). We are at the point where the red line ends and we expect the price to go the dashed path with a very high certainty. Our optimal & desired risk is 4%. However in this trade that we want to enter rightnow we can set a stop loss tighter than 4% because we are very certain that it wont be hit. So we can use a 2% stop instead. If you now put 100% of your capital in this trade you only put 2% of our money at risk at all times. However we want to put 4% of our money at risk for the best returns possible taking optimal risk (4%). That's where leverage comes into play as a LEGITIMATE tool and not a gambling tool. You already have 100% of your money in this trade, you can't put in more (without leverage) although your risk management tells you to do so. You want to increase your risk from currently 2% to 4% = double it. This means you have to take a 2x leverage. Now you are 200% invested in the trade and if your stop loss of 2% (in price action) gets hit you will lose 2 x 2% = 4% which is the optimal risk we wanted.
More in-depth information about optimal risk for fast growth:
en.wikipedia.org
www.youtube.com

Bitcoin on a nice reverse after dropping under 295Looks like we found a new support around $334 - I've got a long open since 310 and aiming to hold this position until 365. we've got a strong reversal about to happen but unsure where it'll lead us and how far up it'll go.
I re-approached my positioning last night when the price was at 319 and I was still confident in my positioned unit. if we see the value of bitcoin drop under 330 again we might be stuck betwee 299-330 as a support for the coming weekend.
due diligence and you'll notice a change in your trades.
