Link long - zoom in on weekly closeWe are approaching a breakout.
Maybe this week's close is the trigger that all the bulls (and altcoins) have been waiting for.
Generally speaking, I don't like trading Chainlink. Although if we see a weekly close just above 14.2, above the 20 MA, I think it could be a good investment entry.
I think Chainlink will be one of the utility coins that completely explodes before retail has time to react. A good weekly close is something that smart money probably would appreciate. If you think long-term, I think Chainlink is in a good position with good upside without any immediate big risk.
LINK
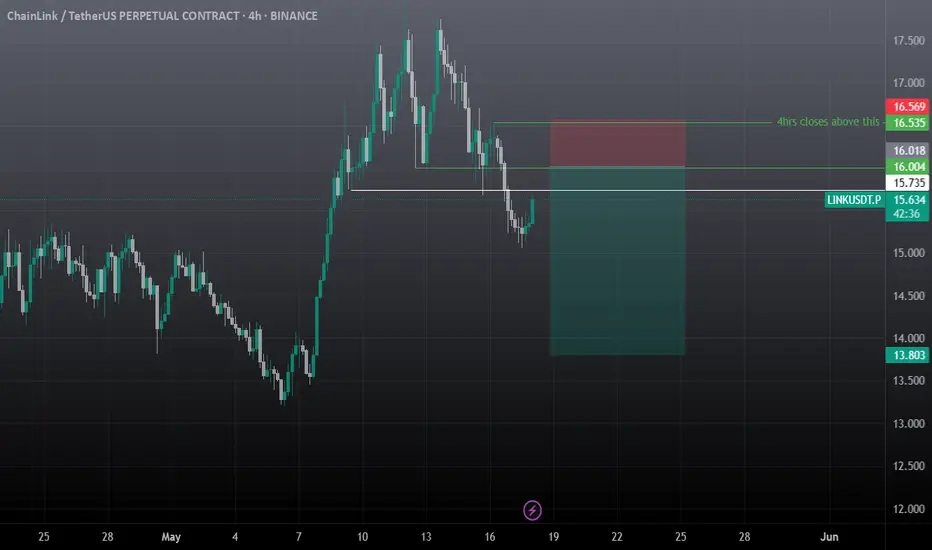
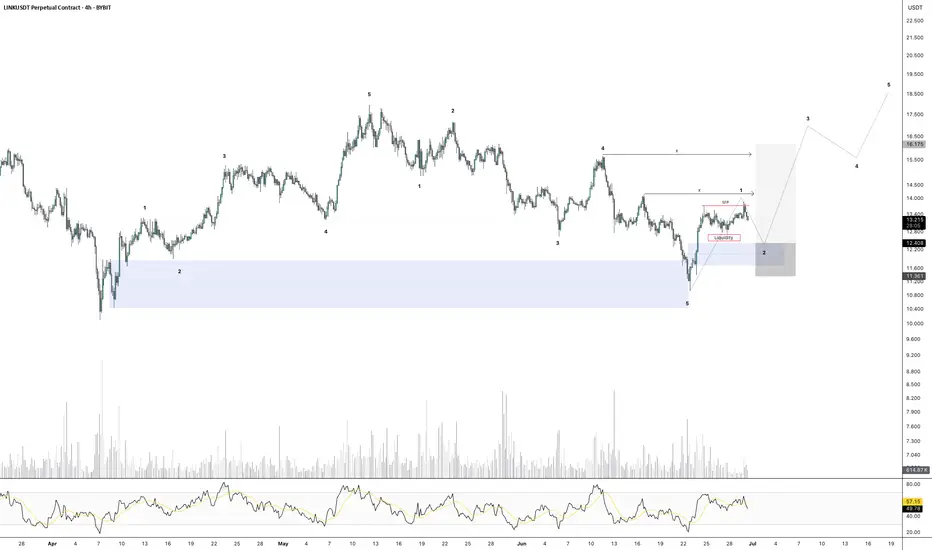
Link short setup tradeAS previous short setup hits the tp but actually first manipulation to hit the sl, now closely monitor the trade and manually close if 4hr candle closes above the mentioned point, overall I'm bearish on whole market, needs to take a correction before another leg up, until unless usdt.d breaks and closes below 4.59% on 4hrs tf market is bearish, you need to take short position intsead of long positions, when usdt.d reaches 4.63% open short on link, inj, eth and btc and hold till 4.80%-4.89%. I will open long if we break 4.59% and retest this, other scenario if we reaches 4.80-4.90% first no long positions for me from here.
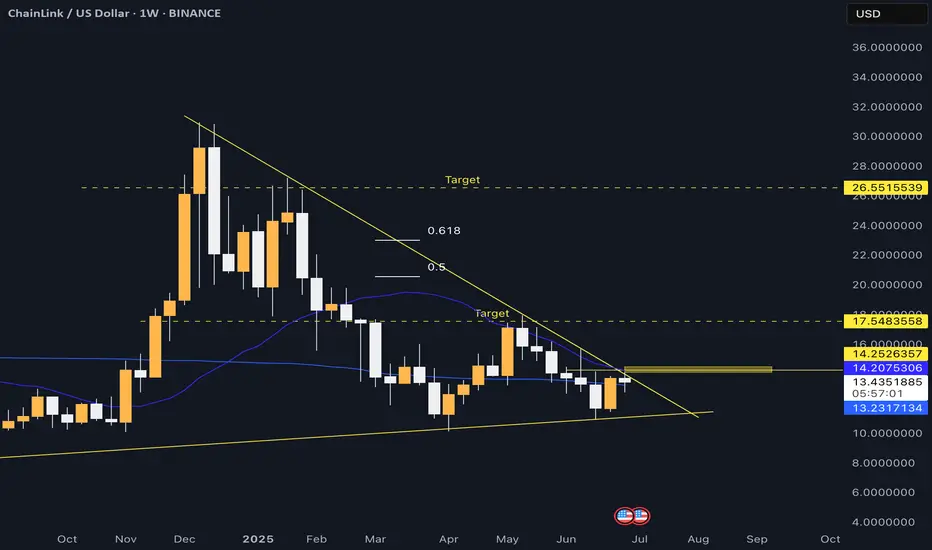
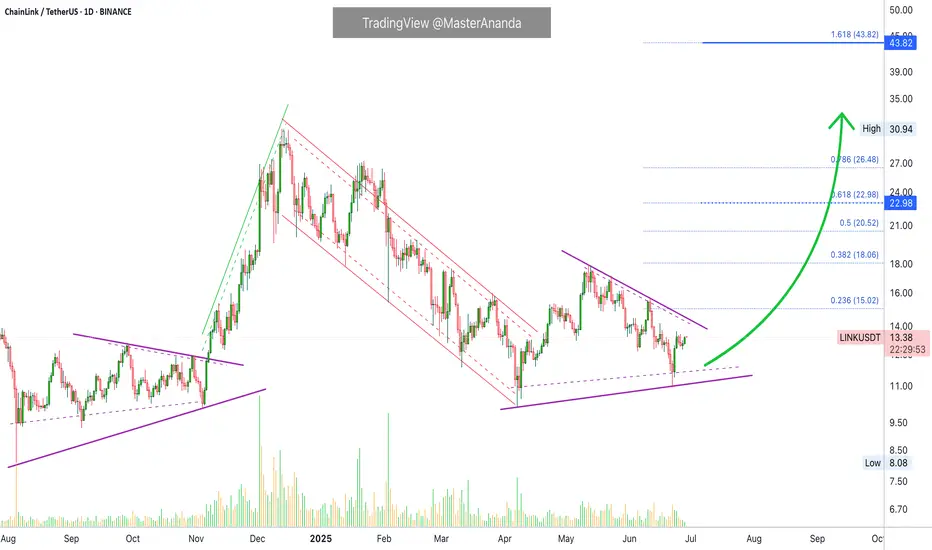
LINK/USDT Chainlink Gearing Up for a Major Breakout?
🧠 Overview:
The LINK/USDT chart is showcasing a high-conviction technical setup — a well-defined Descending Triangle that has been forming for over 6 months. This pattern often acts as a pressure-cooker scenario, building up momentum before a major breakout.
The triangle is composed of consistent lower highs pressing against a strong horizontal support zone at $12.5 – $13.2, which has been tested and held multiple times since February 2025.
Currently, the price is approaching the apex of the triangle, signaling that a breakout is likely imminent.
📐 Pattern Details – Descending Triangle:
🔻 Descending Resistance Line: Connecting lower highs since the January 2025 peak.
🟨 Flat Support Zone: The $12.5 – $13.2 level has served as a strong demand zone.
⏳ Apex Nearing: Price action is compressing, and breakout pressure is building.
📉 Decreasing Volume: Volume is drying up — a classic precursor to a breakout move.
✅ Bullish Scenario (Breakout):
If LINK breaks above the descending trendline and reclaims resistance around $14.00 – $15.44, the chart could ignite a strong upside move.
🚀 Bullish Targets:
1. $15.44 (first key resistance & breakout validation)
2. $17.44 (prior structure resistance)
3. $19.38 (swing high from Q1)
4. $26.58 (major resistance zone)
5. $28.00 – $29.35 (long-term upside target)
📌 Breakout Confirmation: Look for high volume and a successful retest of the breakout level to confirm bullish momentum.
❌ Bearish Scenario (Breakdown):
If LINK fails to hold the $12.5 – $13.2 support zone and breaks below it with strong volume, downside risks increase significantly.
⚠️ Bearish Targets:
$11.00 (minor support)
$9.50 (next demand zone)
$8.00 (macro support from 2023)
A breakdown from this triangle would invalidate the bullish setup and could trigger a broader bearish continuation.
🧩 Conclusion & Strategy:
📊 Pattern: Descending Triangle
🕰️ Formation Duration: 6+ months (strong reliability)
🟨 Critical Zone: $12.5 – $13.2 = Key Support
📍 Breakout Trigger: Above $15.4
🔍 Breakdown Trigger: Below $12.5
📌 Trading Ideas:
🔼 Long Position: Upon breakout above $15.4 with confirmation
🔽 Short Position: Upon breakdown below $12.5 with increased volume
📚 Bonus Insight:
Chainlink remains one of the most widely adopted oracle solutions in DeFi and enterprise blockchain. A technical breakout from a long-term consolidation like this could attract both retail and institutional capital.
#LINKUSDT #Chainlink #CryptoBreakout #DescendingTriangle #Altseason #TechnicalAnalysis #BullishSetup #CryptoSignals #TradingView #AltcoinSetups
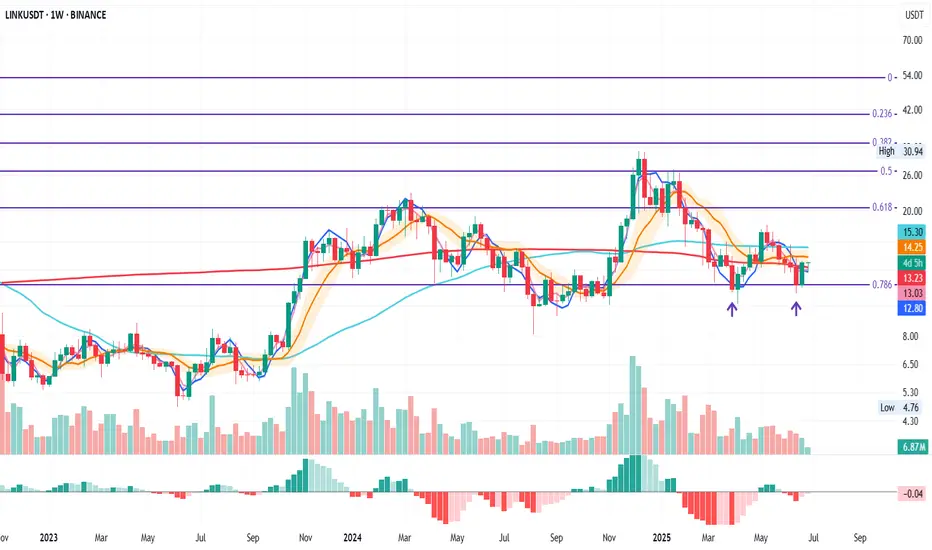
LINK Weekly – Double Bottom Confirmed
LINK on the weekly has confirmed a double bottom formation right at the 0.786 Fib level.
Remember, this Fib level is the last major support — so price is basically at bottom levels.
Last week closed above the weekly 200MA.
The next resistance zone is the BB center line and the 50MA.
If price clears this zone, it could push toward the 0.618 Fib level.
Always take profits and manage risk.
Interaction is welcome.
Chainlink, The Fed, Vanguard, Crypto & Apple"Buy the rumor, sell the fact." The market tends to price-in an event before it happens. I am talking about the reduction in interest rates. The participants are aware that there will be a reduction in interest rates by the Fed and this is bullish and so buying starts to happen much sooner compared to the announcement of the actual event. By the time the event becomes a reality, it is already priced-in. Meaning...
Chainlink is bullish now and the chart is the same as HIVEUSDT, which I shared just now, and many other altcoins. This is good because we know what happens next. If there are other pairs with the same chart but moving up, moving ahead, then we know that these two and all those other staying behind will also follow, makes sense? Sure it does. We are all one. What one does, the rest follows.
Chainlink (LINKUSDT) is set to grow. Easy to see, higher highs and higher lows.
Will the market go up because of the Fed? We can say so before or after the event, right now the only important action is to buy-and-hold. It is important to be fully invested in Crypto, because Crypto is outperforming every other risk-asset in the entire world. You want be in in the market that is about to pay. You don't want to be holding bonds or index funds, that's a huge mistake. You buy these stuff to make money, you can make with Crypto in 6 months what an index fund (Vanguard SPX) will pay in a decade... Do the math, are you a young adult, are you smart? If you are, take action now before it is too late.
Your choice of course. Imagine the people in the 80s investing in Gold rather than Google, Microsoft and Apple... Big mistake.
Namaste.
LINK - Clear Price Action on the Bull Side.Chainlink (LINK) shows strong bullish potential for a swing trade. However, it’s likely to first dip to clear out liquidity at lower levels. Look for a bullish Market Structure Shift (MSS) on the lower timeframe (LTF) to confirm the start of an upward move.
Remember, do not guess. Prepare and React.
Confidence comes from Clarity, not Hope.
Final $LINK in the corrective chain?If you find this information inspiring/helpful, please consider a boost and follow! Any questions or comments, please leave a comment!
LINK could be finishing a double zigzag correction. Recent reaction at the channel’s most likely target area shows promise. Watching for an internal retrace that holds above key support.
Key Levels:
11.81: Ideal retrace floor
11.00: Break kills impulse idea
13.25: First upside flip needed
15.00: Big level to break for bulls
Bulls have been tricked before with possible impulse starts. This one has the right look and confluence, but caution is warranted. Ideally, we get consolidation and push above 13.25 to build confidence in further upside.
As long as price holds above 11.81 and builds higher lows, potential remains for an impulsive move up. Break below 11 and bias flips back to bearish continuation.
Trade Safe!
Trade Clarity!
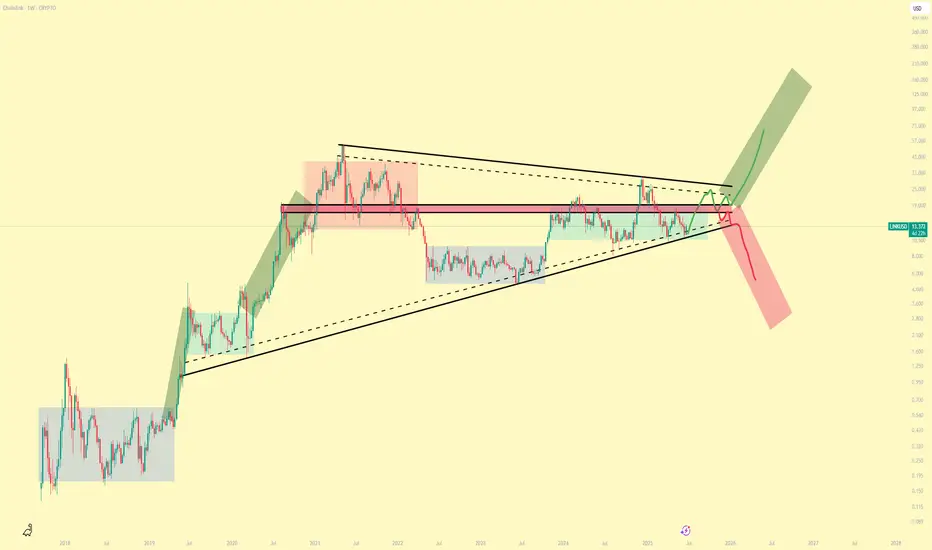
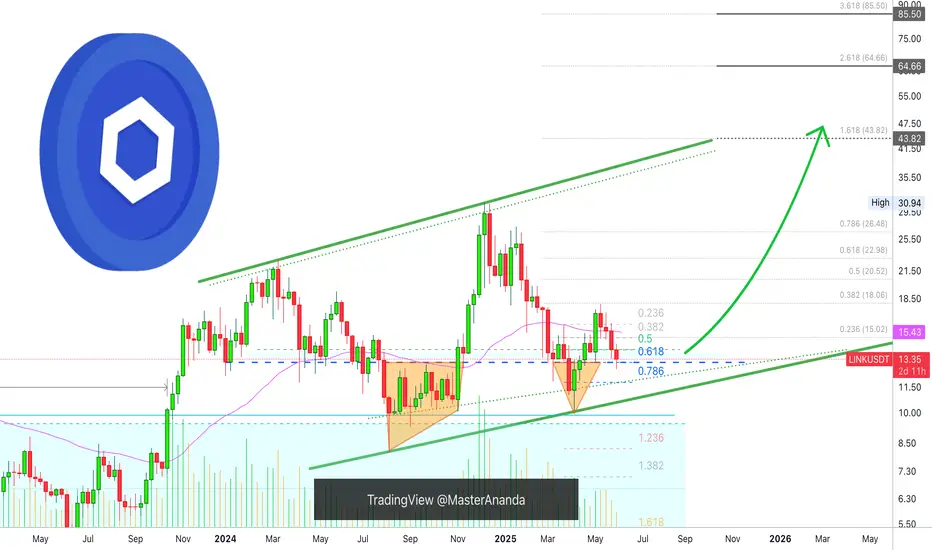
LINKUSD Paths on OfferPretty clear accumulation stages going on and so I am inclined to think we head towards the Bullish path to ~$100
Bears will want to buy LINK at massive discounts and so perhaps we do see some capitulation before our next mark-up phase.
However, the current Total Market cycle patterns, along with the BTC pairing, almost rule out the possibility of further downside, or at least major downside.
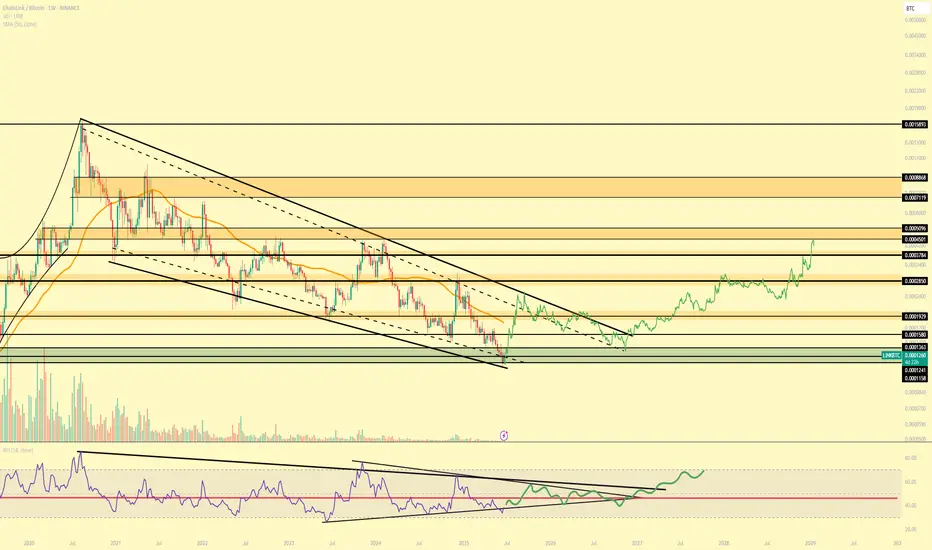
LINK / BTC Looking Juicer Than EverEven if you aren't aware of the fundamentals of LINK adoption & application , the chart speaks for itself.
Would be very surprised is LINK isn't bottoming out here and all it needs is a bit of sideways before we get some expansion and mark-up.
LINk/USDTFor the Link currency, I feel that this decline is continuing and it is continuing to decline step by step. The chart was not readable. Tell me your opinion.

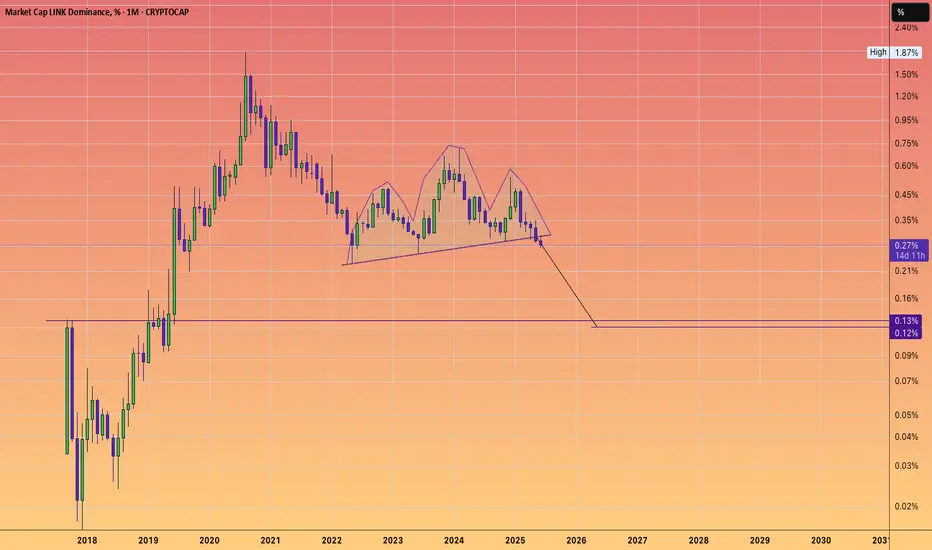
LINK MARINES are becoming a dwindling force.It was likely a fabricated tag solely for Crypto Twitter, conceived by early ICO investors. Something to rally a war cry behind.
Similar to the LINK Crypto dominance chart.
There’s a continuation head & shoulders pattern with a logarithmic target indicated.
Indeed, the token might increase in dollar value.
However, with 700 employees to compensate through token sales,
The salaries are excessive given the stagnant growth of token holders, and I must say, the decline in holders over the years makes it difficult to sustain the price/valuations.
If a #DEFI season was to occur, I would probably take advantage and unload old bags into the pumps.
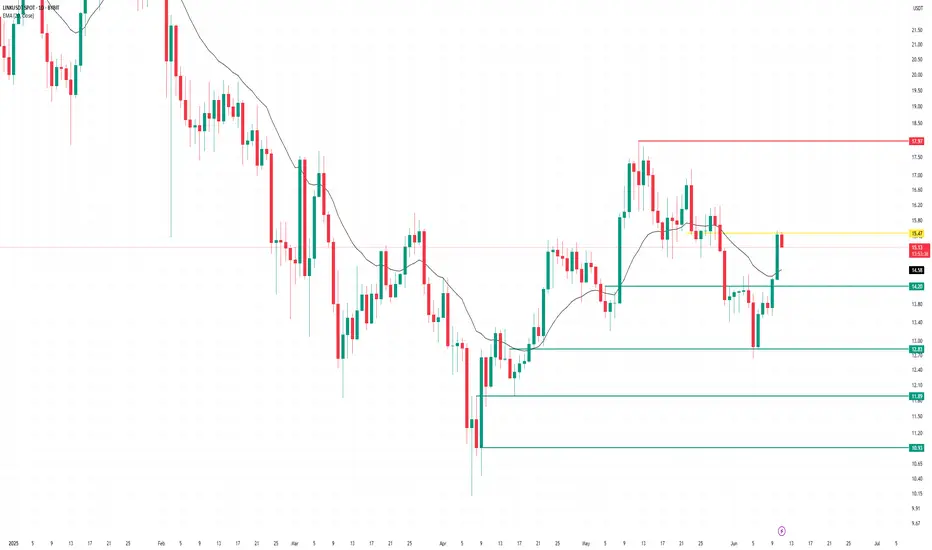
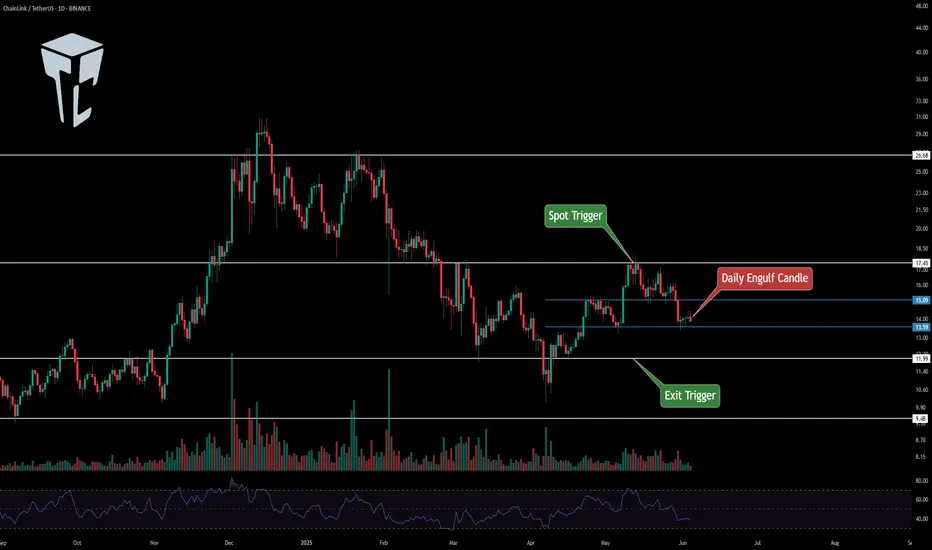
link updateentry price 15.48
stop loss 15.48
take profit
11.9
10.95
we hit first and second take profit
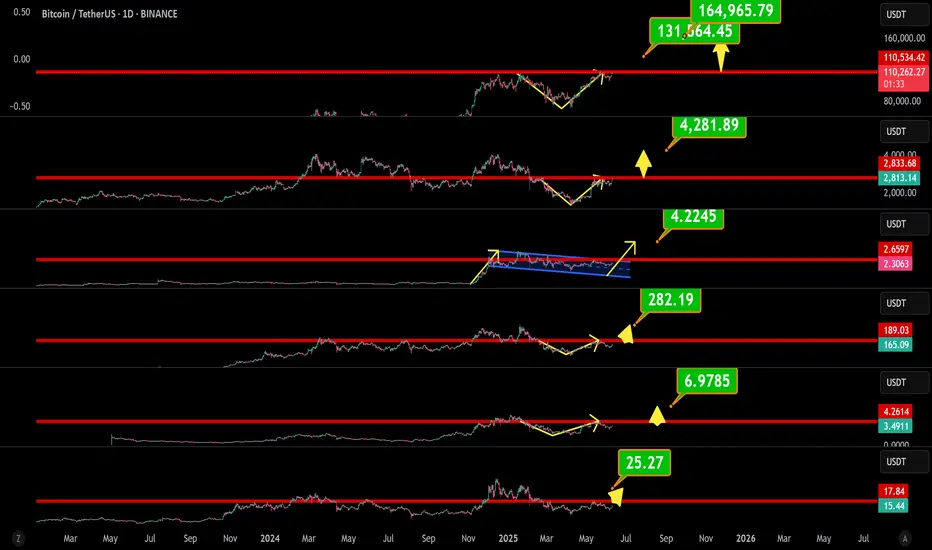
Is Bitcoin Ready to Launch? In-Depth Analysis of BTC, ETH, XRP, Hello everyone, I hope you're doing well.
Due to time constraints, I won't be analyzing each asset individually. Instead, I’ll provide a collective technical overview in this post.
This analysis includes the following cryptocurrencies: **Bitcoin, Ethereum, Ripple, Solana, Sui, and Chainlink**.
⚠️ **Please note:** On the **daily timeframe**, most of these assets are forming different patterns. However, the **weekly timeframe** provides a clearer and more reliable outlook.
---
### 🔍 **Technical Overview:**
📌 **Bitcoin (BTC)**
Currently forming a **"V" pattern**.
If BTC closes **above \$110,500 on the weekly timeframe**, the first target is **\$131,500**, and the second target is **\$165,000**.
📌 **Ethereum (ETH)**
Also in a **"V" pattern**.
If ETH closes **above \$2,833 on the weekly timeframe**, the first target is **\$4,200**.
📌 **Ripple (XRP)**
Forming a **bullish flag** pattern.
If XRP closes **above \$2.65 on the weekly timeframe**, the first target is **\$4.22**.
📌 **Solana (SOL)**
Forming a **"V" pattern**.
If SOL closes **above \$190 weekly**, the first target is **\$282**.
📌 **Sui (SUI)**
Also forming a **"V" pattern**.
If SUI closes **above \$4.26 weekly**, the first target is **\$6.97**.
📌 **Chainlink (LINK)**
Needs a **weekly close above \$18** to confirm breakout.
First target: **\$25**.
---
### 🧠 **Brief Fundamental Insights:**
* **Bitcoin** is being heavily accumulated by institutional investors and whales. On-chain metrics suggest we are **not at a cycle top**, and the ongoing **supply shock** and **massive exchange outflows** are strong bullish signs.
* **Ethereum** is under **strong accumulation** from both retail and institutional investors, as confirmed by recent **CoinShares reports**.
* **Ripple** is awaiting resolution of its ongoing lawsuit with the **SEC**.
* **Sui** is consistently rolling out updates and shows **unstoppable DeFi ecosystem growth**, giving it strong fundamental support.
* **Solana** is being accumulated by institutional players, including **SOL-specific strategies** and funds.
* **Chainlink** is seeing buying pressure supported by **positive news and strategic partnerships**, some of which are from **anonymous large players**.
---
🧠 Updated Fundamental Analysis (June 2025)
Bitcoin (BTC)
New Investment Record: In May, total investments in crypto funds reached $167 billion, with Bitcoin accounting for $5.5 billion, signaling strong institutional demand.
Institutional Buying Surge: ETF purchases, entries by institutions like Paris Saint Germain, and even countries like Pakistan have contributed to declining exchange reserves of Bitcoin.
Favorable Macro Conditions: Rising bond yields, stock market volatility, and a weakening U.S. dollar have made Bitcoin more attractive as a hedge asset.
Ethereum (ETH)
Consistent Inflows: Ethereum funds have seen seven consecutive weeks of capital inflows, with nearly $296 million added in the past week alone.
Institutional Confidence: Assets under management (AUM) in ETH funds have reached approximately $14 billion, indicating strong long-term faith by institutions.
Solana (SOL)
Strong Institutional Demand: Firms like Société Générale and Siebert Financial have recently invested in Solana.
On the Verge of ETF Approval: Franklin Templeton filed for a spot Solana ETF back in February, potentially boosting demand.
Whale & DeFi Growth: Increased whale activity, growing DeFi ecosystem, and rising developer engagement hint at a potential price rally to $200 and beyond.
Ripple (XRP)
While there is no major new fundamental data recently, the listing of XRP futures on CME and broader access for institutional investors may have a positive impact.
The ongoing legal case with the SEC remains a crucial factor in XRP’s future outlook.
Sui (SUI)
DeFi Expansion: Active daily users have grown by over 14%, and decentralized exchange volume has reached around $34 million per day.
TVL Growth: Suilend’s Total Value Locked (TVL) has hit $700 million, ranking 8th among all blockchains.
Institutional Attention: There are reports suggesting that an ETF for SUI may be under consideration, with on-chain utility continuing to expand.
Chainlink (LINK)
Collaboration with Major Financial Institutions: Chainlink is participating in CBDC pilots between Hong Kong and Australia, working with Visa, ANZ, and the Hong Kong Monetary Authority.
Ecosystem Growth: Development is supported via grants, like the $150K funding provided to Lightchain AI, strengthening Chainlink’s infrastructure.
Strategic Partnerships: Collaborations with JPMorgan, Ondo Finance, and Swift highlight Chainlink’s growing influence in connecting real-world data to blockchains.
LINK Bulls Building Toward a Chain ReactionIf you find this information inspiring/helpful, please consider a boost and follow! Any questions or comments, please leave a comment!
LINK just gave us a clean reaction out of an identified box. Bulls may finally be gaining control and a trend shift up is on the table.
We had eyes on this box for a potential reaction. The market delivered. Now bulls need to prove they can build on it. The first key is to defend 13.284. As long as this level holds, the case for a higher trend remains alive.
Next, bulls need to clear 14.47. That is the first smaller degree LH that must be taken out to confirm that buyers are pushing through the structure.
The big step remains 15.00. This has acted as a major flipping level. A true test for the bulls will be whether they can reclaim and hold above it. If they do, the door opens for stronger upside follow through.
The path is clear:
💥 Hold 13.284
💥 Break 14.47
💥 Reclaim 15.00
We will continue to track this closely with the Elliott Scanner mindset. If momentum picks up through these levels, this could become an attractive higher-degree setup.
Watch these levels carefully. Bulls have work to do, but the ingredients for a shift are building.
Trade Safe!
Trade Clarity!
Chainlink Support Remains Intact, Short-Term Noise (10X)Notice here Chainlink on the weekly timeframe. This week wicked below our strong support on the chart marked by a blue dashed line, this level is the 0.618 Fib. retracement ratio. The baseline of the v shaped bottom and also the bottom formation of 2024.
The retrace, bearish action, so far has been going for four straight weeks. The entire rise was five weeks longs. I mentioned this previously. This means you can easily go ALL-IN on this type of chart setup, buy and hold.
The retrace can never be longer than the drop. The fact that support is holding means that Chainlink will continue growing, will resume its bullish wave. A bullish continuation.
This is a friendly reminder. I know it is hard, but this type of setup is where experts open LONG with 10X. I am not saying that you should, I just want to show you how we are attracted to and tempted to buy when the market is red. That's the time to go LONG. We sell (SHORT) when the market is green.
Thank you for reading.
Namaste.
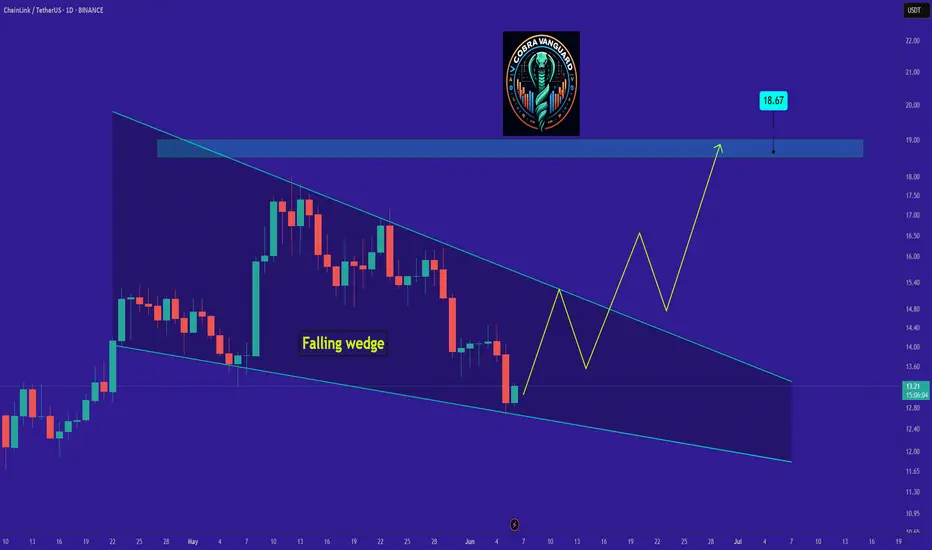
LINK's situation+ Target PredictionSo if you pay attention to the LINK chart you can see that the price has formed a Ascending wedge which means it is expected to price move as equal as the measured price movement.( AB=CD )
NOTE: wait for break of the WEDGE .
Give me some energy !!
✨We spend hours finding potential opportunities and writing useful ideas, we would be happy if you support us.
Best regards CobraVanguard.💚
_ _ _ _ __ _ _ _ _ _ _ _ _ _ _ _ _ _ _ _ _ _ _ _ _ _ _ _ _ _ _ _
✅Thank you, and for more ideas, hit ❤️Like❤️ and 🌟Follow🌟!
⚠️Things can change...
The markets are always changing and even with all these signals, the market changes tend to be strong and fast!!
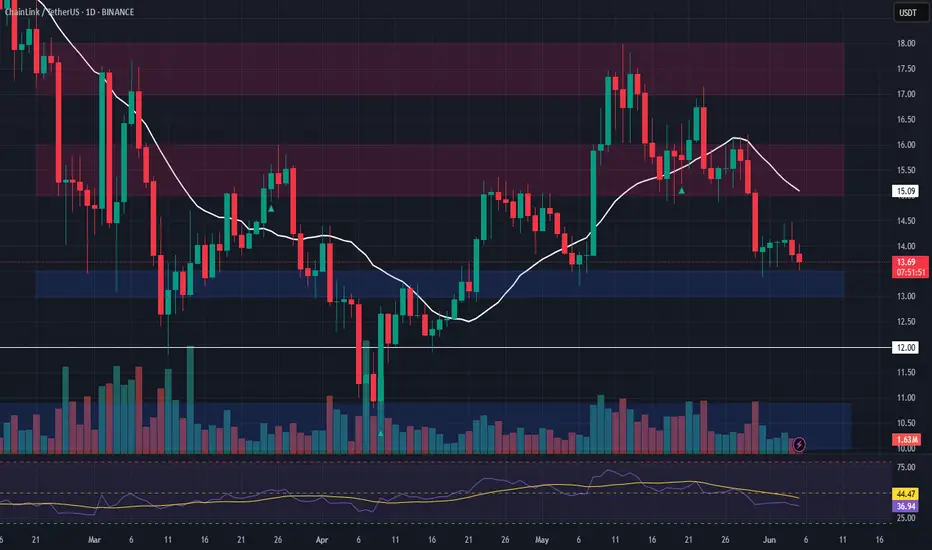
LINK Long Setup – Retrace to Key Support After Strong RallyLINK saw a strong rally from April to mid-May, and is now undergoing a healthy retracement. Price is approaching the $13.00–$13.50 support zone, offering a potential long spot entry as the market cools.
📌 Trade Setup:
• Entry Zone: $13.00 – $13.50
• Take Profit Targets:
o 🥇 $15.00 – $16.00
o 🥈 $17.00 – $18.00
• Stop Loss: Daily close below $12.00
TradeCityPro | LINKUSDT Chart Primed for a Big Move! 👋 Welcome to TradeCityPro Channel!
Let’s dive into analyzing one of the market’s most popular coins, LINK, which continues to hold its key supports in higher timeframes and is poised for strong moves during a market uptrend.
🌐 Overview Bitcoin
Before starting the analysis, I want to remind you again that we moved the Bitcoin analysis section from the analysis section to a separate analysis at your request, so that we can discuss the status of Bitcoin in more detail every day and analyze its charts and dominances together.
This is the general analysis of Bitcoin dominance, which we promised you in the analysis to analyze separately and analyze it for you in longer time frames.
📊 Weekly Timeframe
On the weekly timeframe, LINK has been one of the cryptocurrencies that remained in a range for 500 days. After breaking out, we have seen the beginning of an uptrend.
This is exactly what I mean by avoiding capital lock-up. We waited weeks for the 8.06 trigger to break, allowing us to buy with momentum confirmation rather than buying inside the range and waiting in a high-risk market.
You might say, "Why not buy inside the range to avoid missing the 8.06 breakout?" My answer is that hundreds of coins are still stuck in similar ranges without showing any bullish moves, and even now, they could trap your capital for a long time, causing frustration!
Currently, we can say that after a price rejection at 18.10, we’ve pulled back, and if selling volume increases, we’ll go to test the 9.06 level, but if we form a higher low, we’ve created a good trigger for a buy!
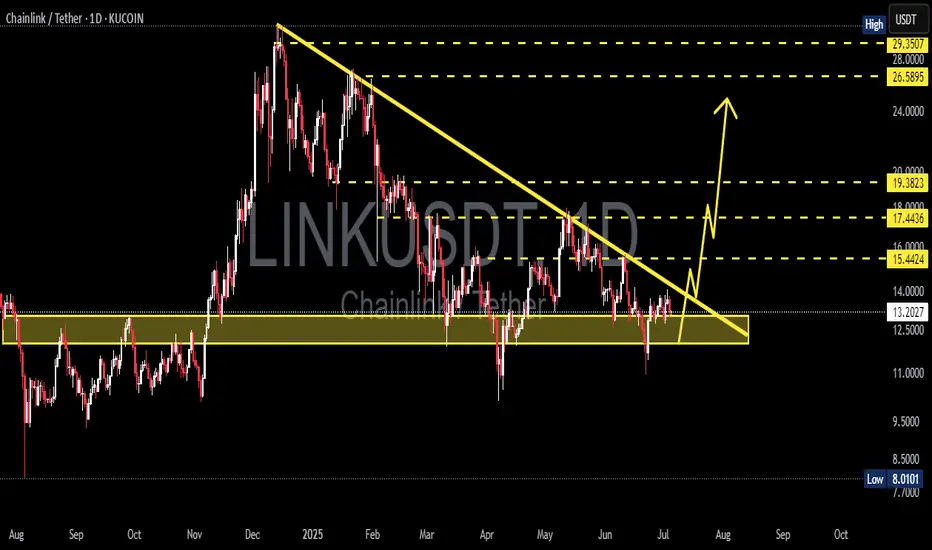
📈 Daily Timeframe
On the daily timeframe, LINK is one of the few cryptocurrencies that, after recent corrections, did not return to lower levels. Instead, it bounced off the 0.382 Fibonacci level, increasing the bullish bias.
After breaking 12.96, LINK had a strong rally up to 29.07, where resistance was observed.
Instead of considering 29.07 as resistance, I prefer to buy after a breakout of 26, as this level was previously a pullback zone and had multiple rejections.
On the daily timeframe, we’ve also been rejected from a strong resistance, which further emphasizes the importance of this daily resistance, and it’s better to say that as long as we’re above the 11.99 support level, the 17.45 resistance will be the best trigger for a spot buy and our entry!
📝 Final Thoughts
Stay calm, trade wisely, and let's capture the market's best opportunities!
This analysis reflects our opinions and is not financial advice.
Share your thoughts in the comments, and don’t forget to share this analysis with your friends! ❤️
Chainlink Next Move Now Imminent, Strong Setup (8X)I still think that Chainlink has a strong chart setup that can start moving any time without warning.
The rise from 7-April lasted only six weeks and later the retrace lasted 3 weeks. That's 50% of the time. The sixth week that produced the peak was also a red week. When a pair is about to start moving, this is already a strong enough retrace. Three weeks out of a total of eight would be a perfect retrace, both are fibonacci numbers.
The retrace pierced the 0.5 Fib. retracement level and started to recover right above 0.618. The last candle close happened above 0.5. In short, this is perfect bullish price dynamics.
What's more, the short-term 0.618 Fib. retracement level here also marks the breakdown and recovery from July-November 2024. Back then we had a long bottom pattern and this time a short-term one. Another perfect pattern and classic; Elliotts law of alternation.
We have a good one here. I think Chainlink can be a win for us but only time will tell of course.
I thank you for reading.
First leave a comment and then follow.
Thanks a lot for your continued support.
Namaste.
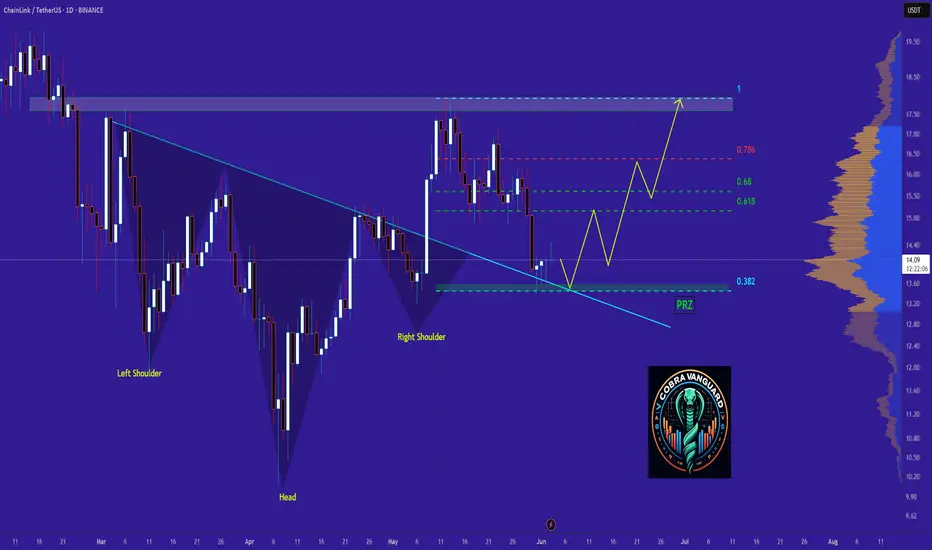
LINK It has good growth potential in midtermWhat I see now is that the price could correct to the PRZ and then pump again, and currently, there is no specific bullish pattern in the chart. which could cause the price to drop below 13.5 dollars.
Best regards CobraVanguard.💚
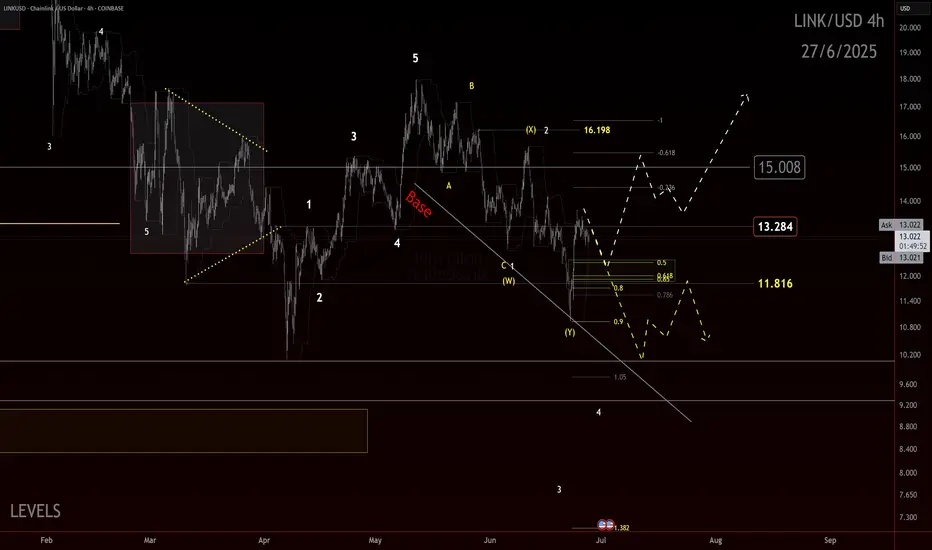
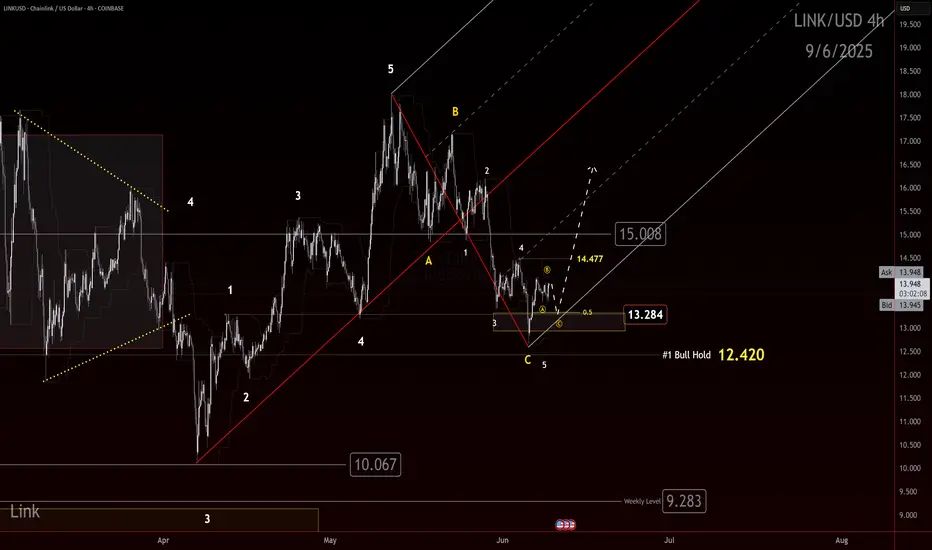
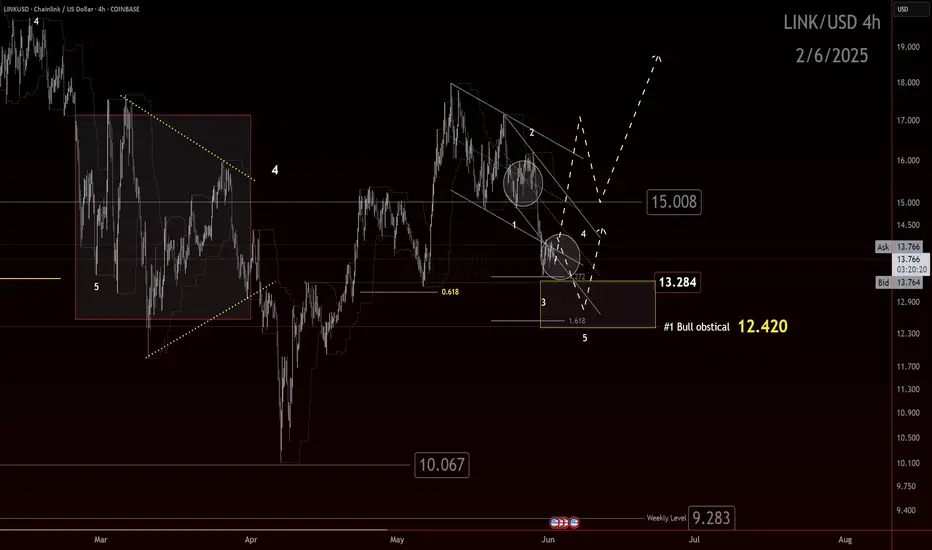
Link Correction complete? CRYPTOCAP:LINK Correction Nearing Completion? Key Levels to Watch
Recap
CRYPTOCAP:LINK continues to retrace and lose levels. Price action looks a bit incomplete on the Elliott wave side, but technicals suggest the retracement may be nearing its end.
The Setup
The cleanest scenario would see price make one more leg down into the 12.42 area. That level offers symmetry and structural balance for a completed correction.
If instead price breaks above 15.008, it opens the door for the correction to be considered complete. Still, confirmation would require a strong reaction from that move—not just a quick wick.
The Outlook
A defense of 12.42 would keep the bullish scenario alive. A break below that level, however, would weaken the outlook and raise the probability of an extended correction or trend continuation lower. Namely an impulsive move down. Right now, we have a potential correction, we need the PA to provide proof of what we have. Wave 4s and 5s at matching degrees as what has printed are need to prove an impulse and an invalidation will prove otherwise.
For now, the focus remains on reactions at these two levels. Watch closely— CRYPTOCAP:LINK could be setting up its next directional move.
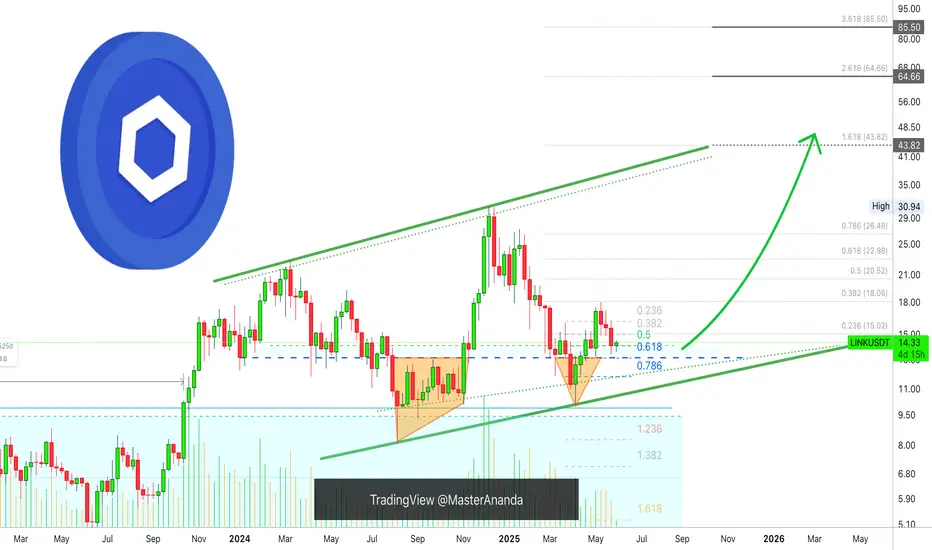
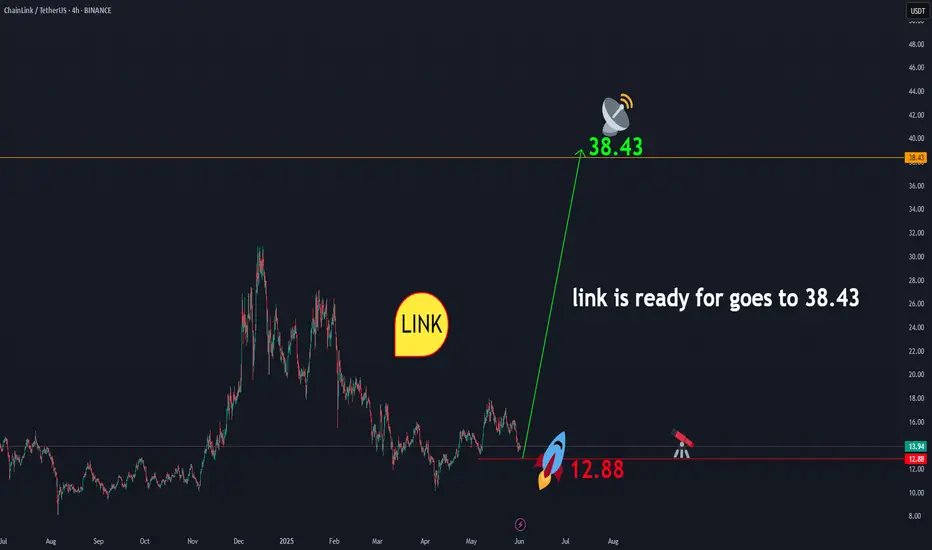
linkusdtLINK is showing readiness to initiate an upward movement towards $38.43. From the current price range of $13.93, a correction down to the $12 area is possible. This zone presents a favorable opportunity for long-term investment . In any case, according to the geometry that has formed in LINK, the price level of $38.43 is expected to be achieved. And this is certain.
BINANCE:LINKUSDT
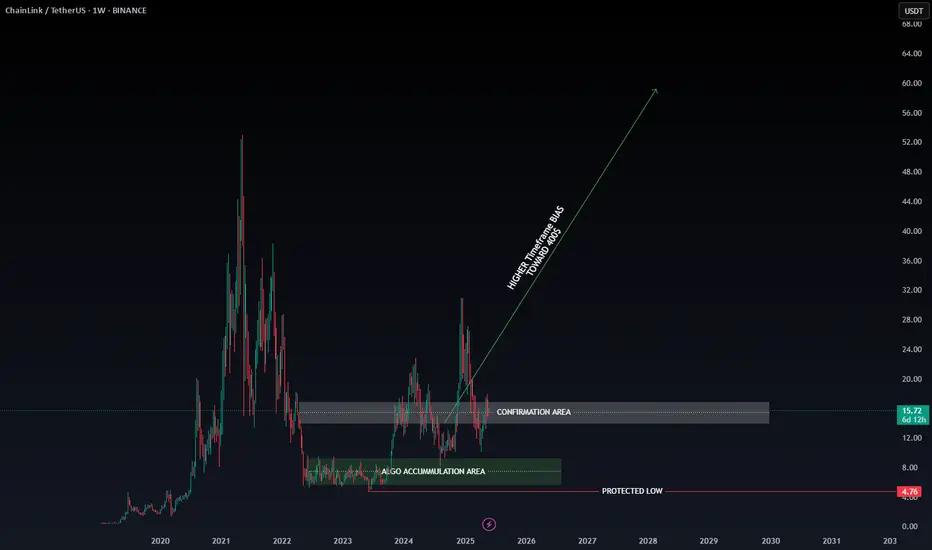
Winter Is Coming — And LINK Is Leading the Charge (x25) Chainlink acts as a bridge between blockchain and the real world.
This asset has been on our radar for years, silently building strength. Its fundamentals are rock-solid, and the current price action is highly favorable for a strategic buy.
📈 On November 12, 2023, LINK officially confirmed its journey to $400 by breaking through our algorithmic confirmation zone. Since then, it’s shown a modest price increase… and right now, it's retesting one of the best buy zones we've seen.
But here's the catch:
In the coming weeks, we expect explosive rallies — the kind that won’t allow for optimal entries anymore.
✅ We are currently positioned long on LINK, and it’s proving to be one of our strongest investments to date.
And remember:
The assets we publish on TradingView have already confirmed their trajectory toward our predicted targets.
🎬Not even Trump... not even a world war could stop what’s coming.
🚀 Buckle up... because winter is coming.
And LINK is ready to lead the storm.
🔍 Disclaimer: This is our personal analysis and not financial advice. Always do your own research before making any investment decisions.
💬 What’s your take on this? Drop your thoughts in the comments and feel free to share this with your friends! ❤️