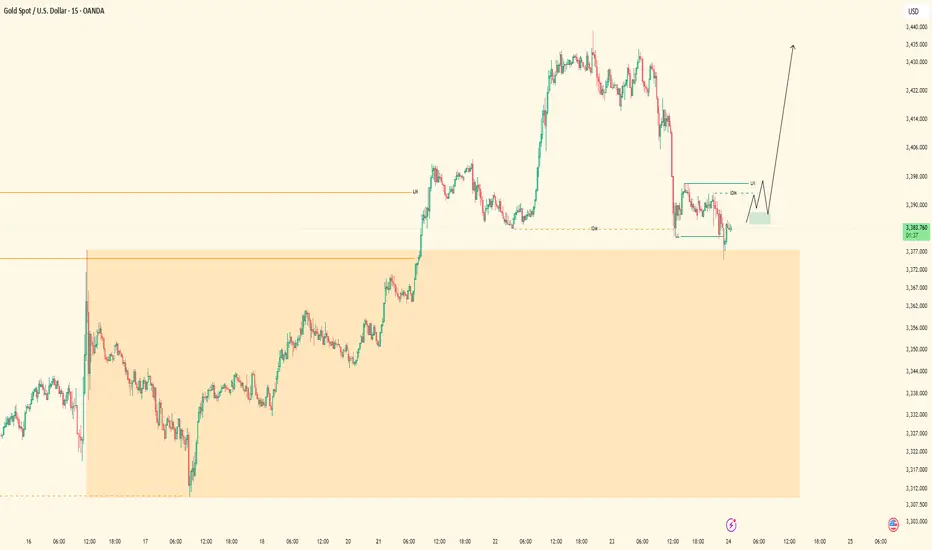
XAUUSD Locked In| Waiting for 5M OB SparkPair: XAUUSD (Gold)
Bias: Bullish
Timeframes: 30M / 5M
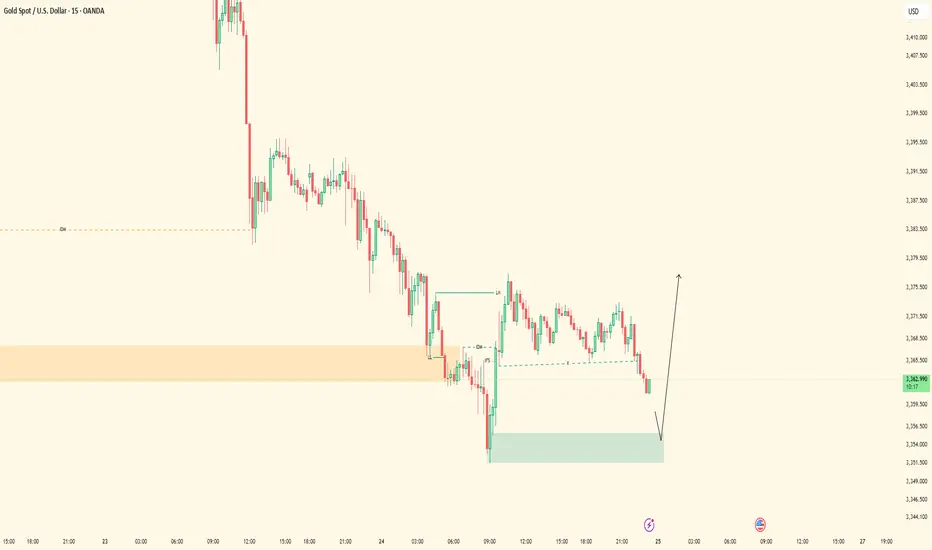
Gold has followed structure beautifully — top-down alignment from 30M into 5M is clear. Price respected the 30M OB and showed intent, but now we’re approaching the moment of truth.
I’m watching the 5M OB for entry — this is where execution mode activates. No rush. I’m in analysis mode right now, but the shift is coming.
Entry zone is mapped, structure’s in place, order flow is aligned — all I need now is price to do what it always does: respect the blueprint.
Entry Zone: 5M OB
Target: 5M highs
Mindset Note: Patience before the spark. I don’t force entries — I wait for the market to hand me the move it already hinted at. ⚡️
Liquidity
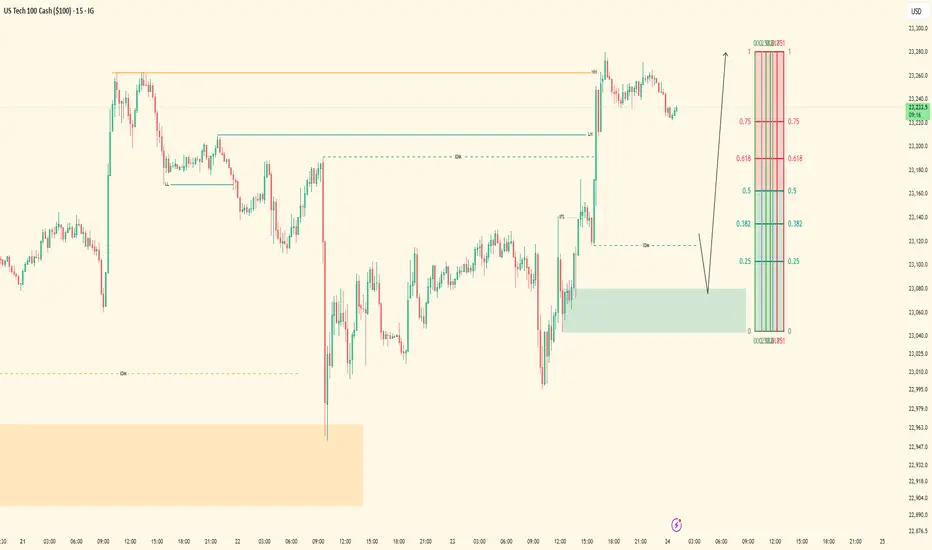
Nasdaq Bullish Flow | 5M OB Execution PendingPair: NAS100
Bias: Bullish
Timeframes: 30M / 5M
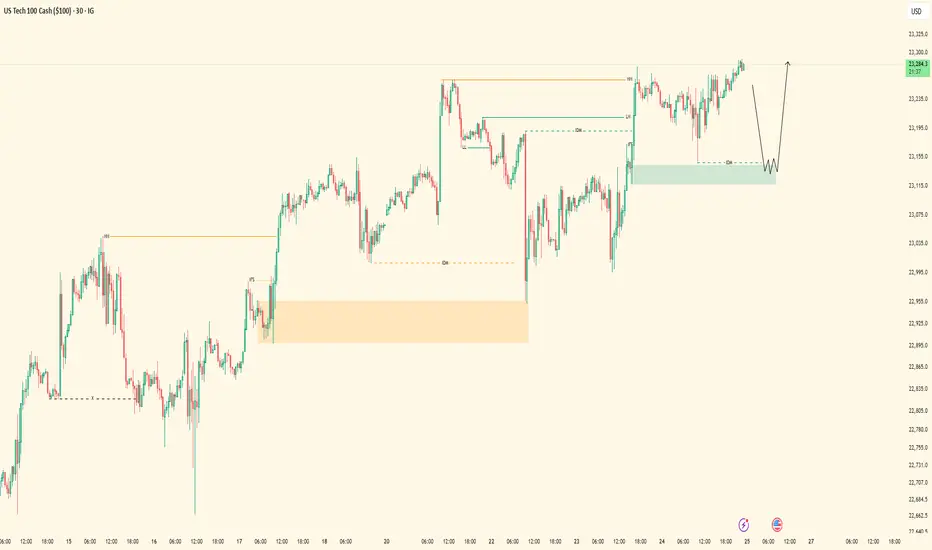
Price remains heavy bullish — structure aligning perfectly across the board. Ever since the 30M OB was mitigated, I’ve been following Nasdaq’s order flow step-by-step.
I was watching for full-bodied confirmations inside the 30M zone, but instead, price gave clarity through the lower timeframes. That 5M flip gave away smart money’s intent — showing me exactly where accumulation is happening.
Now waiting for price to tap into the 5M OB to shift into execution mode. This setup has been mapped with precision — no guessing. Once entry presents itself, I’ll follow through.
Entry Zone: 5M OB
Target: 5M highs
Mindset Note: Still in analysis mode — patience until price hits my zone. Smart money doesn’t rush, it accumulates. So do I. 💼
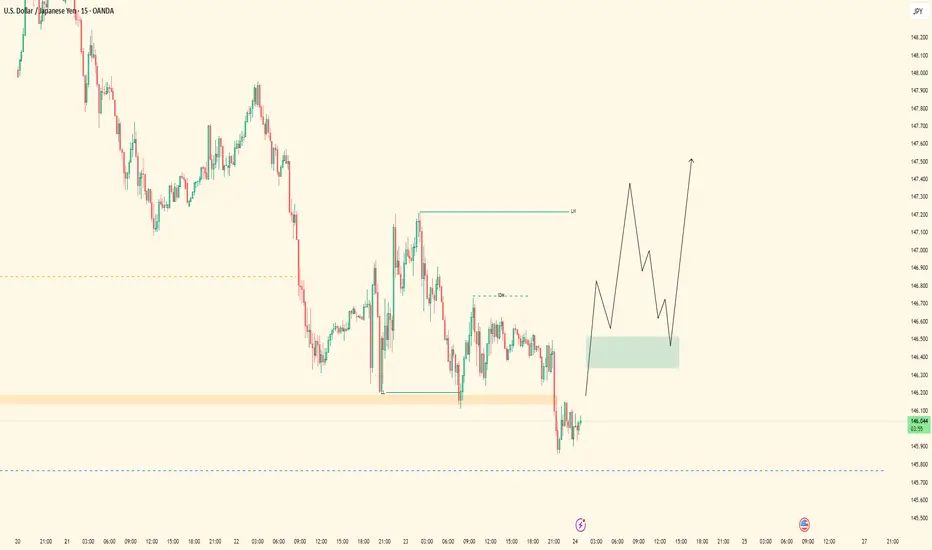
UJ Exexcution Flow| 5M OB Setup in MotionPair: USDJPY
Bias: Bullish
Timeframes: 30M / 5M
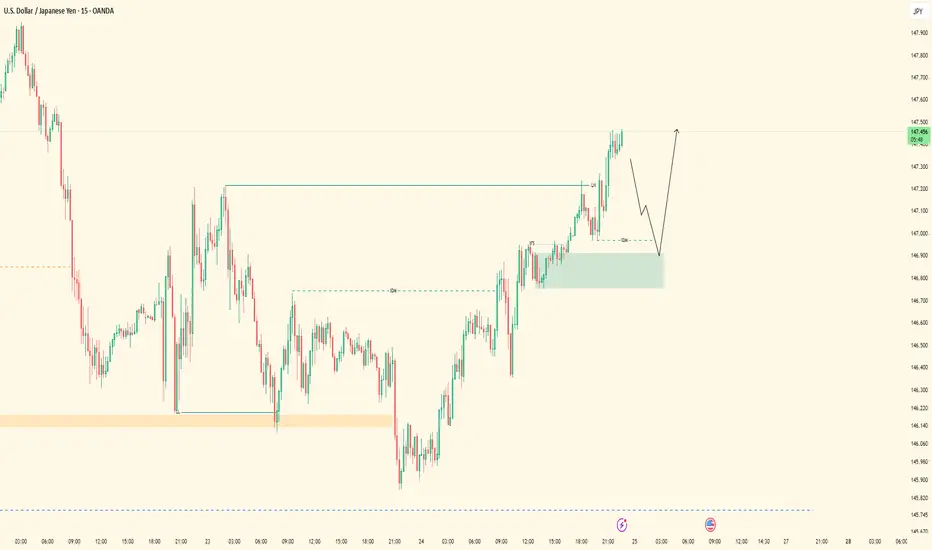
Top-down structure respected cleanly across the board — from HTF to LTF, price has been flowing exactly as forecasted. After confirming the bearish LH break and structure flip, we’re now in a bullish leg with intent clearly shown on the lower timeframes.
Currently waiting for price to mitigate the marked 5M order block for precise execution. Entry is valid and backed by structural logic — no guessing, just following what price has already confirmed.
Entry Zone: 5M OB (confirmed after LH break + LTF intent) Target: Clean 5M highs
Mindset Note: Analysis mode done. Execution mode engaged. I let price lead — I just follow structure.
Welcome Back! Gold Trading Strategy & Key Zones to WatchIn this week’s welcome back video, I’m breaking down my updated approach to XAU/USD and how I plan to tackle the Gold markets in the coming days. After taking a short break, I’m back with fresh eyes and refined focus.
We’ll review current market structure, identify key liquidity zones, and outline the scenarios I’m watching for potential entries. Whether you’re day trading or swing trading gold, this breakdown will help you frame your week with clarity and confidence.
📌 Covered in this video:
My refreshed trading mindset after a break
Key support/resistance and liquidity zones
Market structure insights and setup conditions
What I’ll personally avoid this week
The “trap zones” that might catch retail traders off guard
🧠 Let’s focus on process over profits — welcome back, and let’s get to work.

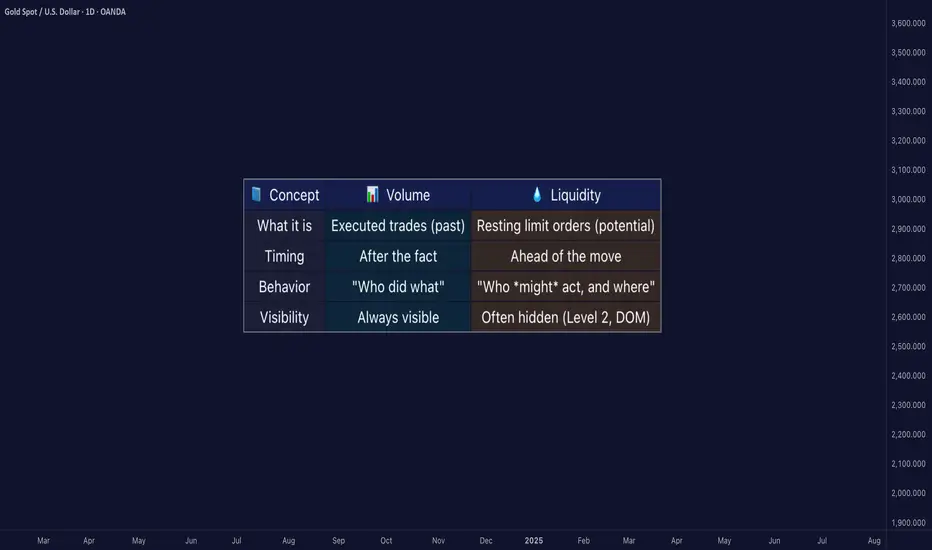
Liquidity ≠ Volume: The Truth Most Traders Never Learn█ Liquidity ≠ Volume: The Truth Most Traders Never Learn
Most traders obsess over volume bars, but volume is the footprint, not the path forward.
If you’ve ever seen price explode with no volume or fail despite strong volume, you’ve witnessed liquidity in action.
█ Here’s what you need to know
⚪ Volume Is Reactive — Liquidity Is Predictive
Volume tells you what happened.
Liquidity tells you what can happen.
█ Scenario 1: Price Jumps on Low Volume
❝ A price can jump on low volume if no liquidity exists above.❞
⚪ What’s happening?
The order book is thin above the current price (i.e., few or no sellers).
Even a small market buy order clears out available asks and pushes price up multiple levels.
Volume is low, but the impact is high because there’s no resistance.
⚪ Implication:
This is called a liquidity vacuum.
It can happen before news, during rebalancing, before session openings, on illiquid instruments, or during off-hours.
Traders often overestimate the strength of the move because they only see the candle, not the absence of offers behind it.
█ Scenario 2: Move Fails on High Volume
❝ A move can fail on high volume if it runs into a wall of offers or bids.❞
⚪ What’s happening?
There’s a strong surge of aggressive buying or selling (high volume).
But the order book has deep liquidity at that level — large resting limit orders.
The aggressive traders can’t chew through the liquidity wall, and price stalls or reverses.
⚪ Implication:
This is called liquidity absorption.
Market makers or institutions may intentionally absorb flow to stop a breakout.
Many retail traders mistake this for “fakeouts,” but it’s really liquidity defending a level.
⚪ What the Research Says
Cont, Stoikov, Talreja (2014): Price responds more to order book imbalance than trade volume.
Bouchaud et al. (2009): Liquidity gaps, not trade size, are what truly move markets.
Hasbrouck (1991): Trades only impact price if they consume liquidity.
Institutions don’t chase candles — they model depth, imbalance, and liquidity resilience.
⚪ Where the Alpha Lives
Liquidity tells you where the market is weak, strong, or vulnerable — before price moves.
Fakeouts happen in thin books.
Reversals occur at hidden walls of liquidity.
Breakouts sustain when liquidity follows the price, not pulls away.
If you understand this, you can:
Enter before volume shows up
Avoid chasing dead breakouts
Fade failed moves into empty space
█ Final Truth
Volume is the echo. Liquidity is the terrain. Alpha is in reading the terrain. You want to study the structure, because price moves toward weakness and away from strength. Learn to see where liquidity is, or where it’s missing, and you’ll see trading with new eyes.
-----------------
Disclaimer
The content provided in my scripts, indicators, ideas, algorithms, and systems is for educational and informational purposes only. It does not constitute financial advice, investment recommendations, or a solicitation to buy or sell any financial instruments. I will not accept liability for any loss or damage, including without limitation any loss of profit, which may arise directly or indirectly from the use of or reliance on such information.
All investments involve risk, and the past performance of a security, industry, sector, market, financial product, trading strategy, backtest, or individual's trading does not guarantee future results or returns. Investors are fully responsible for any investment decisions they make. Such decisions should be based solely on an evaluation of their financial circumstances, investment objectives, risk tolerance, and liquidity needs.
NASDAQ100| - Bullish Bias RemainsPrice didn’t give me the deep candle retrace into my 30M OB — just a wick tap — but that was enough. That wick shows me smart money touched in.
Dropped to the LTF and got my shift in structure confirming bullish intent.
Now I’m locked in, watching for price to sweep a 5M sell-side liquidity pocket into a clean LTF order block for the next entry.
🎯 Target: Short-term 5M highs
🚀 Bias: Still bullish unless structure breaks
This is a patience game now — execution only after confirmation.
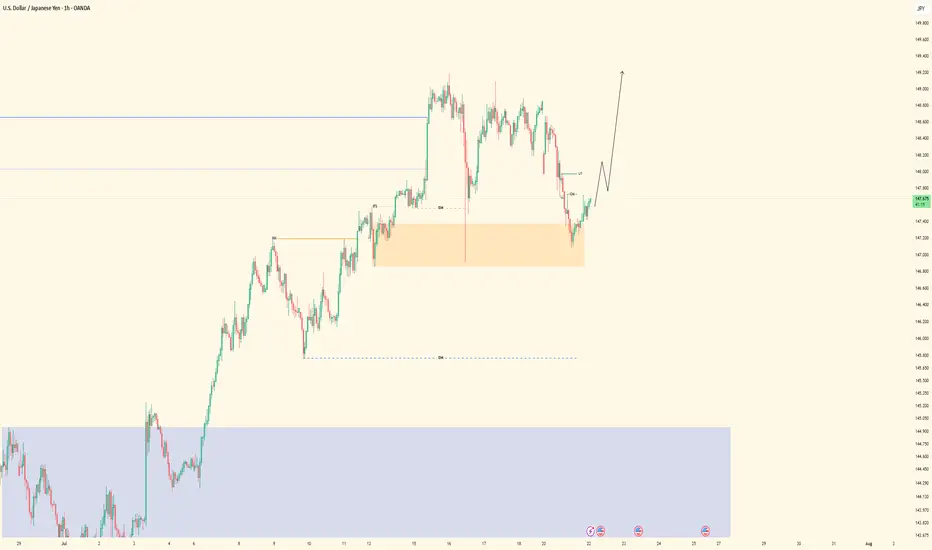
USDJPY| - Bullish Setup Loading30M price action remains heavy to the upside. Structure is intact — no lows invalidated. Currently sitting on a refined 30M order block, I’m patiently watching for price to dip back into the zone and sweep short-term liquidity (SSL).
Once that sweep happens and we pull back into the OB, I’ll be looking to ride the bullish momentum:
🎯 First target: 5M highs
🚀 Final target: 30M highs
Feeling confident — just waiting on smart money to confirm it’s time.
XAUUSD| Smart Money Confirmations LoadingBias: Bullish
HTF Overview: Price has just tapped into the 30-minute order flow zone after clearing out sell-side liquidity. This area aligns cleanly with bullish intent and prior structure.
LTF Focus: Currently waiting for lower timeframe confirmation — ideally a clear CHoCH or internal flip. Once smart money confirms this zone with a shift, I’ll look to enter and ride the momentum.
Target: Initial focus is on the 5-minute highs as a short-term objective. While price could continue toward 30-minute highs, structure suggests the recent 5M high is a more immediate and realistic target, making it a smarter move to secure profit around that level.
Mindset Note: Not in a rush — letting price speak first. The confirmation is what separates a guess from a smart move.
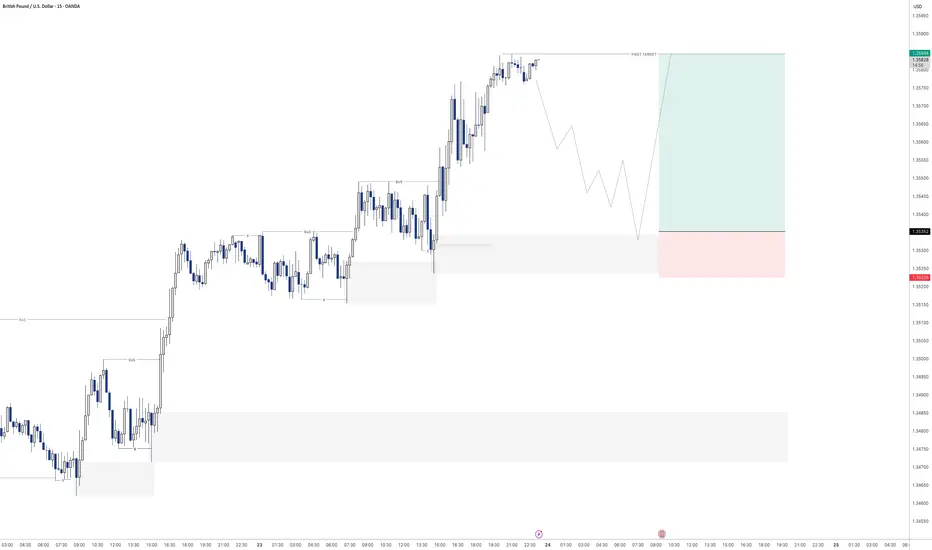
GBPUSD - Next buy from demandLooking here for potential further buying momentum to the upside.
Will see how this plays out tomorrow
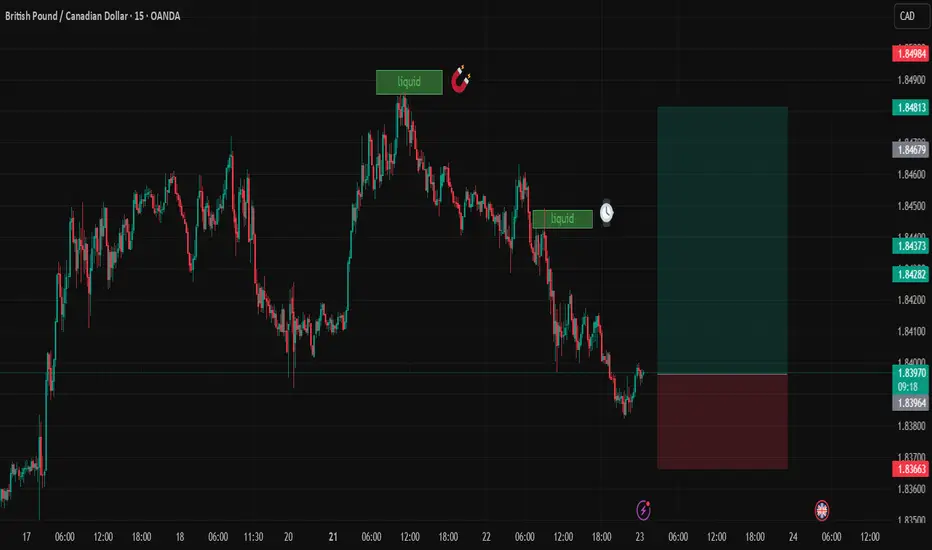
GBPCADDate:
July 23,2025
Session:
Tokyo and London session
Pair:
GBPCAD
Bias:
Long
2 liquidity pools that are waiting to be swept this week. Looks like price is gonna be magnetized towards these levels during London and Tokyo. The trade may even stretch into NYC.
Entry: 1.83970
Stop Loss: 1.83674
Target: 1.84811
RR: 2.82
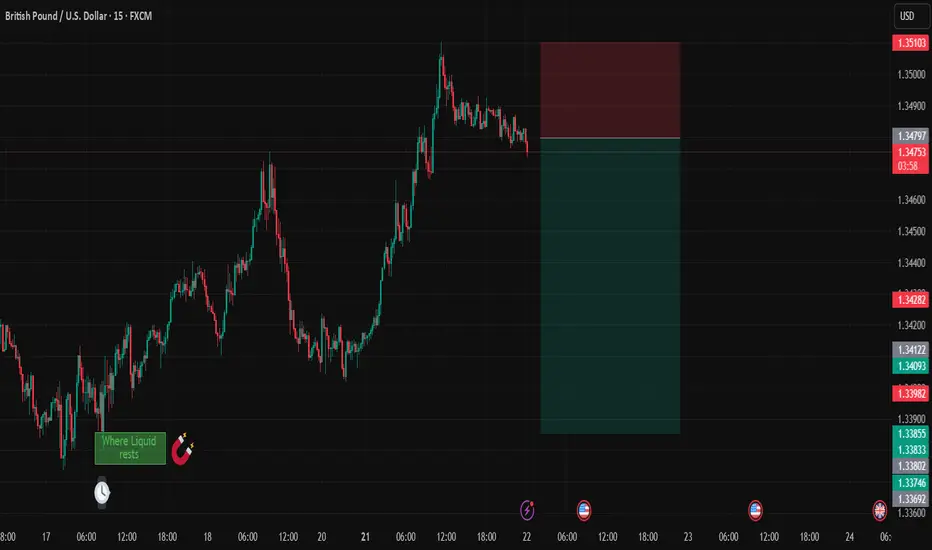
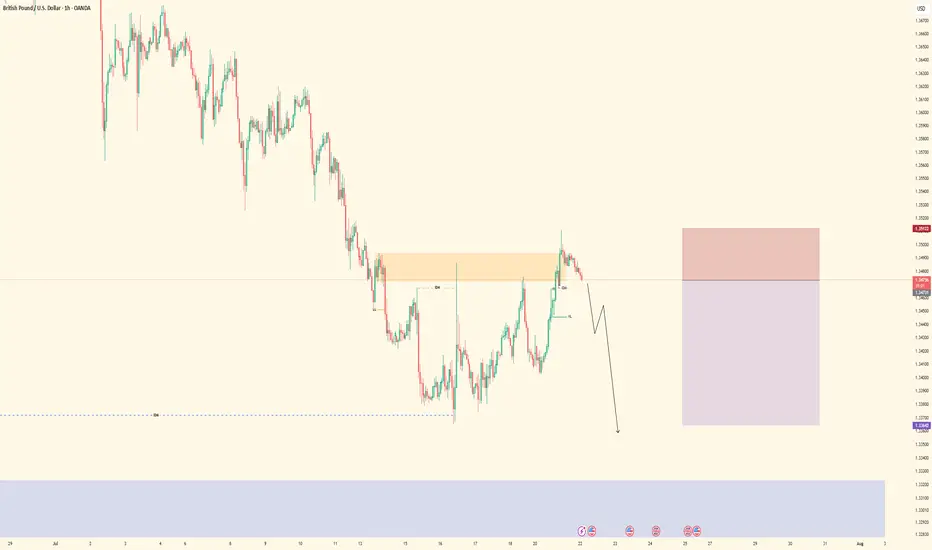
GBPUSDDate:
July 22,2025
Session:
Tokyo and London session
Pair:
GBPUSD
Bias:
Short
Price is setting up to target where liquid rests from last weeks London open on Thursday. Price action shows exhaustion after NYC and London liquidity grab.
Entry:1.34795
Stop Loss:1.35103
Target:1.33853
RR:3.08
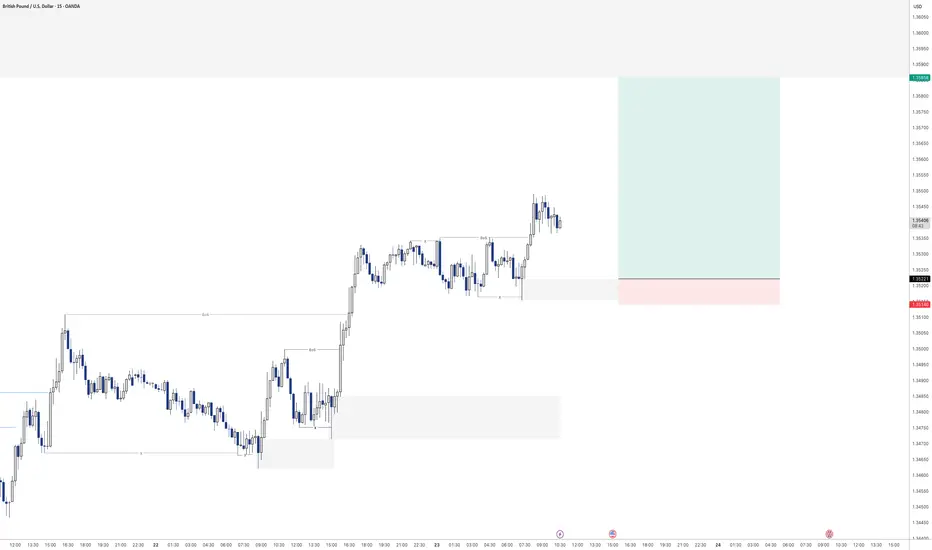
GBPUSD - Buying continuationLooking to keep buying the bullish orderflow on the 15min.
Had a nice sweep of liquidity before creating a new high. Will see how this one plays out over the day
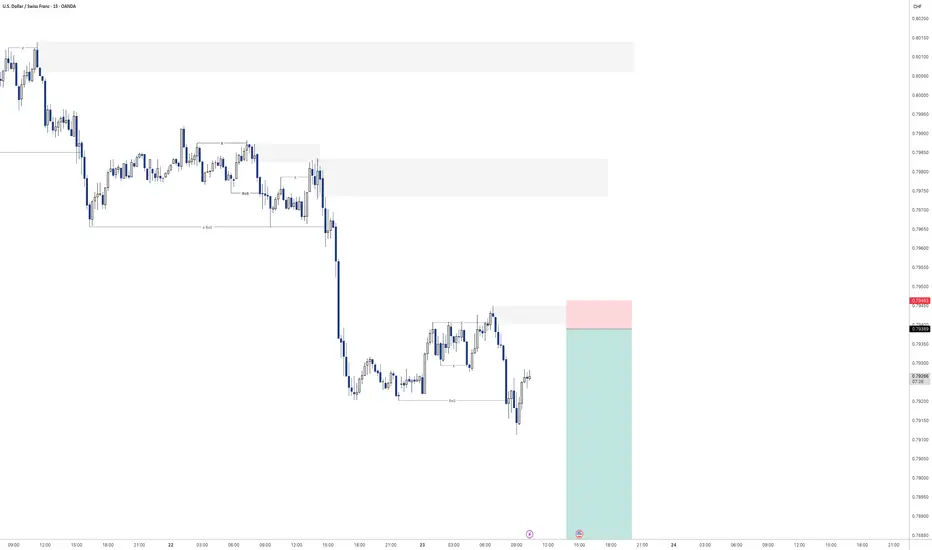
USDCHF - Sell off continuation?Looking for continuation of the selling pressure here on USDCHF
Will see how we play out for the rest of the day
GBPAUD: Liquidity Grab and Fair Value Gap RejectionPrice recently swept liquidity above a key level, grabbing stops resting above that range. Following that, it quickly reversed and left behind a clean Fair Value Gap , suggesting a possible shift in intent.
We are now watching price retrace into the FVG zone. If price reacts from there with a strong bearish confirmation candle like a bearish engulfing or another sign of rejection, we could see a continuation move lower. Our short-term target would be the previous day’s low.
This setup reflects how important it is to wait for confirmation and not chase the first reaction. Let price come to you and show its hand. Patience leads to clarity and better entries.
A trade without confirmation is just a guess. A trade with structure, confluence, and patience is a plan. Stay sharp.

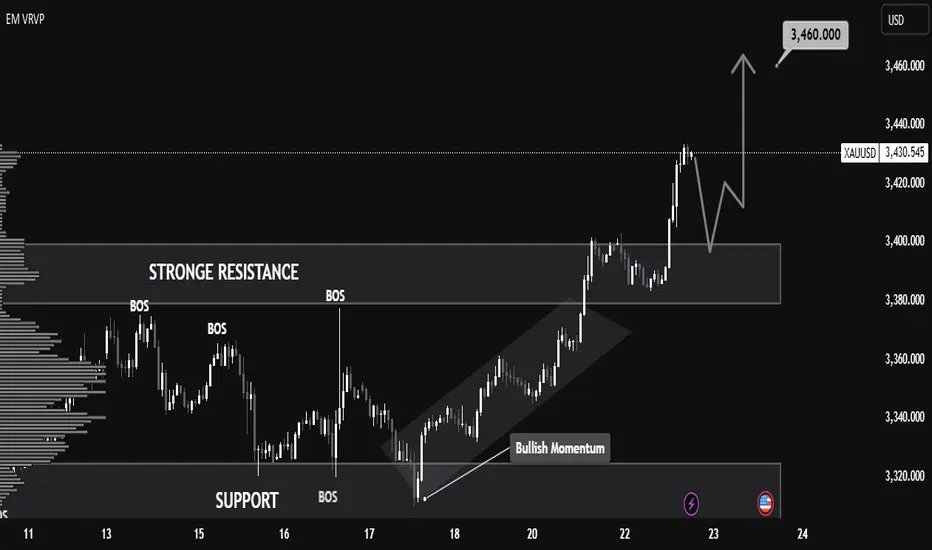
XAUUSD Technical Analysis – Resistance Turned Support, 📈 XAUUSD Technical Analysis – Resistance Turned Support, Bullish Continuation Expected
Gold (XAUUSD) has shown strong bullish momentum after breaking above the key resistance zone around $3,400, which now appears to be acting as a new support level. This structure shift signals a classic break-and-retest scenario, commonly observed in bullish continuations.
🔍 Key Observations:
Structure Shift: Previous resistance near $3,400 has been broken with strong bullish candles, suggesting buyer dominance. This level is now expected to serve as support.
Bullish Momentum: The move from the $3,320 support zone to above $3,430 was accompanied by clear trend formation and clean market structure, indicating sustained momentum.
Retest in Progress: Price is currently pulling back toward the new support zone ($3,400). If this area holds, a bullish reaction is expected.
Next Target: If support at $3,400 holds as expected, price could rally back toward the next resistance and projected target of $3,460.
📚 Educational Insight:
This setup illustrates the principle of resistance becoming support (RBS)—a foundational concept in technical analysis. After a breakout, a successful retest of former resistance often provides a high-probability entry point for trend continuation trades.
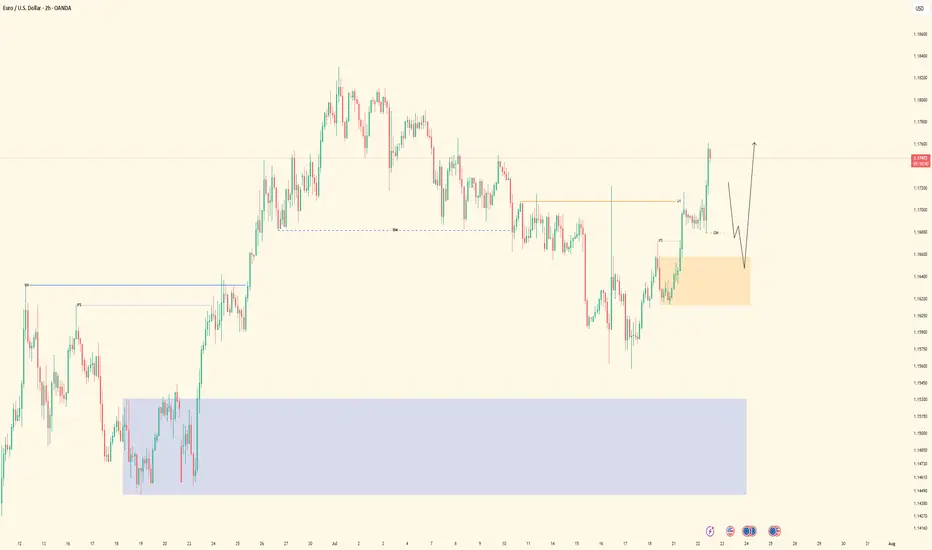
EURUSD| Back Aligned Bullish - Still in Analysis ModePair: EURUSD
Bias: Bullish
Following price closely and adapting to the market’s rhythm.
Recent structure showed that price is still respecting last week’s key zones — so I’ve realigned with the bullish bias accordingly.
No entries yet — still in analysis mode, which honestly is the best part 😉
Watching for clean LTF confirmations before engaging. No guessing. No forcing.
Price always tells the truth — you just gotta stay patient enough to listen.
#EURUSD #SMC #bullishbias #marketstructure #inducementking #smartmoneyflow
Bless Trading!
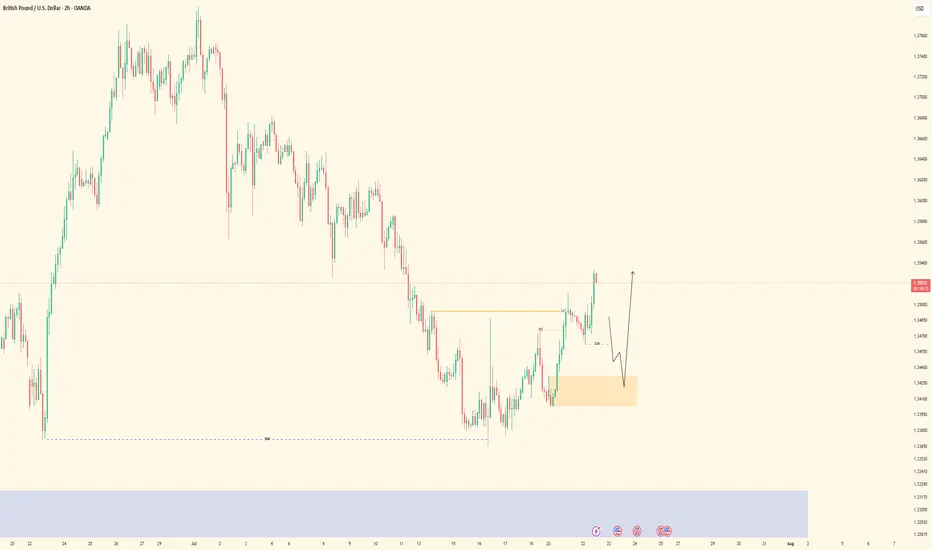
GBPUSD| Bullish Structure Intact - Waiting on BSL SweepPair: GBPUSD
Bias: Bullish
Been following price closely while staying in analysis mode — no rush.
Recent structure remains intact and aligned to the upside. Now waiting for a clean BSL sweep to clear liquidity before looking for LTF confirmations to engage in buys.
Momentum is there, structure is clean — I just need price to do its part.
Staying patient. Still in sync.
#GBPUSD #SMC #bullishstructure #orderflow #inducementking #smartmoneytrader
Bless Trading!
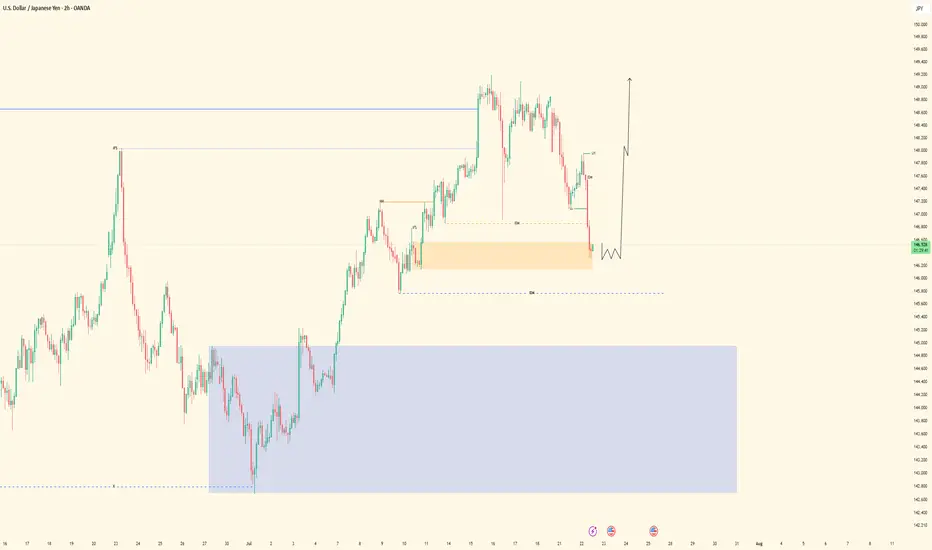
USDJPY| Bullish Bias - Mitigated OB, Waiting for LTF ConfirmsPair: USDJPY
Bias: Bullish
Price swept deeper liquidity and has now mitigated a key 30M bullish order block.
From the 2H bird’s eye view, structure is still aligned to the upside — but I remain in analysis mode until LTF confirms the shift.
No need to force anything — price is doing its job, and I’m waiting for it to speak clearly through confirmation.
Bullish structure still in play, but we wait for the perfect moment.
#USDJPY #SMC #bullishbias #orderblock #structuretrader #inducementking
Bless Trading!
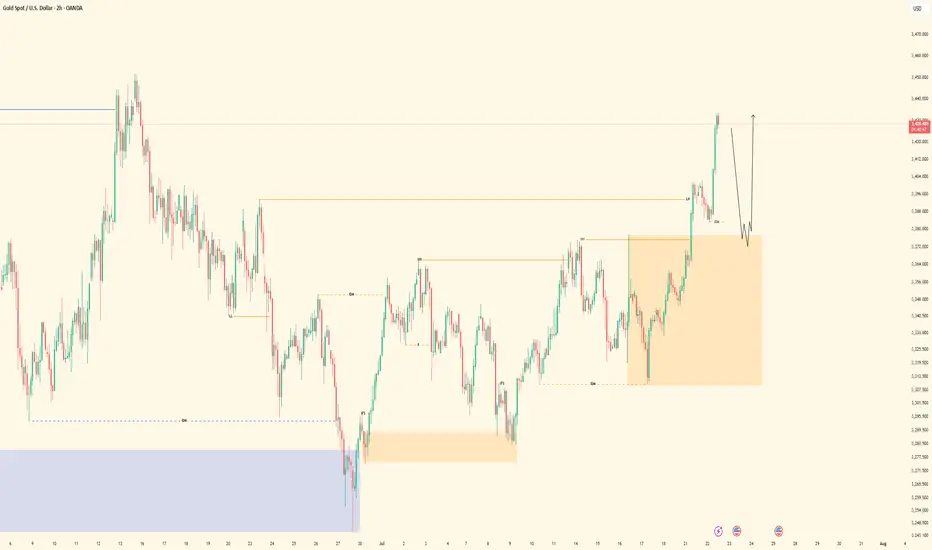
XAUUSD| Still Bullish - Waiting on BSL Sweep for EntryPair: XAUUSD
Bias: Bullish
Price remains bullish and structurally intact. This morning’s updated view confirms the bullish alignment — no change in directional bias.
Currently watching for a clean BSL sweep to clear out early liquidity, followed by LTF confirmations before engaging.
Higher time frame perspective from the 2H chart offers a solid bird’s eye view — staying patient and letting price come to me.
No rush — structure is king.
#XAUUSD #gold #smartmoney #SMC #orderblocks #inducementking #structurefirst
Bless Trading!
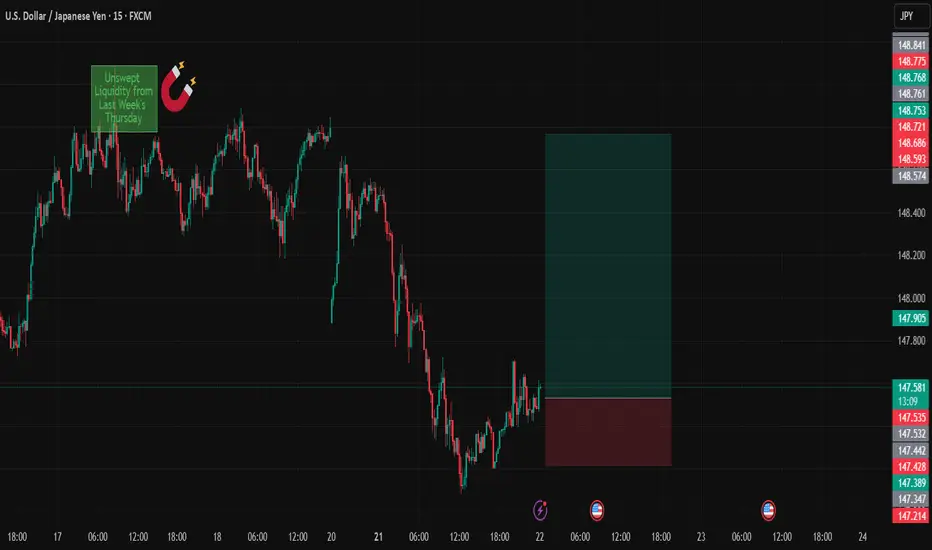
USDJPYDate:
July 22,2025
Session:
Tokyo and London session
Pair:
USDJPY
Bias:
Long
1. Clean liquidity pool left unswept from last week's NYC Open (Thursday).
Took this trade earlier today but looks like price wanted to consolidate in the liquid pool its currently in. I still hold the same idea and think the sweep will definitely take place sometime this week. Now looks like the perfect time to enter. If Asia session cant get it done its up to London and New York session.
Entry:147.534
Stop Loss:147.215
Target:148.768
RR:3.89
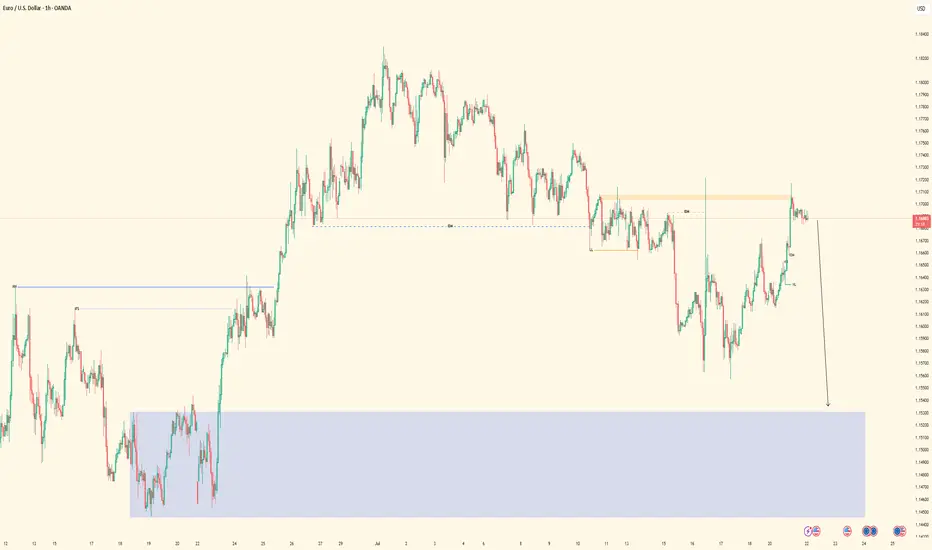
EURUSD - Sell Setup in ProgressPair: EURUSD
Bias: Bearish
HTF Overview: Structure leaning bearish — price respecting recent lower highs with room to fall into deeper 4H demand.
Current Zone: Price just mitigated the 30M sell-side OB, showing early signs of reaction.
LTF Confirmation: Still in observation mode — waiting for 5M or 1M confirmation to trigger short entries with confidence.
Entry Zone: Focused on refined LTF shift beneath the 30M OB — ideal setup includes inducement or liquidity run before executing.
Targets: First target is intraday low — ultimate target is the strong 4H demand zone below.
Mindset Note: Let the market bring the entry to you — don’t jump ahead of confirmation. Smart patience wins.
Bless Trading!
GBPUSD| - Bearish Play Setting UpPair: GBPUSD (GU)
Bias: Bearish
HTF Overview: Bearish structure intact — market has been respecting lower highs and pushing into downside pressure.
Current Zone: Price just mitigated the 30M OB, reacting as expected within the supply zone.
LTF Confirmation: Now waiting for clean confirmations on 5M or 1M — not in trader mode yet, analysis still in control.
Entry Zone: Watching for internal liquidity sweep or inducement followed by structure shift to confirm the sell.
Targets: First target is the next 30M low — extended target based on 1H continuation.
Mindset Note: No chasing — let the LTF tell the story before pulling the trigger. Control the urge, trust the system.
Bless Trading!
USDJPY - Bullish Bias, In OB ZonePair: USDJPY (UJ)
Bias: Bullish
HTF Overview: Bullish structure remains intact — price currently pushing upward, respecting higher timeframe flow.
Current Zone: Price is now sitting within the 30M OB, showing potential strength but no LTF confirmation yet.
LTF Confirmation: Still in analysis mode — sitting on hands, waiting for clean reaction on 5M or 1M before considering entries.
Entry Zone: 30M OB being monitored closely — ideal setup would include inducement and clear shift before entry.
Targets: Next 1H high remains the first target — extended targets to be trailed if momentum builds.
Mindset Note: Analysis first, execution second. Discipline is the edge — no rush until LTF gives the green light.
Bless Trading!