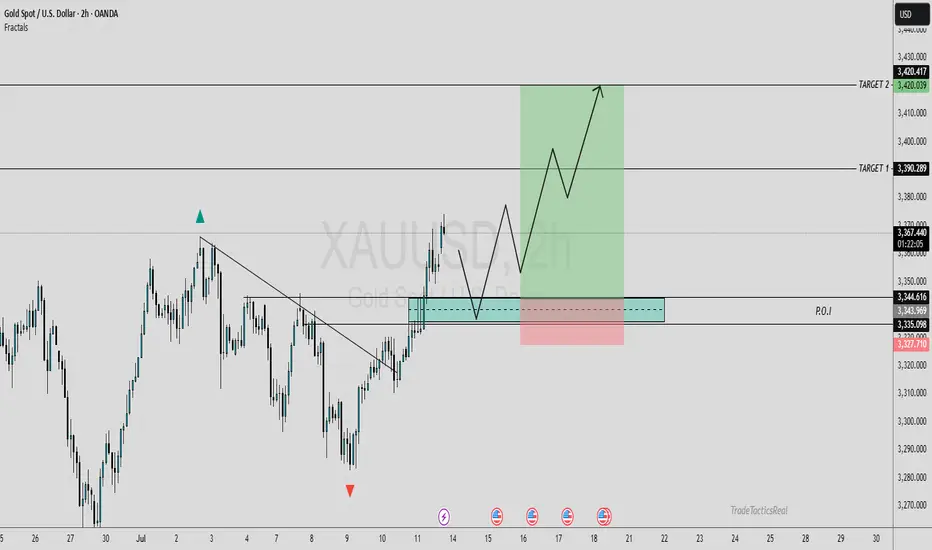
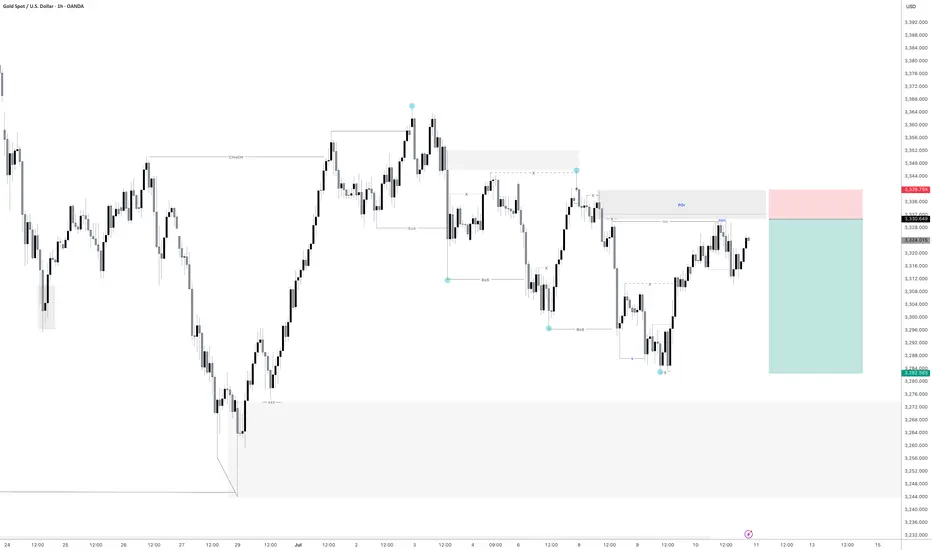
XAUUSD ANALYSISOn gold currently we're analyzing 2H time frame. As we know that current trend was bullish. At this stage, I'm anticipating a retracement towards my Point of Interest (POI), where I’ll be looking for a clear bullish confirmation, ideally through candlestick structure or solid price action. Only upon receiving that confirmation will I consider entering a buy position.
This outlook is based on the higher time frame structure. For now, I'm observing patiently to see how price unfolds. Until the market sweeps the SSL liquidity, I will remain on the sidelines no entries until that key liquidity level has been taken. Confirmation is key.
Always use stoploss for your trade.
Always use proper money management and proper risk to reward ratio.
#XAUUSD 2H Technical Analysis Expected Move.
Liquidity
CADJPY potential bearish My expectation for CADJPY is that it will rise toward the 108.38–108.55 zone to sweep previous liquidity, then potentially reverse and drop into the Fair Value Gap (FVG) area below.
You can sell now and reinforcement on the top

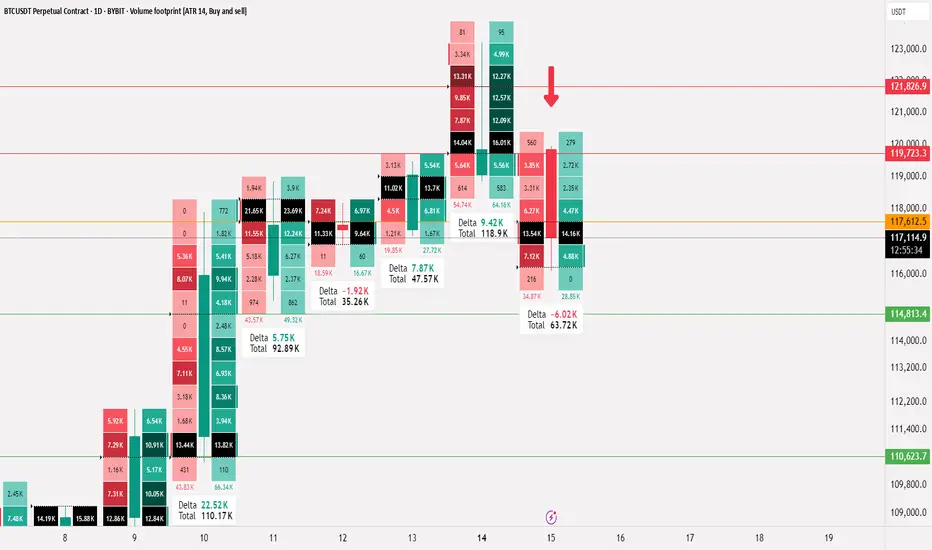
BTCUSDT.P liquidity analysis🟠 CRYPTOCAP:BTC
📄 This analysis is for liquidity and comparing supply and demand ratios
🚨 We start by noting that actual selling pressure began at 121826 and this ratio increased as it dropped below 119723
📄 Any daily close below 117612 will increase this pressure, which is logical after such a rise, specifically in Bitcoin
⭕️ The two closest important levels with liquidity and buying strength are at 114813 and 110623
◀️ The current rebound from 116114 (the lowest point Bitcoin has reached currently at the time of writing this analysis) is insufficient in terms of liquidity and needs more momentum, and attention here should be on the level 117612
📄 The current movement is between 117612 - 114813, the range where Bitcoin stabilized before achieving the historical peak, and thus maintaining this range will provide a boost for a larger rise
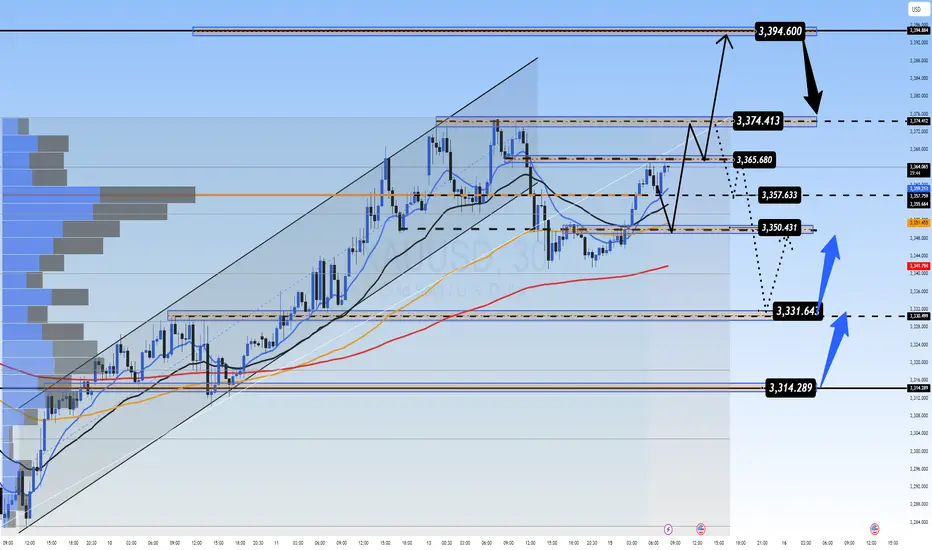
XAUUSD: Gold Moves Sideways, Awaiting Key Economic DataXAUUSD: Gold Moves Sideways, Awaiting Key Economic Data – Correction or Continued Uptrend?
🌍 Macro Overview – Waiting for CPI Data from the US
At the moment, Gold is trading in a wide sideways range between the 3x and 4x price levels, while traders are awaiting key economic data this week from USD, GBP, AUD, and EUR.
📊 Important Economic Data Today:
US CPI Report will be released during the US session today, making it one of the most important reports of the month.
CPI forecast is at 0.3%, which is considered positive for the US economy.
This report is expected to align with the recent Nonfarm data, and could lead to significant price movements upon release, potentially helping to adjust liquidity in the market.
🔍 Technical Analysis – Current Trend with Key Resistance Levels
The current trend remains bullish, but the movement on higher timeframes isn’t as pronounced.
Key resistance levels are located around 337x to 339x, where selling pressure is currently strong.
If price breaks through these levels, Gold could find support and move towards 3400.
📈 Short-Term Forecast:
A pullback to around 333x is expected, offering a good buying opportunity.
Looking further, 331x is a potential target, as the price range remains quite wide.
🎯 Trading Strategy for Today
🟢 BUY ZONE:
Entry: 3331 – 3329
SL: 3325
TP: 3335 → 3340 → 3345 → 3350 → 3360 → 3370 → ????
🔴 SELL ZONE:
Entry: 3392 – 3394
SL: 3398
TP: 3388 → 3384 → 3380 → 3376 → 3370
⚠️ Important Notes:
Watch for support and resistance levels to set up scalping trades that align with the current market trend.
Always set SL and TP to protect your account and avoid FOMO when there’s no clear confirmation for entry.
The 3350-3347 range is a key zone to look for buy opportunities.
💬 What’s your take on Gold’s movement today? Do you think it will break the resistance or will we see further correction? Share your thoughts in the comments below and join the discussion with fellow traders!
👉 If you want more daily updates and to participate in live discussions, don’t forget to follow and join our community! Let’s take advantage of these market opportunities together.
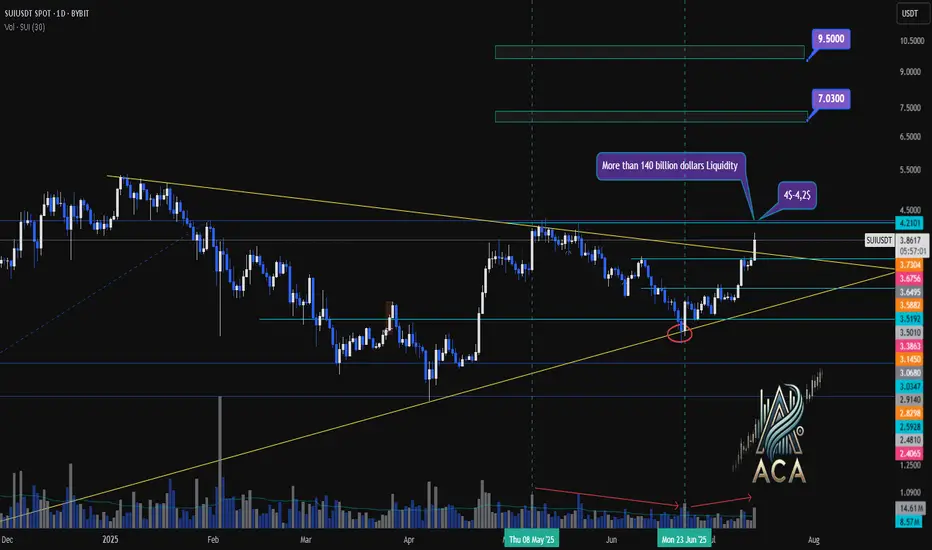
SUIUSDT Weekly Chart Analysis | Breakout Confirmed!SUIUSDT Weekly Chart Analysis | Breakout Confirmed, Massive Liquidity at $4–$4.20
🔍 Let’s dive into the SUI/USDT weekly chart after a decisive breakout from the symmetrical triangle, highlighting the critical liquidity zone and what it means for price action.
⏳ Weekly Overview
SUI has broken out of its multi-month triangle pattern following a textbook fakeout, with volume dynamics confirming renewed bullish momentum. The breakout is now awaiting daily candle confirmation for full validation.
🔺 Bullish Breakout & Key Liquidity Zone
A major liquidity cluster sits between $4.00 and $4.20, with more than $140 billion in liquidity concentrated in this range. This zone is crucial for several reasons:
- It represents a significant area where large buy and sell orders are stacked, likely leading to heightened volatility as price approaches or breaks through.
- Clearing this liquidity could unlock rapid moves toward the next upside targets at $7.03 and $9.50, as shown on the chart.
📊 Key Highlights
- Symmetrical triangle resolved with a bullish breakout, confirmed by increasing volume.
- The $4.00–$4.20 range holds over $140B in liquidity, making it a pivotal battleground for bulls and bears.
- Daily candle confirmation remains essential for trend validation.
- SUI ecosystem has reached a new all-time high in DeFi TVL, adding fundamental strength to the bullish case.
🚨 Conclusion
The breakout above the triangle, combined with surging volume and a record DeFi TVL, sets the stage for a potential rally. Watch the $4.00–$4.20 liquidity zone closely—how price interacts with this level could determine the speed and magnitude of the next move. Stay alert for daily confirmation and be prepared for volatility as SUI tests this high-stakes region.
#SUI #CryptoAnalysis #TradingView #Altcoins #ACA
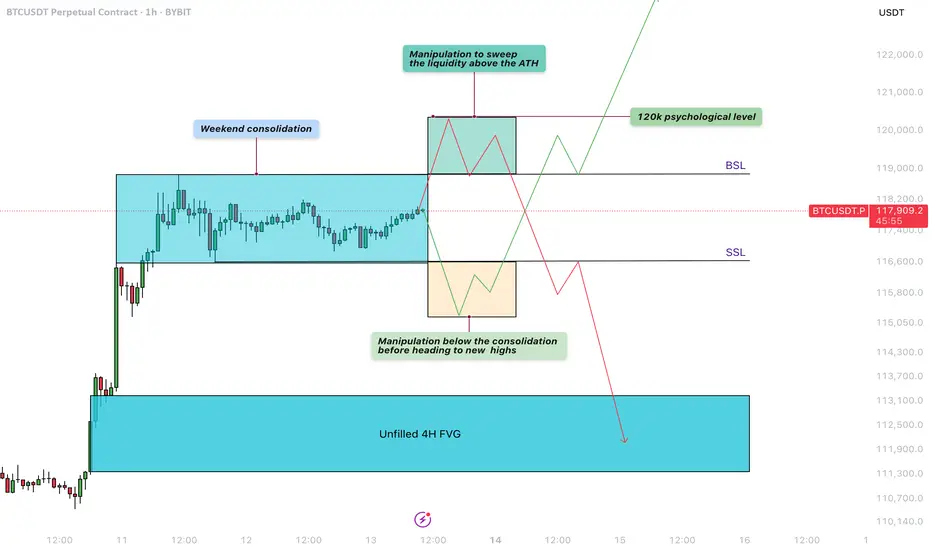
Bitcoin - Liquidity sweep before the next move!Weekend Consolidation
During weekends, Bitcoin often moves sideways as institutional players step back and retail traders prepare for the next move. During this consolidation phase between $117.000 and $119.000, liquidity builds up on both sides—sell-side liquidity below the range and buy-side liquidity above it. After these weekend consolidations, Bitcoin typically sweeps one side of liquidity before continuing in the opposite direction.
Manipulation Above the Buy-Side Liquidity
A significant amount of liquidity has formed just above the all-time high, right below the $120,000 level. Retail traders are positioning for a potential downward move, making this area a prime target for a liquidity sweep. This aligns perfectly with the psychological barrier of $120,000, a level where many traders are likely to take profits.
Manipulation Below the Sell-Side Liquidity
Over the weekend, traders are entering both long and short positions while placing stop-loss orders just below recent lows. This behavior creates a buildup of liquidity underneath the range. Bitcoin could dip below these lows to stop out retail traders before reversing to higher levels.
4-Hour Unfilled Fair Value Gap (FVG)
If Bitcoin sweeps the all-time high and enters a distribution phase, there’s a strong chance it will retrace to fill the unfilled Fair Value Gap on the 4-hour chart at $113.000 - $111.000. This imbalance was created during a sharp move up, leaving behind unfilled orders. Such levels often get revisited as price action seeks to rebalance.
How to Execute This Trade
Wait for Bitcoin to sweep either the low or the high of the weekend range. Avoid entering the market immediately after the sweep. Instead, wait for confirmation that price is returning back inside the range, signaling a clean sweep. On lower timeframes, such as the 5-minute chart, you can look for entry models like an inverse Fair Value Gap to refine your entry.
Final Thoughts
At this point, it’s unclear which direction Bitcoin will take next. The best approach is to wait for a clear liquidity sweep and signs of a reversal before entering any trades. That said, there’s a possibility we may first move up to test and claim the $120,000 psychological level before revisiting and filling the lower 4-hour imbalance zones.
Thanks for your support. If you enjoyed this analysis, make sure to follow me so you don't miss the next one. And if you found it helpful, feel free to drop a like and leave a comment, I’d love to hear your thoughts!
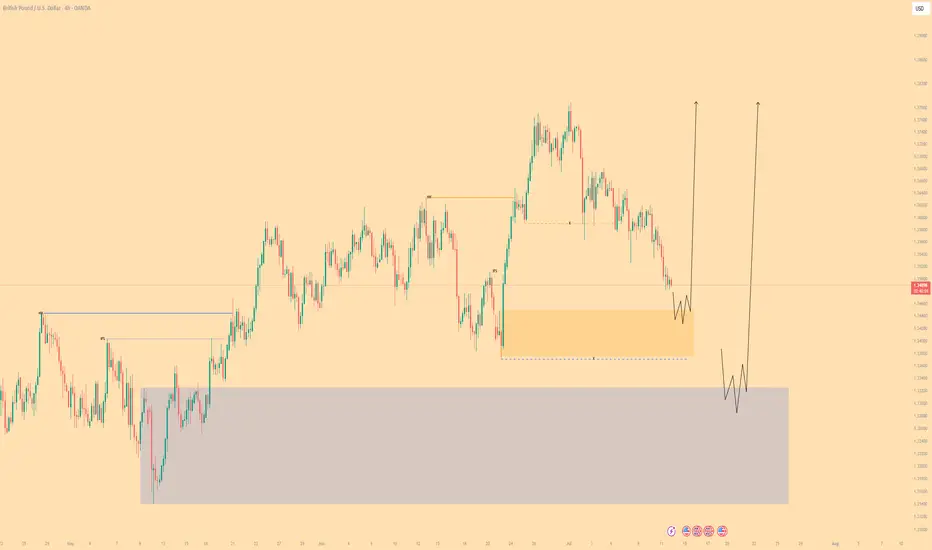
GBPUSD| - Bullish BiasHTF Overview (4H): Strong bullish structure in play, with multiple highs being broken and momentum firmly to the upside. Price is clearly respecting bullish order flow, suggesting continuation.
MTF Refinement (30M): Identified a 30M OB aligned with the trend. Waiting for price to mitigate this zone, as it could serve as the springboard for the next impulsive leg up.
Execution Plan: Once the 30M OB is mitigated, I’ll drop to LTF (1M/5M) to watch for confirmation — CHoCH, BOS, or microstructure shift — before executing longs.
Mindset: Bull momentum is intact — patience and confirmation are key to riding it with precision.
Bless Trading!
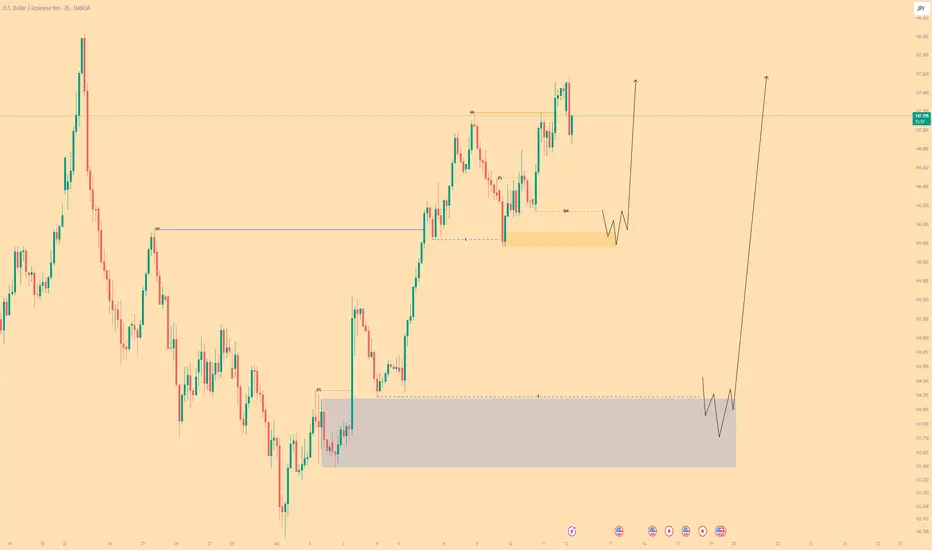
USDJPY| - Bullish Play Within Bearish HTF ContextHTF Overview (4H): Structure is still technically bearish, with buy-side liquidity (BSL) untouched and a major 4H supply OB unmitigated above. Expecting price to seek out that zone before any full reversal.
MTF Refinement (30M): Refined structure shows a potential bullish leg forming to push toward the 4H supply. Price is reaching for nearby sell-side liquidity (SSL), acting as inducement.
Execution Plan: Waiting for a clean sweep of SSL. Once that occurs and the 30M OB is mitigated, I’ll drop to LTF (1M/5M) to confirm bullish intent with CHoCH or BOS before executing a long.
Mindset: Playing the internal bullish wave with precision while respecting higher timeframe narrative. Quick to react if the HTF bias reasserts itself.
Bless Trading!
XAUUSD (GOLD) - Bullish BiasHTF Overview (4H): Structure remains bullish after a recent break of highs. Liquidity above was taken, followed by a clean mitigation of a 4H OB — signaling strength and smart money continuation.
MTF Refinement (30M): Aligned with the bullish narrative, 30M shows price is likely reaching for nearby sell-side liquidity before resuming the upward move. Watching for price to sweep that liquidity zone next.
Execution Plan: Once the 30M OB is mitigated, I’ll drop to the 1M/5M for internal structure shifts — CHoCH or BOS — to confirm long entry.
Mindset: Not chasing — letting liquidity play its role and waiting for the OB + confirmation confluence before executing.
Bless Trading!
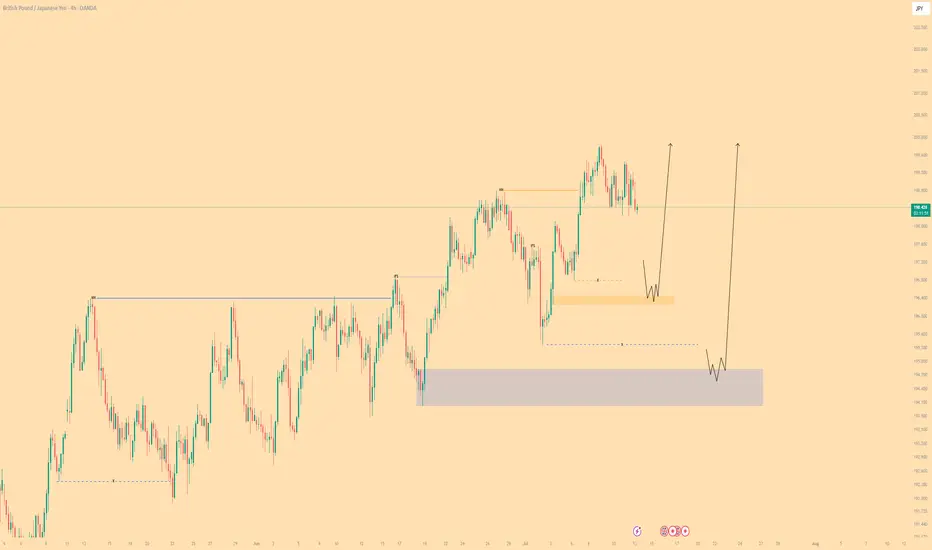
GBPJPY - Bullish BiasHTF Overview (4H): Price broke bullish structure with clean directional intent. Order flow remains aligned to the upside with no immediate signs of weakness.
MTF Refinement (30M): Zoomed into 30M for deeper structure clarity. Observing price actively reaching for sell-side liquidity (SSL) below a key low — a classic inducement setup forming.
Execution Plan: Waiting for a liquidity sweep below the SSL. Once swept, I’ll monitor the nearby 30M OB for mitigation. LTF confirmations (1M/5M CHoCH or BOS) will be needed before committing to a long entry.
Mindset: Patience over prediction — let liquidity do its job, then ride with smart money.
Bless Trading!
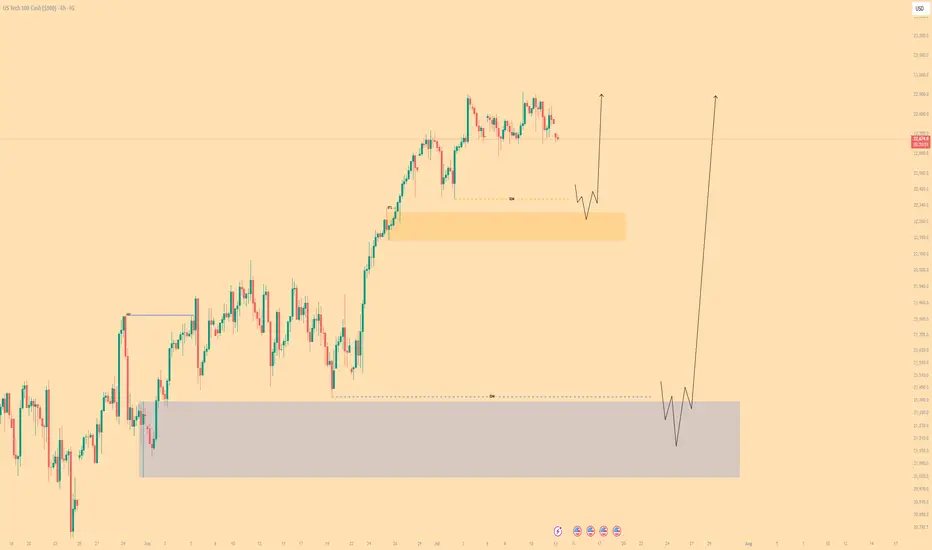
NASDAQ - Bullish BiasHTF Overview: 4H shows strong bullish intent with momentum driving price higher. Clear upside direction supported by sustained breaks in structure.
Liquidity Note: Noticed a key liquidity zone beneath current price (marked in blue). Although deeper mitigation was possible, price remained bullish.
MTF Refinement (30M): Dropped to the 30M for structural clarity and saw an earlier reaction. A bullish OB was formed and respected — now monitoring it for a potential mitigation.
LTF Execution Plan: If the 30M OB is revisited, I’ll be looking to the 1M/5M for confirmation (CHoCH or BOS) before executing long positions.
Mindset: Momentum is with the bulls — just waiting for smart money to confirm their next move.
Bless Trading!
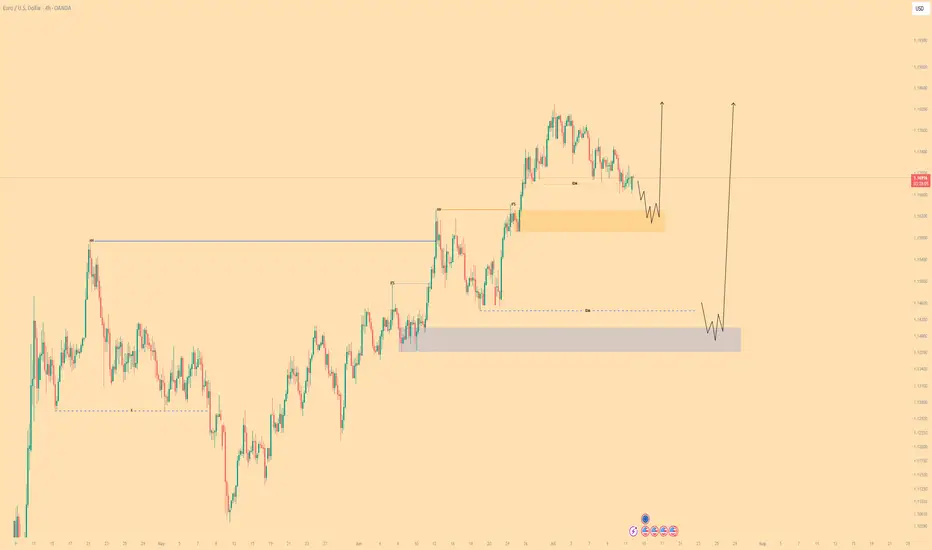
EUR/USD| - Bullish BiasHTF Context: Noted a clear break of structure to the upside, signaling strong bullish intent. Originally expected a deeper liquidity grab, but price shifted before reaching lower zones.
MTF Refinement: Dropped down to the 30M for better alignment — spotted a liquidity sweep confirming smart money interest.
LTF Execution Plan: Now watching for mitigation of the 30M OB. Once tapped, I’ll look for internal structure shift (1M/5M BOS or CHoCH) to confirm continuation.
Mindset: Staying patient — if price wants higher, it should respect this OB and show its hand first.
Bless Trading!
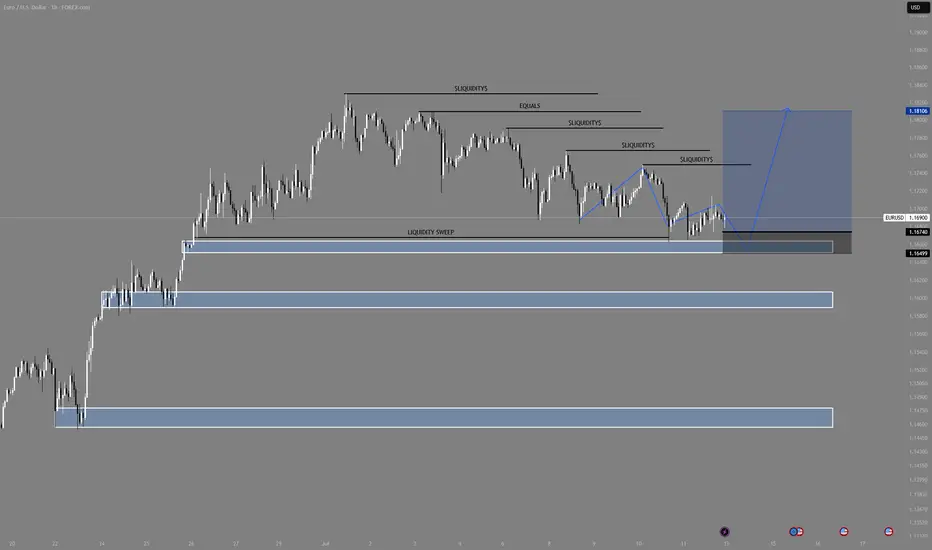
EUR/USD Bullish Continuation SetupMarket Structure Overview:
The market remains in a clear higher timeframe bullish trend, consistently forming higher highs and higher lows. Recently, price has entered a descending channel, resembling a bull flag formation — a classic continuation pattern that typically precedes a strong bullish breakout.
Key Observations:
✅ Descending Channel (Bull Flag): Price is respecting a downward-sloping channel while remaining above key demand zones.
💧 Liquidity Pools: Multiple liquidity highs have been left untouched above — suggesting fuel for a potential impulsive move upward.
🧹 Liquidity Sweep: On both H4 and H1, we see a clear sweep of previous equal lows, tapping into a significant demand zone.
📈 Reaction from Demand: Strong reaction from the demand zone suggests institutional buying interest.
🔵 Projection: A bullish breakout from the flag could target the liquidity above 1.1800, with immediate resistance near 1.1740–1.1760.
Bias:
🔼 Bullish — as long as price holds above the most recent demand zone (~1.1649), the bias remains bullish with expectations of a breakout and continuation toward previous highs.
Note: We must see how the market opens on Sunday night going into Monday. Based on the initial price action, we can determine the best trading opportunities and direction for the upcoming week.
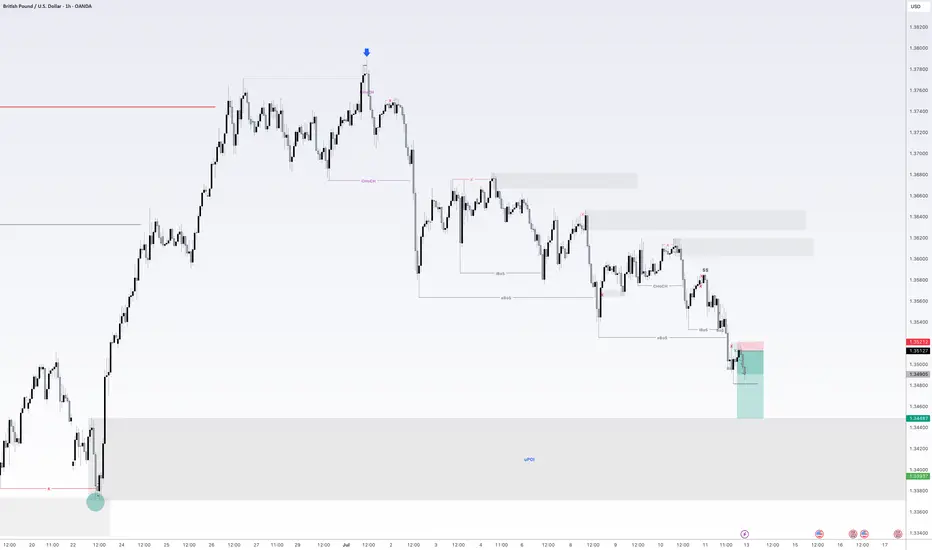
GBPUSD - Also continued downside continuationLooking at GU. This is a little bit ahead of its time in comparison to EU.
And what i mean by that is EU is a lot further away from its 4H demand zone compared to GBP so it will be super interesting to see how we react at the level we are fast approaching on GU.
I am in a short position as of Friday. I will be posting a video tomorrow showing exactly how and why i got short on GU so stay tuned for that one.
As always if there is anything else i can be of assistance with give me a message and i will be happy to answer any questions you may have
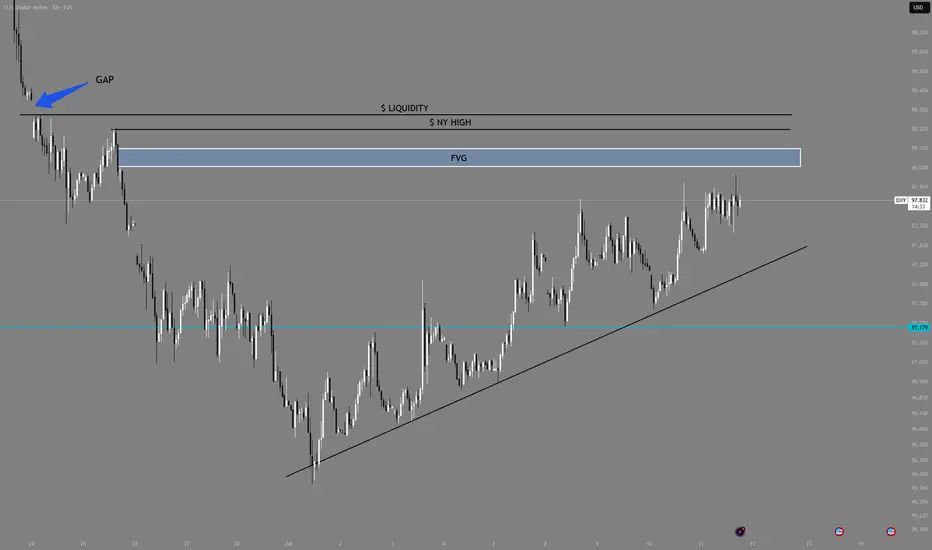
DXY Targeting Liquidity Zones & Gap Fill Before Potential ReversThe U.S. Dollar Index (DXY) is showing a strong bullish push, climbing steadily along an ascending trendline. Price appears to be heading toward key liquidity levels and a visible Fair Value Gap (FVG) near the previous New York high. The chart also highlights an unfilled gap above, which aligns with a potential liquidity sweep scenario.
Once these upper zones are tapped — including the liquidity and imbalance areas — a significant rejection could follow, especially considering ongoing strength in the Euro (EUR). This setup suggests a high-probability reversal opportunity after the liquidity grab
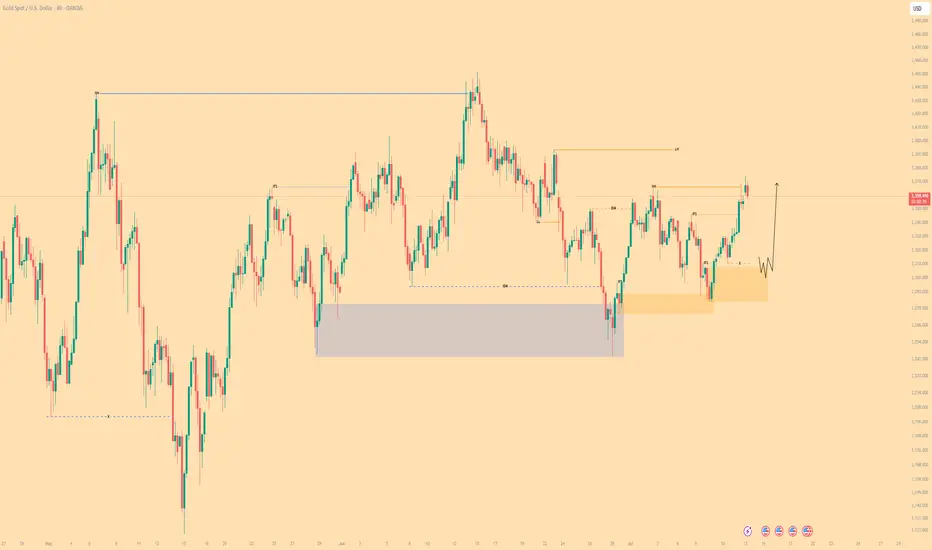
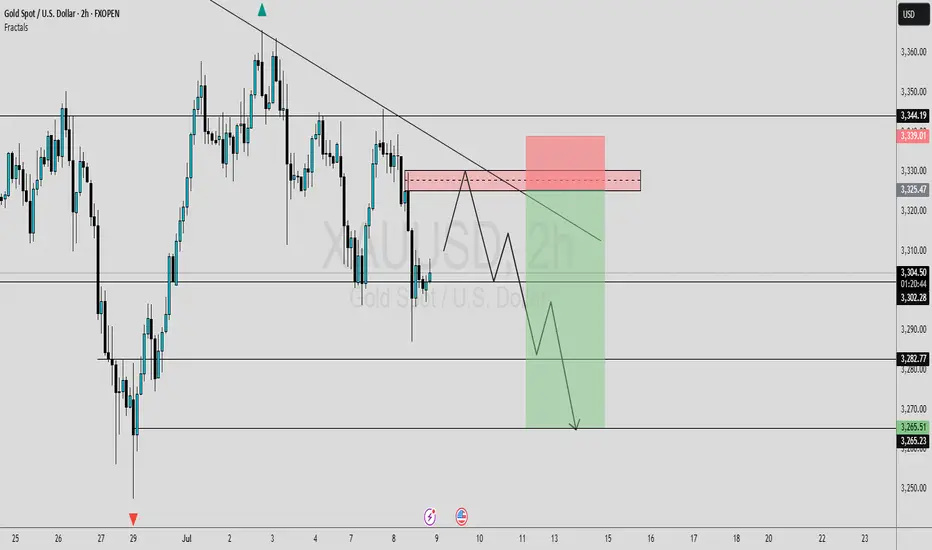
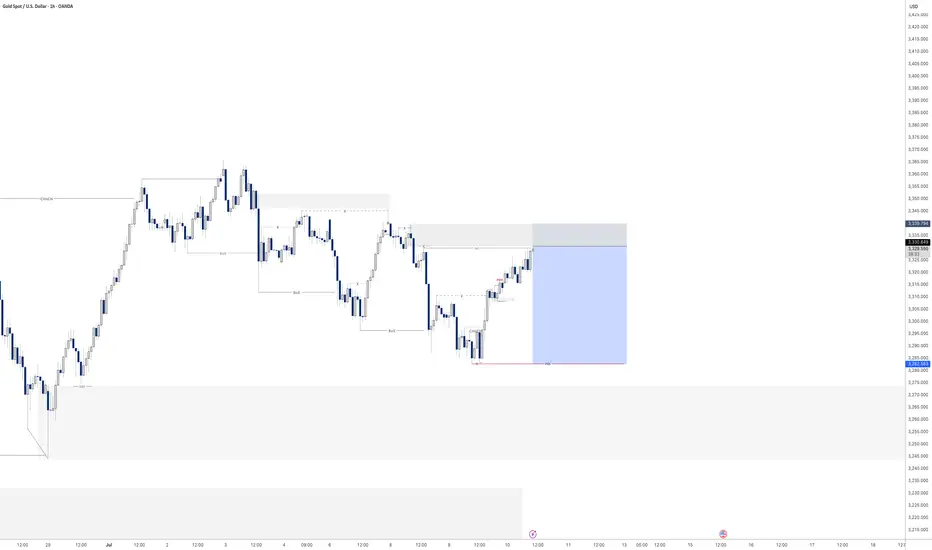
#GOLD UPDATESIn this analysis we're focusing on 2H timeframe for finding the upcoming changes in gold price.
Here we can see clearly that gold price creates trendline resistance and also price sweep all the SSL and pre. daily LQ sweep. Now I'm waiting for retracement, If price retest my supply zone and give bearish sign or reversal confirmation than we'll execute our trades. This is a higher time frame outlook. Further analyze more deeply into smaller time frame and place our position from an perfect point.
Always use stoploss for your trade.
Always use proper money management and proper risk to reward ratio.
Keep an eye on these levels. Confirmation is key.
#XAUUSD 2H Technical Analysis Expected Move.
EUR/USD Price Action – Liquidity Grab & Demand Zones This 1-hour EUR/USD chart highlights key intraday price levels and potential trading zones. The chart identifies the Previous Day High (PDH), New York Session High (NY HIGH), and Previous Day Low (PDL). A notable Trap/Demand Zone just below the Asia High suggests a potential liquidity grab before a reversal or continuation move. Price is currently reacting within this zone, and traders may watch for confirmations of either a bullish continuation toward the PDH or a bearish rejection back to the PDL. The marked zones serve as potential trade entry/exit reference points for intraday strategies.

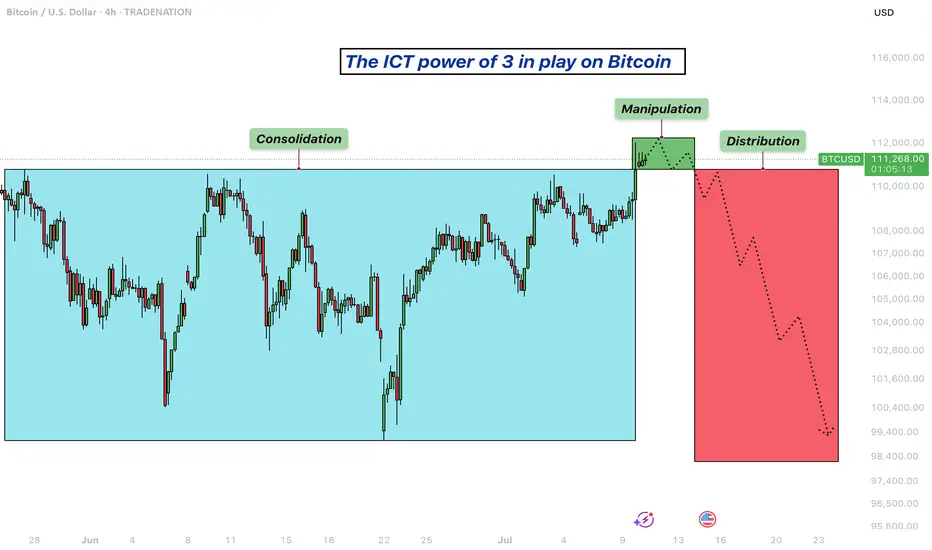
Bitcoin - Power of 3 in play!The chart illustrates a classic application of the ICT concept known as the "Power of 3," a theory that outlines a common market behavior pattern consisting of three phases: consolidation, manipulation, and distribution. This model is often used by smart money traders to identify points where institutional players may be accumulating or offloading positions, typically by targeting retail liquidity.
Consolidation
In this scenario, Bitcoin has exhibited a prolonged period of consolidation, where price fluctuated within a defined range throughout most of June and into early July. This range-bound movement, highlighted in blue, represents the market gathering orders from both buyers and sellers, creating a liquidity pool on either side of the range. During this phase, market participants become uncertain about the next direction, while smart money positions itself for the next move.
Manipulation/sweeping liquidity
Recently, Bitcoin has broken out of this consolidation range in an upward move, which is now being interpreted as the manipulation phase. This move served to sweep the liquidity resting just above the established highs of the range. These highs were prime areas for stop-losses of short sellers and breakout entries of longs, making them attractive targets for institutional manipulation. The price push above this level, marked in green, appears to be a false breakout designed to trap breakout traders and trigger stops before a likely reversal.
Possible distribution phase
Following this manipulation phase, the chart suggests we are entering or have just begun the distribution phase, marked in red. Distribution in the context of the Power of 3 refers to the process where smart money offloads their positions onto unsuspecting buyers who entered during the manipulation. The anticipated outcome is a sustained move to the downside, aligning with the forecasted bearish structure shown on the right side of the chart.
Conclusion
In conclusion, the chart reflects a textbook ICT Power of 3 pattern in play on Bitcoin. After a lengthy period of sideways consolidation that built liquidity on both sides, Bitcoin executed an upward manipulation to capture liquidity above the range. Now, with the highs swept and buy-side liquidity taken, the market looks poised for distribution, signaling a probable downward move in the near term. Traders familiar with smart money concepts would view this as a high-probability reversal zone.
Disclosure: I am part of Trade Nation's Influencer program and receive a monthly fee for using their TradingView charts in my analysis.
Thanks for your support.
- Make sure to follow me so you don't miss out on the next analysis!
- Drop a like and leave a comment!
Gold - Sell inboundGold is looking very promising for another sell off. we are already showing signs that price has intent to move lower with some lower timeframe break of structure.
Just waiting for a manipulation now of the most recent highs put in before price moves lower.
Let's see if we get an entry tonight.
Gold - Sell before longer term buyLooking at gold we are a matter of a few pips away from entry. looking to play gold down till our larger 4H area of demand seeing as we have had a CHoCH to the upside.
There for i will be looking to take my sell position down to 3283.5 at a bare minimum as it was the previous structure level in which we turned around.
Lets see if we get tagged in. If not i will jump down to the lower TF and see if we can get a confirmation that price is going to turn from here.
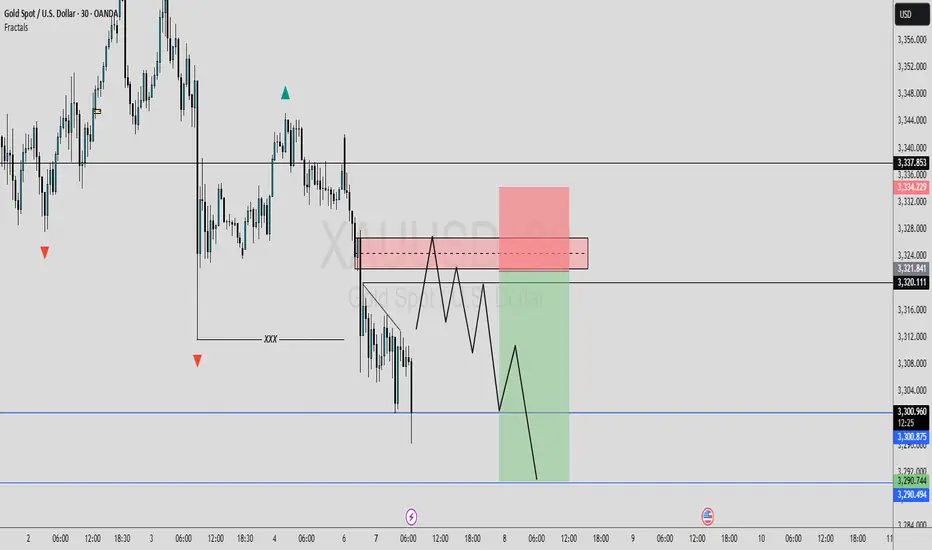
POSSIBLE BEARISH MOVE SCENERIO Currently we're monitoring 30M time frame chart. I’m expecting a sell move from the P.O.I zone marked on the chart. Since today is the first day of the week, the market volume is a bit low. Now let's see when the price reaches our P.O.I zone, and once it does, how the price behaves. We'll be watching for any bearish signs or confirmations. We’ll only enter the trade after getting a proper bearish confirmation. We'll also wait for the NY session to open before making any decisions. Let's see how this trade setup plays out.
Let's delve deeper into these levels and potential outcomes.
Always use stoploss for your trade.
Always use proper money management and proper risk to reward ratio.
#GOLD 30M Technical Analysis Expected Move.
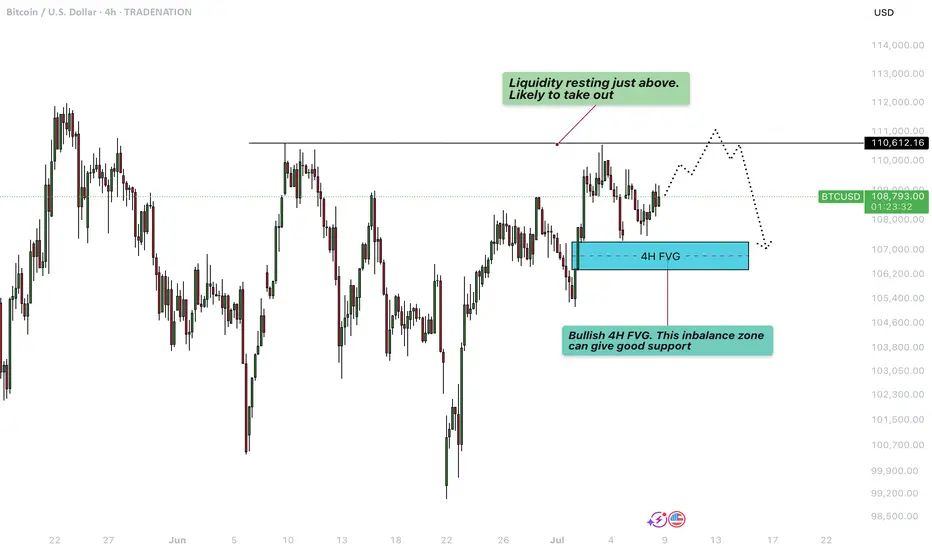
Bitcoin - Liquidity grab at $111.000?This 4-hour BTCUSD chart illustrates a potential short-term bullish continuation scenario followed by a deeper retracement, highlighting key liquidity levels and an important Fair Value Gap (FVG) support zone.
Liquidity sweep
At the top of the current price action, just above the $110,612.16 level, there is a clear area of resting liquidity. This zone has likely accumulated a significant number of stop-loss orders from traders who are shorting the market or who went long earlier and are protecting profits below previous highs. The market tends to seek liquidity to fill institutional orders, making this zone a high-probability target for a sweep. As a result, price is likely to take out these resting stop orders in a quick upward move, often referred to as a "liquidity grab" or "stop hunt", before potentially reversing or consolidating.
Bullish 4H FVG
Following this liquidity sweep, the chart suggests a retracement into a bullish 4-hour Fair Value Gap (FVG) located around the $106,600 to $107,400 region. This imbalance zone was formed during an impulsive move up, leaving behind a gap between the wicks of consecutive candles. Such gaps represent areas where demand previously overwhelmed supply, and they often act as strong support on a retest. If price revisits this zone, it is expected to offer support and could serve as a base for another upward push, assuming bullish momentum remains intact.
Downside risk
However, if the bullish FVG fails to hold as support and price breaks down through this imbalance zone, it would signal a weakening of bullish structure. In that case, the breakdown would likely lead to a deeper correction or even a trend reversal, with price seeking lower levels of support further down the chart. This would invalidate the short-term bullish scenario and suggest that sellers are gaining control, possibly triggering further liquidations and more aggressive selling pressure.
Conclusion
Overall, the chart is currently leaning bullish, anticipating a liquidity sweep to the upside followed by a potential pullback into the FVG. The reaction at the FVG will be critical in determining whether the market can continue higher or if it shifts into a deeper bearish correction.
Disclosure: I am part of Trade Nation's Influencer program and receive a monthly fee for using their TradingView charts in my analysis.
Thanks for your support.
- Make sure to follow me so you don't miss out on the next analysis!
- Drop a like and leave a comment!
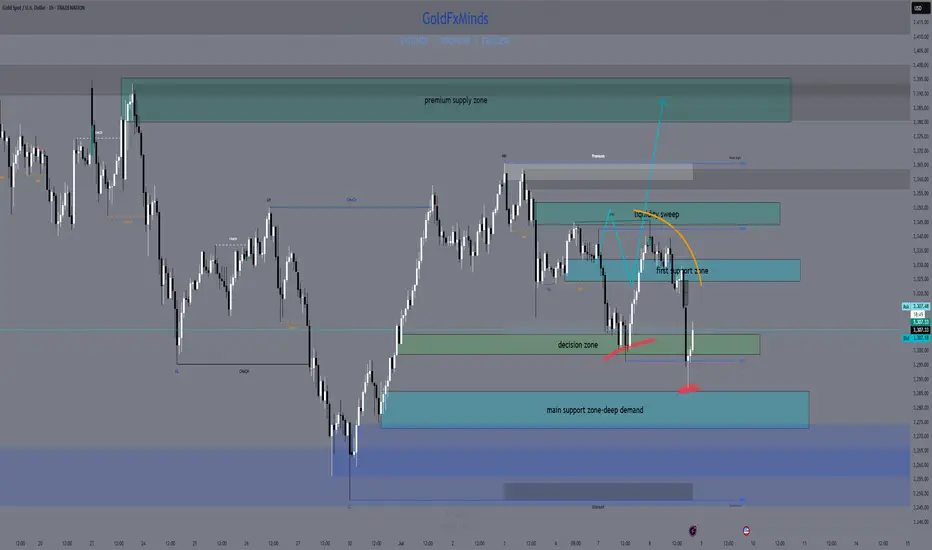
XAUUSD NY SESSION FLOW – JULY 8→ 9 , 2025"Structure doesn’t lie. Price answered exactly where we expected it to."
Hey traders 👋
Let’s set the record straight after today’s precision bounce. We saw textbook price action across all sessions — Asia triggered the short from our 3344–3351 HTF supply, and both London and New York followed through with no hesitation, driving price down to 3287.
But here’s the key point:
🧨 3287 was just 10 pips above our clean 3286–3280 buy zone.
No mitigation. Just a front-run.
That’s what real liquidity does — grabs what it needs before the crowd gets in. Our zone is still valid… just untouched.
🔍 HTF BIAS & STRUCTURE UPDATE
📆 Daily Bias:
Structure is still bearish — lower highs, CHoCH, and soft RSI.
EMAs 5/21 are flat. No power for bulls unless 3351 breaks.
⏰ H4 Bias:
New lower high confirmed after rejection from our 3344–3351 zone.
Trend is still bearish unless we reclaim 3330+ with conviction.
Liquidity is driving movement, not news.
🕐 H1 Flow:
Bounce from 3287 = engineered reaction before real demand
Price now hovering above 3306, forming mid-structure
No trade in the middle. Let’s work the edges.
🎯 TODAY’S SNIPER ZONES
🔻 SELL ZONES
1. 3325–3330
Nearest short trap. OB + inefficiency + H1 rejection base.
If price returns, watch M15/M30 for CHoCH or BOS → entry.
2. 3344–3351
Our major HTF supply. Asia already reacted from top half.
If revisited, this zone remains the high-probability rejection zone.
3. 3380–3394
Premium OB + imbalance pocket.
Untouched zone far above — if tapped late in the week, watch for liquidity sweep → clean reversal potential.
🟢 BUY ZONES
1. 3297–3300
NY session bounce zone. Price tapped 3297 → pushed to 3306.
Still live for intraday reentry if price retests and confirms with BOS.
2. 3286–3280
Our true demand base. Price front-ran it by 10 pips — didn’t mitigate.
Still valid, still reactive. Don’t delete this zone.
3. 3263–3255
Last line of support. Deep zone — only comes into play if 3280 fails with conviction.
✅ EXECUTION REMINDERS
Price is hovering mid-range → don’t force entries
Only act if structure reacts at the edges (3325 or 3286)
3380–3394 may be a late-week trap if bulls get overconfident
📌 If this breakdown helped, hit 🚀 and drop a comment:
👉 Are you stalking 3325… or waiting for 3286 to finally wake up?
Let structure talk. You just execute.
GoldFxMinds 💭🔥
📢 Disclosure:
This analysis is based on the Trade Nation TradingView feed. I’m part of their Influencer Program and receive a monthly fee.
⚠️ Educational content only — not financial advice.