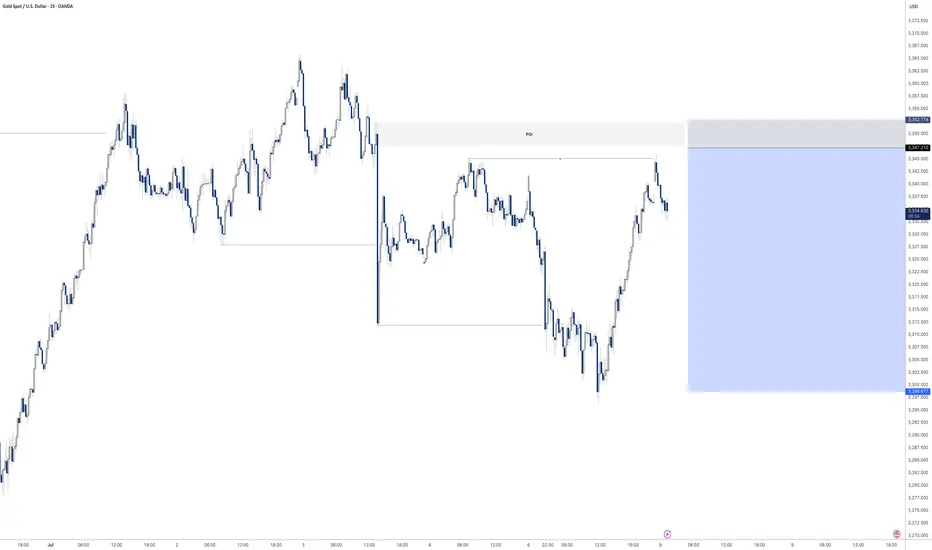
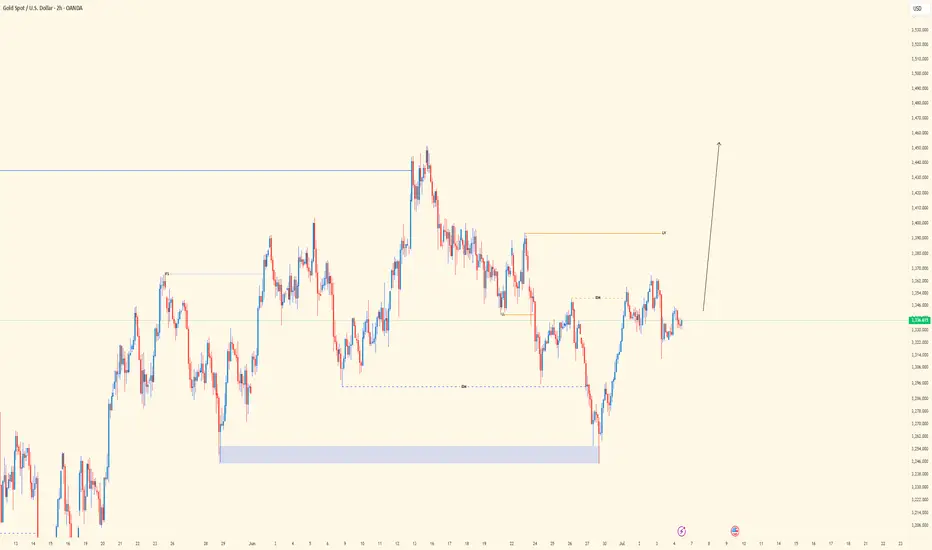
Gold sell off before continuation higher? Pending order set on this one before bed
Will see what develops overnight
Liquidity
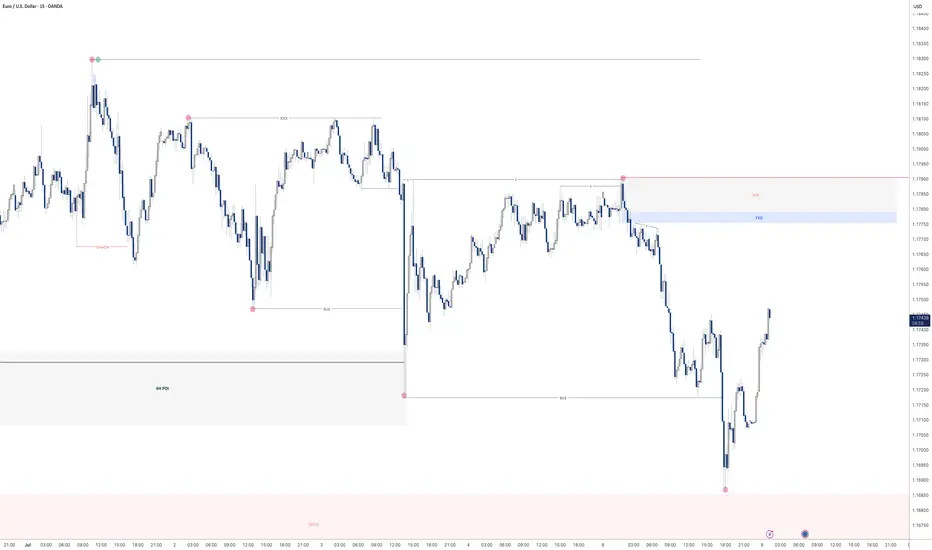
EURUSD - Potential sell at LDN or NY openLooking for sell from the POI highlighted
We have raided buy side liquidity so now its time to look at the origin of the move and see if we can further capitalise on a similar set up I took yesterday in order to bank a lovely 8.5% profit on this single trade.
Will post the trade below
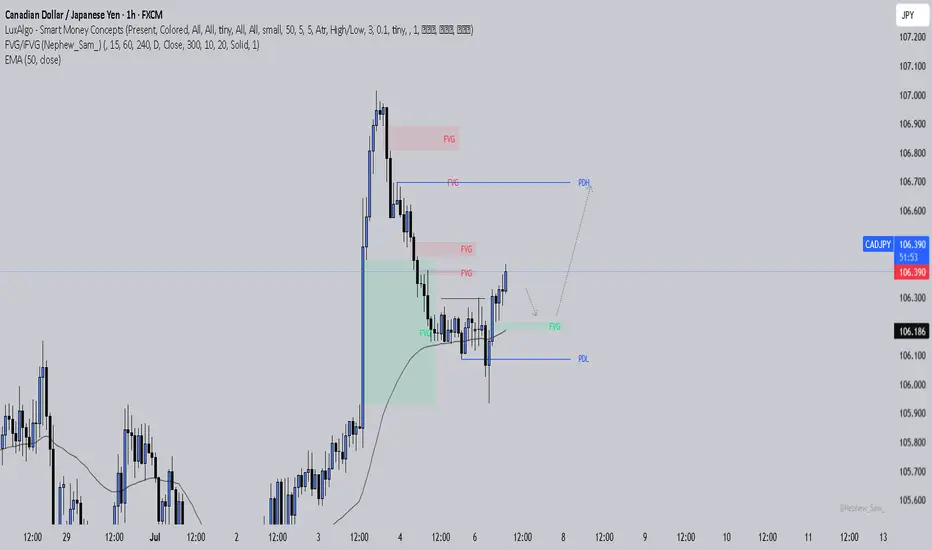
CADJPY: Is the Trap Set?Price swept the liquidity below the previous day’s low and then broke structure to the upside. That’s often a strong sign that smart money just stepped in. I’m now watching for price to pull back and fill the imbalance it left after the break. If it respects that zone, there’s a good chance we’ll see it push higher toward the previous day’s high where more liquidity is waiting.
I’ve also added the 50 EMA on this chart as an extra layer of confluence. It helps me stay aligned with the overall market direction and avoid taking trades that fight the current trend.
It’s easy to get impatient here and jump in too soon, but discipline means waiting for the story to fully unfold. Trust your levels, trust the process, and remember that protecting your mental capital is just as important as protecting your trading account.
How to Trade Smart Money Concepts (SMC)\ How to Trade Smart Money Concepts (SMC)\
\ This article explores the foundation, key tools, and practical insights of Smart Money Concepts — and why it’s worth your attention.\
In today's fast-changing financial landscape, Smart Money Concepts (SMC) has become a popular strategy among modern traders. But what is SMC exactly, and how can it improve your trading decisions? This article breaks it down in a simple, professional way for traders at all levels.
---
\ What Are Smart Money Concepts?\
SMC is a trading approach based on the belief that large institutions ("smart money") like banks and hedge funds control most of the market's movements. These institutions often move the market in ways that confuse or trap retail traders. The goal of SMC is to understand and follow the footsteps of these big players.
Instead of relying on simple patterns or indicators, SMC focuses on:
\ - Market structure\
\ - Supply and demand zones\
\ - Liquidity pools\
By aligning your trades with the behavior of smart money, you can position yourself more strategically in the market.
---
\ Key SMC Concepts Explained\
\ Order Blocks\
Order blocks are zones on the chart where large institutions have placed significant buy or sell orders. These zones often lead to strong price reactions and act as hidden support or resistance levels. Order blocks are considered more precise than traditional supply and demand areas.
Example: ()
\ Fair Value Gap (FVG)\
A Fair Value Gap occurs when price moves sharply in one direction, leaving a gap or imbalance in the price action. These areas often get filled later and can act as magnets for price.
In a bearish move, the FVG is the gap between the low of the previous candle and the high of the next one. In a bullish move, it's the reverse.
Example: ()
\ Timeframe Consideration\
If you can’t monitor charts during the day, avoid relying on 5–30 minute setups. Consider 4H or daily timeframes for clearer signals and more manageable trading decisions.
\ Liquidity\
Liquidity refers to price zones where lots of pending orders exist. These are usually at obvious highs, lows, or trendlines. Smart money often targets these areas to trigger stop-losses and generate movement.
One common tool to identify liquidity is a "pivot point," which is a candle with a lower low or higher high than its neighbors.
Example: ()
\ Break of Structure (BOS)\
BOS occurs when price breaks above or below a previous high or low, signaling a possible trend continuation.
Example: ()
\ Change of Character (ChoCH)\
ChoCH happens when the market changes direction. For example, if price breaks a higher low in an uptrend, it may signal a reversal.
Example: ()
Combined with BOS: ()
---
\ How SMC Compares to Wyckoff\
The idea of "smart money" isn't new. Richard D. Wyckoff, a pioneer in technical analysis, laid the foundation for understanding market cycles driven by institutions. His price cycle theory includes four phases:
\ 1. Accumulation\
Smart money buys while the public is unaware.
\ 2. Markup\
Price rises as smart money pushes the market.
\ 3. Distribution\
Smart money sells into public buying.
\ 4. Markdown\
Price falls as the cycle completes.
SMC borrows from this logic but focuses more on structure and liquidity zones. Still, the core idea is the same: understand what big players are doing, and follow them.
\ For deeper insights into Wyckoff, explore additional resources focused on accumulation/distribution cycles.\
---
\ Summary\
Smart Money Concepts give traders a deeper look into market mechanics. By focusing on order blocks, fair value gaps, liquidity, and structure breaks, SMC helps identify high-probability trade setups based on institutional behavior.
It may seem complex at first, but once you understand the basics, SMC can become a powerful tool in your trading strategy. Whether you’re new or experienced, aligning with smart money can improve your edge in the market.

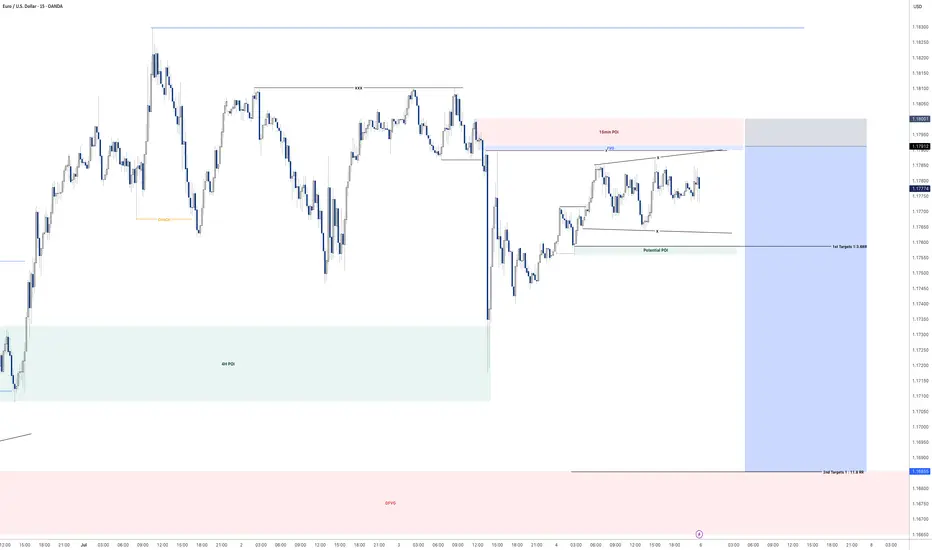
EURUSD - Looking for the RTLooking for the RT on the upper supply zone, long term target for EURUSD is 1.200-1.2200. However, on RT we can potentially expect a larger pull back but will analyse PA.
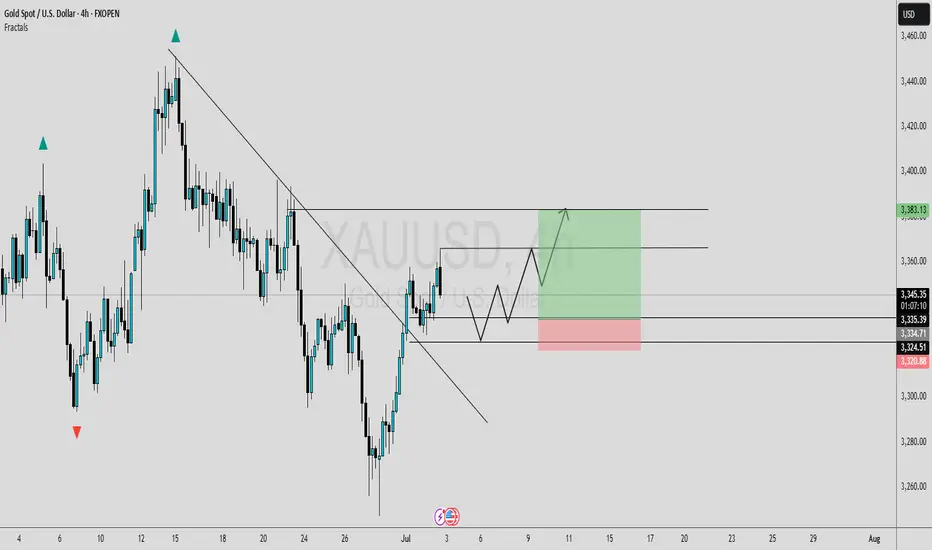
TRENDLINE BREAKOUT [LONG]In this analysis we're focusing on 4H timeframe. As we know that price move impulse toward upside and break trendline, now I'm waiting for retracement. Once price reach my zone and give any type of bullish confirmation than we'll execute our trade. This is a higher time frame analysis and key levels. Let's analyze more deeply into smaller time frame and potential outcomes.
Always use stoploss for your trade.
Always use proper money management and proper risk to reward ratio.
#XAUUSD 4H Technical Analysis Expected Move.
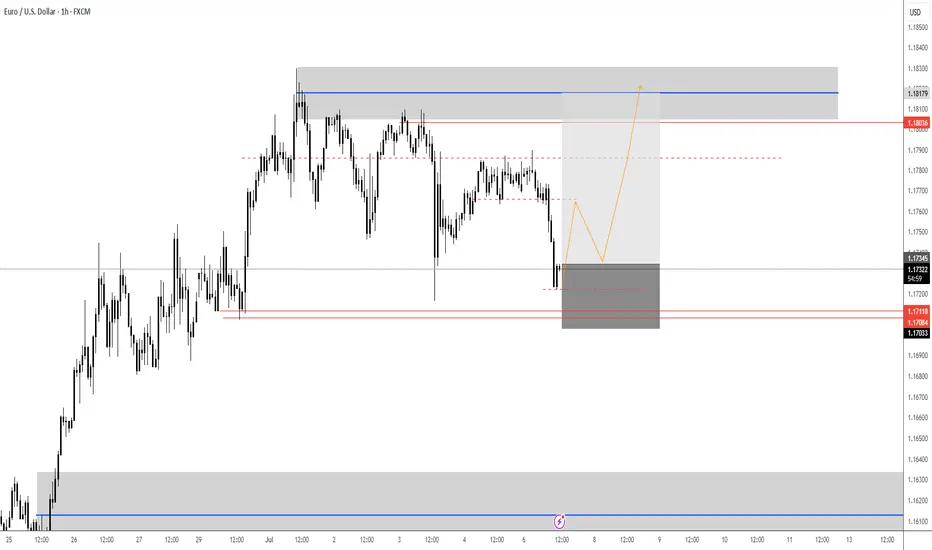
EURUSD - Where next?Looking at EURUSD
I still feel like we are due some sort of deeper retracement to the downside considering how bullish the 4H and Daily time frame have been in recent times.
Although the market does not care how I feel in all honesty haha. I will play the short term short until the 15min orderflow switches bullish once again.
The expansion that is currently happing right now is very interesting and makes a good watch to see what we will do come market open as we are engineering liquidity for both a buy and sell with both POI's looking primed for entries.
Will be keeping a close and keen eye on EURUSD when the market opens
Any questions feel free to give me a message
GOLD (XAUUSD) | 4H OB Respected | waiting for 30m LH BreakPair: XAUUSD
Bias: Bullish
Timeframes: 4H, 30M, LTFs
• 4H showing strong bullish structure — OB respected cleanly, confirming higher timeframe demand.
• On 30M, now patiently waiting for the break of LH to confirm continued bullish intent. After that, looking for a sweep off a fresh internal OB for LTF entry confirmation.
🔹 Entry: After LH break + sweep + CHoCH on LTFs
🔹 Entry Zone: Within fresh internal OB post-LH break
🔹 Target: Near structure highs
Mindset: Let the structure speak. No guesswork — wait for your levels, your break, and your confirmation. Precision over prediction.
Bless Trading!
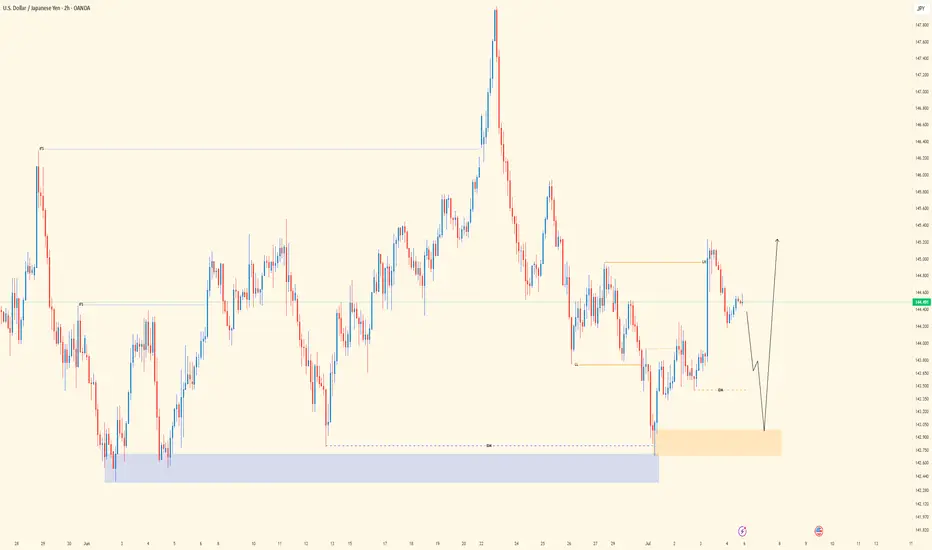
USDJPY| - Bullish Structure Holding | Waiting For Mitigation Pair: USDJPY
Bias: Bullish
Timeframes: 4H, 30M, LTFs
• 4H is showing clean bullish structure — internal high was breached, confirming bullish pressure.
• 30M broke the LH, showing further signs of demand holding.
• Now waiting on price to return and mitigate the OB zone for possible LTF confirmation.
🔹 Entry: Once price hits OB and gives CHoCH/sweep confirmation on LTFs
🔹 Entry Zone: Marked OB on 30M
🔹 Target: Near structure highs (continuation path if demand holds)
Mindset: Ride the wave, not the noise. Let the structure print, and don’t blink when price gives your cue.
Bless Trading!
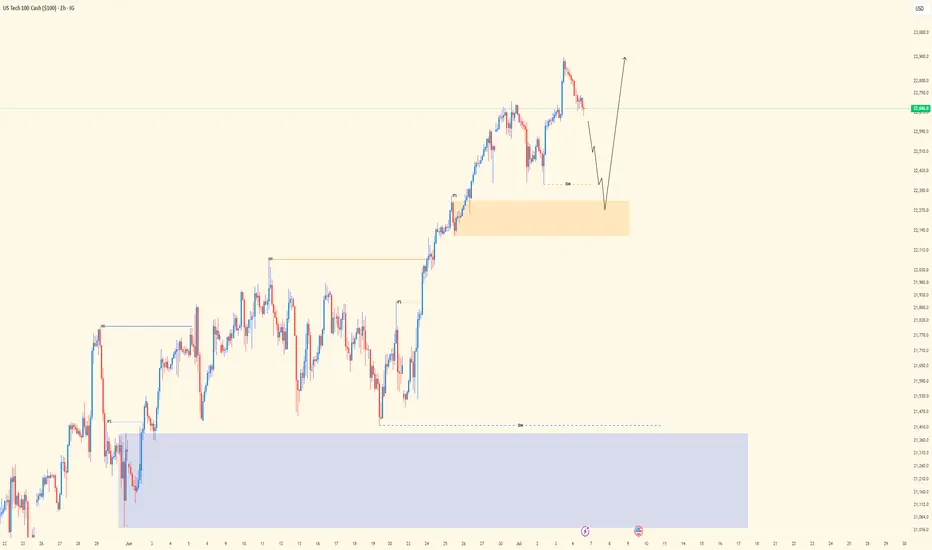
NASDAQ | - Structure Refined | Bullish Intent Into Next WeekPair: NAS100
Bias: Bullish
Timeframes: 4H, 2H, LTFs
• 4H broke structure to the upside with a new HH — clear sign of bullish intent stepping in.
• 2H gives clarity on the move — beginning of the week was messy, but price cleaned up nicely and gave us refined structure to work with.
• Now we wait for mitigation into the OB zone to see if price respects and gives us the setup.
🔹 Entry: After price mitigates OB and confirms with CHoCH on LTFs
🔹 Entry Zone: Marked OB zone — wait for confirmation
🔹 Target: Near structure highs — continuation if bulls step in
Mindset: Messy beginnings don’t mean bad outcomes. Structure eventually reveals the truth — just stay patient and ready.
Bless Trading!
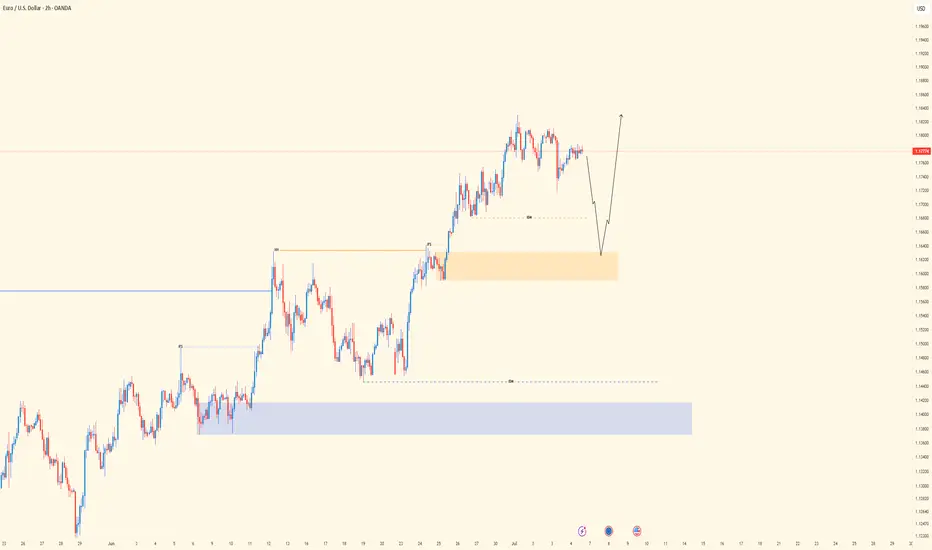
EU| - Bullish Structure Intact | Watching for SSL Sweep and RunPair: EURUSD
Bias: Bullish
Timeframes: 4H, 2H, LTFs
• 4H structure is clean and bullish — momentum’s been steady, and the market looks ready to ride higher going into next week.
• 2H gives clarity — I’m watching for a sweep of SSL into OB to set the stage for LTF confirmation.
• Entry process remains the same: wait for CHoCH, followed by sweep inside the OB zone.
🔹 Entry: After CHoCH + sweep inside OB (LTF process repeated)
🔹 Entry Zone: After confirmation within OB
🔹 Target: Structure highs — letting price unfold with the trend
Mindset: Patience pays the most. Wait for the market to come to you, not the other way around.
Bless Trading!
GU| - Bullish Ride in Motion | Key Zone Hold into New WeekPair: GBPUSD
Bias: Bullish
Timeframes: 4H, 2H, 30M
• 4H showing strong bullish momentum — price pushed aggressively, and we caught the move. Heading into next week, the bullish continuation is still valid unless price tells us otherwise.
• 30M gave a sweep from a refined OB zone — circled area shows the key move. Watching closely to see if bulls truly hold that ground.
• 2H gives a clear picture of structure — smooth directional flow confirming the bias.
🔹 Entry: After break of micro LH for confirmation
🔹 Entry Zone: Will be found within price flow — post-shift
🔹 Target: Structure highs — same continuation goal if bulls follow through
Mindset: No chasing. We wait, let price do the heavy lifting. Our job is to react with clarity, not emotion.
Bless Trading!

GJ| - Bullish Flow Maintained |Continuation into Next Week Pair: GBPJPY
Bias: Bullish
Timeframes: 4H, 1H, 30M
• 4H structure remains clean and bullish — no break in flow. Price is still respecting HTF order and momentum.
• 30M gave us that deeper SSL sweep, likely grabbing the early buyers and fast hands. But we stayed patient and followed the structure.
• 1H shows my view clearly — bullish pressure confirmed with reaction from OB and shift in momentum.
🔹 Entry: After sweep of SSL into demand (OB)
🔹 Entry Zone: Green zone marked — same level from earlier in the week
🔹 Target: Near structure highs — letting price flow up clean
Mindset: Week played out with precision. All levels still valid going into next week — no need to erase, just observe how price continues to respect our framework.
Bless Trading!
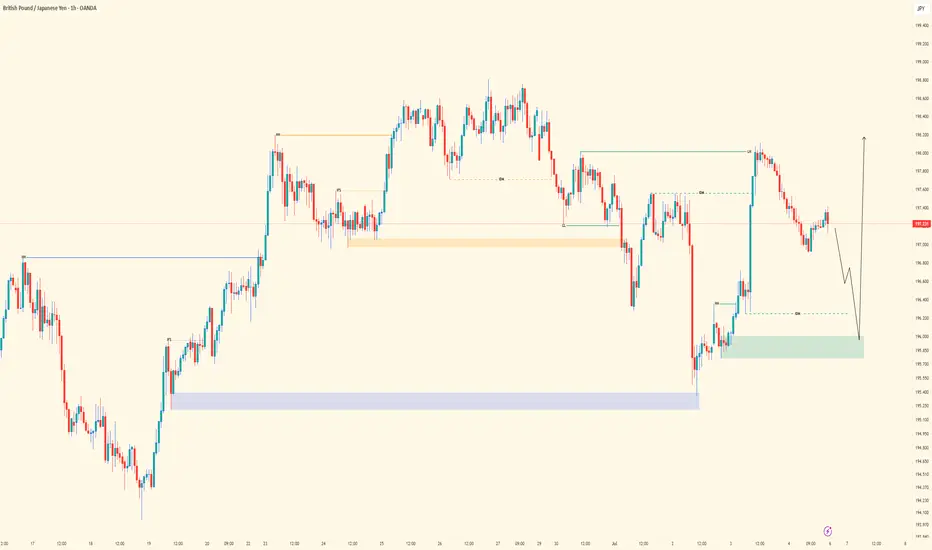
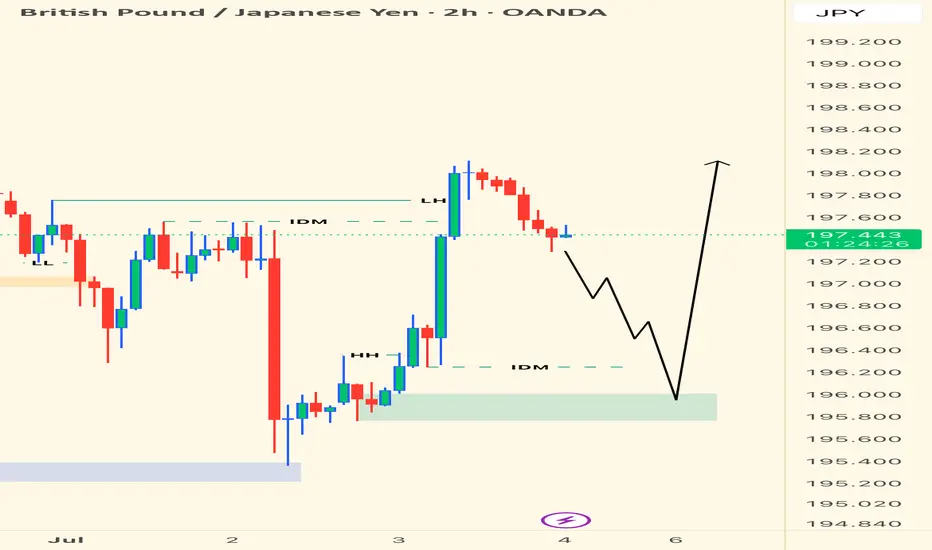
GBPJPY - Bullish Bias • Waiting to Execute from LTFPair: GBPJPY
Bias: Bullish
HTF Overview (2H): Price delivered the sweep I was patiently waiting for—textbook clean across multiple timeframes. The market has now tapped into the deeper range where real interest lies.
LTF Confirmation: All I need now is a structure shift + inducement on the 5M/1M to step in. I only move when the market shows its hand.
Entry Zone: Green zone marked on chart—expecting LTF sweep + shift before executing.
Targets: Short-term target is near the previous structure high around 198.200+.
Mindset Note: This setup has been cooking all week. Now the prep is done, I just need precision. Watching like a hawk. When it confirms—I strike.
Bless Trading!
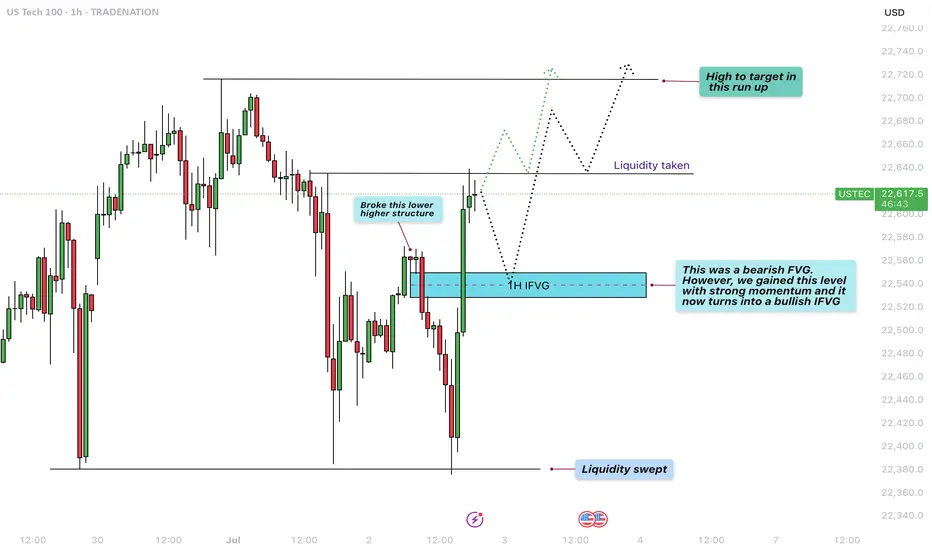
US100 - Reversal after liquidity sweep to target new highs?The chart presented shows a 1-hour analysis of the US100 (Nasdaq 100), illustrating a clean and structured price action narrative. Initially, we observe that the market swept liquidity at the lows, indicated by a sharp wick that pierced beneath the previous support levels. This type of liquidity sweep is common when smart money looks to grab stop-loss orders before reversing the trend.
Liquidity sweep to the downside
Following this liquidity sweep, price action aggressively moved upwards, breaking a lower high structure that had previously marked the bearish control of the market. This break of structure is a key bullish signal, suggesting a shift in momentum from bearish to bullish, and often signifies the beginning of a new upward leg.
1H FVG
An important element on this chart is the 1-hour Fair Value Gap (FVG), initially acting as a bearish imbalance. However, due to the strong bullish momentum, price not only reclaimed this level but did so decisively. As a result, this bearish FVG is now considered a bullish FVG, indicating that it may serve as a support zone on any short-term pullback.
Liquidity taken from the upside
After reclaiming the FVG and breaking structure, price surged further, taking out upside liquidity just above recent highs. This action typically leads to a short-term pullback, as profit-taking and new supply enter the market. The chart suggests that any retracement may find support at the 1H FVG, providing a potential entry point for bullish continuation.
Conclusion
In conclusion, the US100 demonstrated a textbook liquidity grab at the lows, followed by a break in bearish structure, a shift in momentum, and an inversion of a key FVG zone from bearish to bullish. The short-term upside liquidity has been cleared, and the next logical target is the high marked on the chart. Should the price respect the newly formed bullish FVG on any pullback, we can expect continuation toward that upper high, completing the bullish run.
Disclosure: I am part of Trade Nation's Influencer program and receive a monthly fee for using their TradingView charts in my analysis.
Thanks for your support.
- Make sure to follow me so you don't miss out on the next analysis!
- Drop a like and leave a comment!
GBPUSD LongLooking to the upside got BoS pull back into FVG with the second retest. Looking for the bullish extension to the upside.

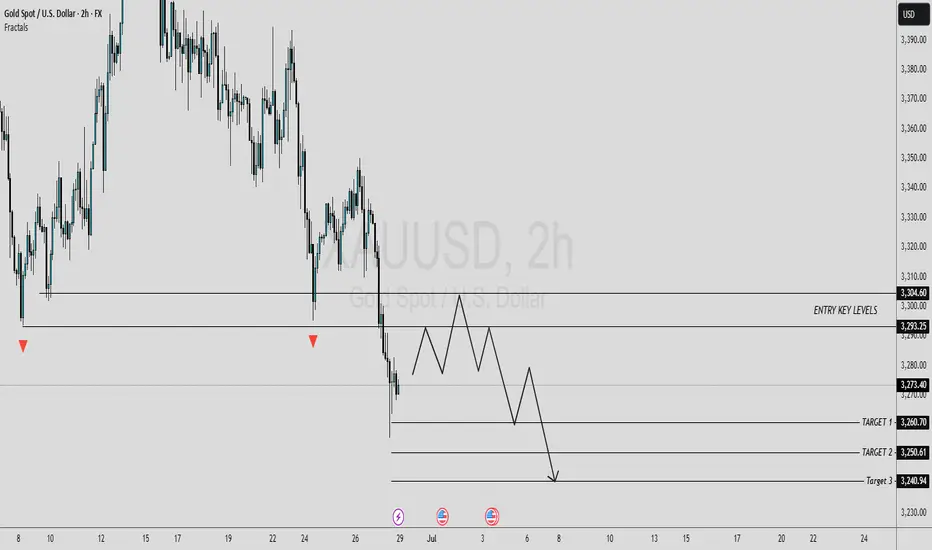
#XAU/USD SELL TRADE SETUP [SHORT]In this analysis we're focusing on 2H timeframe. As we know, Gold is moving in a strong bearish trend. The best selling zone is 3295 - 3305 key levels area. If gold encounters rejection from this zone, we can anticipate a potential decline in price towards its targeted levels.
Target 1:3260
Target 2:3250
Target 3:3240
Wait for a retracement to sell with strong confirmation and proper risk management.
#GOLD 2H Technical Analysis Expected Move.
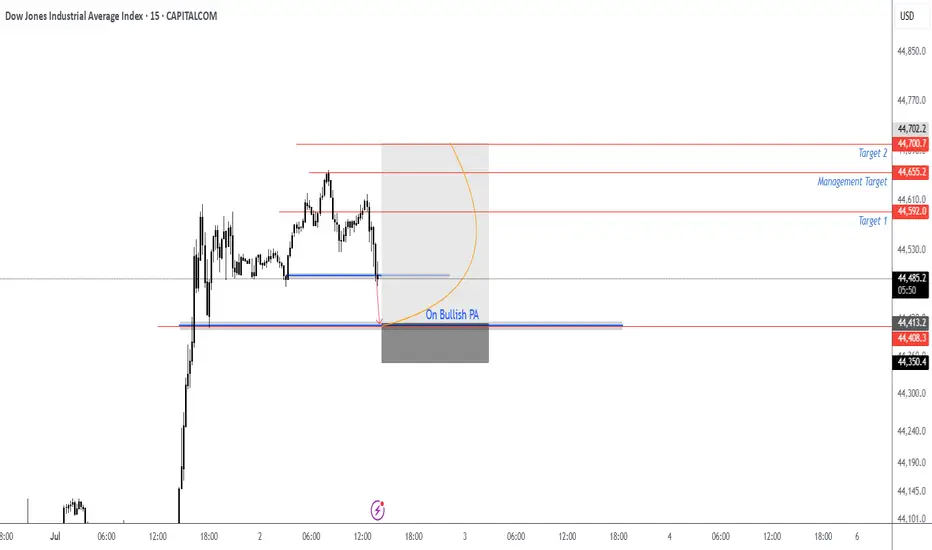
US30 Pullback then LongLooking for the pullback then on on bullish PA look for the entry. Wait for breach below then push back up and bullish PA close then plan entries.
Bitcoin & Ethereum New Quarter | What To Look For🎯 New Quarter For COINBASE:BTCUSD & COINBASE:ETHUSD — What To Look For
As we enter a new quarter, smart money is already positioning.
Institutional investors, hedge funds, and asset managers don’t just trade price — they rotate capital based on quarterly performance, risk appetite, and macro expectations. That’s why each quarterly open is a key inflection point across all markets — including crypto.
In this video, I break down:
• 🧠 How institutional capital rotation impacts Bitcoin and Ethereum
• 📈 Key levels to watch as Q3 unfolds
• 🔁 What are the likely outcomes
• 📊 How to prepare for volatility and new trend formation
This isn’t just another candle — it’s the start of a new chapter in the cycle.
If you’re serious about understanding where the money flows next , this video is for you.
This is the likely outcome
Price not ready to moon yet
Strong candle implying new highs incoming
Watch for bearish stop hunt on new quarter
This is a bullish outside bar
MartyBoots here , I have been trading for 17 years and sharing my thoughts
👍 Enjoyed the insights?
Let me know your thoughts in the comments below — and don’t forget to like this post to support the channel!

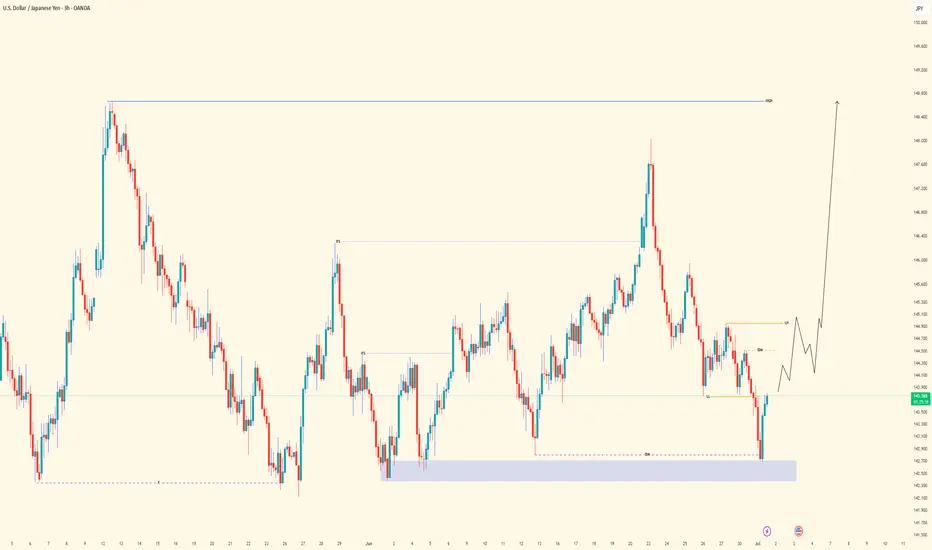
USDJPY| - Weekky OutlookBias: Bullish
HTF Overview (4H):
Price has shown bullish intent by breaching a major internal high and taking out significant sell-side liquidity (SSL) before mitigating the 4H order block below. This suggests a bullish narrative is forming, even though the 4H swing high hasn’t been taken yet.
LTF Confirmation (30M):
Currently showing bearish momentum. I’ll wait for a clean CHoCH to confirm shift in intent. Once price sweeps liquidity and mitigates a valid 30M OB, I’ll look for entries.
Entry Zone:
After liquidity sweep + OB mitigation on 30M (or refinement on 5M), I’ll execute the setup.
Targets:
• Scalp: 5M structure highs
• Short-Term Hold: 30M structure highs
• Extended Hold: 4H structure highs (if price action is strong)
Mindset Note:
Structure tells the story, but price action confirms whether it’s worth riding. Even when structure looks awkward, respect is often still given—so stay fluid, but focused.
Bless Trading!
Bitcoin - Price struggles below resistance, correction to $104k?This 4-hour chart for BTC/USD illustrates a detailed technical analysis scenario highlighting key resistance and support zones, as well as a critical fair value gap (FVG). The chart shows that Bitcoin is currently facing strong resistance in the $108,000 to $109,000 range. This area has been tested multiple times without a successful breakout, indicating significant selling pressure. The price is currently trading just below this resistance zone, struggling to gain momentum above it.
Support zone in the consolidation
A clear support level has been marked in the recent consolidation area around $106,000. This zone has served as a short-term base during the recent upward movement, and a retest here could provide a temporary bounce or pause in bearish momentum. However, if this support fails to hold, the next major area of interest lies within the 4-hour bullish FVG between approximately $103,000 and $104,000.
4H FVG
There is a clear 4-hour bullish FVG between approximately $103.000 and $104.000. This level can act as a strong support for buyers after filling up the inbalance zone. it is highly important to hold this level as support and not to break below it.
Upside potential
On the upside, if BTC can defend the support in the consolidation zone and reclaim momentum, a push back to the $108,000 to $109,000 resistance area is probable. A successful breakout above this zone would invalidate the bearish scenario and may trigger a bullish continuation, with the potential to reach higher targets such as $111,000 or beyond.
Downside risk
The downside risk becomes more pronounced if BTC breaks below the 4H FVG. A sustained move beneath this level would likely signal weakness in buyer interest and potentially open the path to deeper downside targets. In such a scenario, the price could accelerate lower toward the psychological support level at $100,000. This round number also carries technical and emotional significance for traders, which could create both a strong support area and potential buying interest.
Conclusion
In conclusion, Bitcoin remains at a critical juncture. The key levels to watch are the support within the current consolidation and the 4H FVG imbalance zone. A breakdown below the FVG could lead to a decline toward $100,000, while holding above these levels keeps the door open for another test of resistance at $108,000 to $109,000. A breakout from there would indicate bullish strength and a shift in market sentiment. Traders should remain cautious and reactive to how price behaves around these critical areas.
Disclosure: I am part of Trade Nation's Influencer program and receive a monthly fee for using their TradingView charts in my analysis.
Thanks for your support.
- Make sure to follow me so you don't miss out on the next analysis!
- Drop a like and leave a comment!

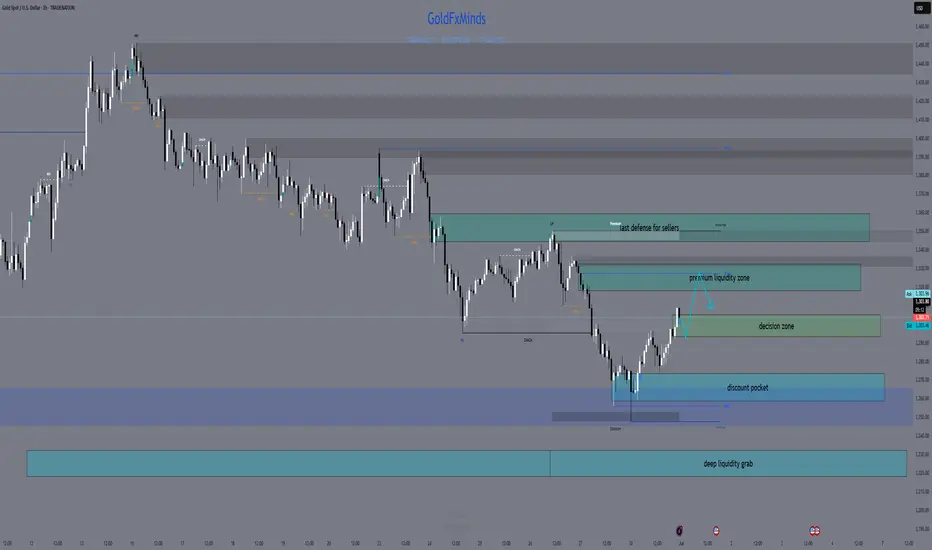
GoldFxMinds XAUUSD Daily Sniper Plan – July 1🌅 Good morning, gold hunters!
The start of a new month is here, and price action is as wild as ever! Yesterday’s liquidity raids swept both sides, leaving most traders guessing – but structure never lies. Let’s break down exactly where the real money sits for July 1, so you never get caught on the wrong side of gold.
🌎 Macro, News & Geopolitics
Macro: US data is in focus (ISM PMI, JOLTS, Powell speech), keeping volatility high and liquidity pools exposed.
Geopolitics: Tensions persist globally but no fresh headlines – market is pure price-driven.
Sentiment: Bulls got trapped high, sellers are hungry for a deeper sweep. Don’t trust easy breakouts!
🏛️ HTF Bias Recap
Weekly: Bullish structure, but overextended. Pullback zones active, buyers get best deals only at true discount.
Daily: Strong wick rejections at supply, sellers showing teeth. Watch for lower highs and failed breakouts.
H4: Range between 3332 and 3258, liquidity building at both edges. Smart money will hunt stops before any trend is real!
🔑 H4 Key Structural Levels
Premium Supply: 3320–3332 (main unmitigated supply block)
Mid Range Decision: 3296–3306 (watch for PA shift, don’t force entries here)
Discount Demand: 3272–3258 (clean OB/imbalance confluence)
Deep Discount Demand: 3232–3218 (ultimate liquidity pocket)
🎯 Sniper Zones (M30/M15 Refined)
SELL Zones:
3320–3332:
The untouched supply – only sell if PA prints a reversal after a NY liquidity grab. Don’t jump in early!
3345–3360:
Extreme extension zone. If price overreaches, look for signs of exhaustion. This is the bear’s last stand!
BUY Zones:
3272–3258:
True discount! Wait for a stop run below 3275, then catch the bounce ONLY if you see confirmation (engulfing, CHoCH, RSI support).
3232–3218:
No hope trades here. Only for flash crash or panic sell-offs with obvious absorption! Wait for a real PA reversal.
Decision Zone:
3296–3306
If price is stuck here, sit on your hands! Let the market show its hand first.
🚦 Quick Recap
Avoid already-mitigated zones – only hunt where liquidity is fresh!
NY session wicks and fake breakouts are the biggest traps. Be patient, let the stop hunt finish before you engage.
Confirmation over prediction. Discipline is your edge, not drawing boxes.
🎁 Bonus Tip
"Missing a sniper entry? The best traders never chase. Let gold come to you. There’s always a second chance for those with patience!"
📣 Like what you see?
Smash that like🚀🚀🚀 , drop your thoughts in the comments , and don’t forget to follow GoldFxMinds for more high-precision gold plans!
Analysis powered by Trade Nation chart feed – built for the sharpest minds in gold.