Mastering Liquidity Dynamics: Understand the Dynamic True ValueDear Reader,
Thank you for reading—your time is valuable.
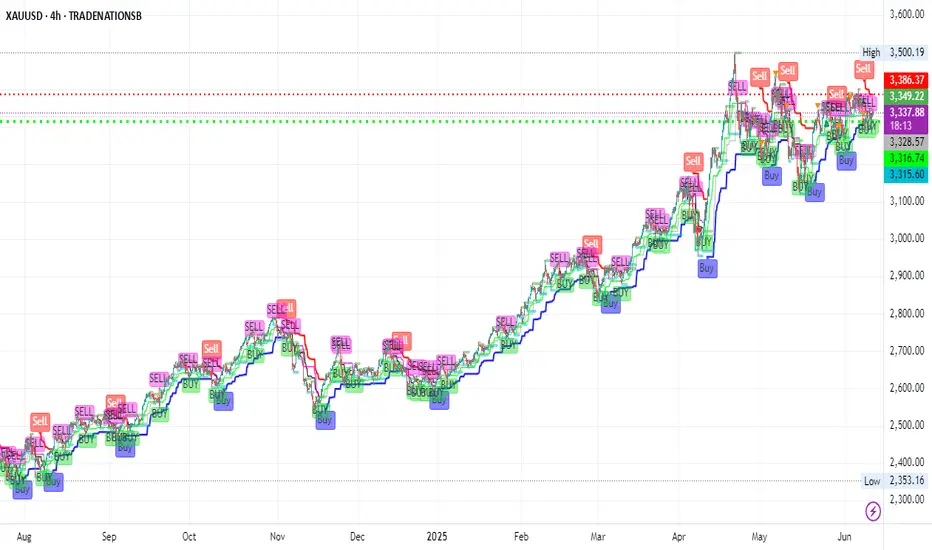
Use the chart's zoom-in/out (-/+) function for better visibility. This chart captures a large sample for your evaluation.
Below is the manual detailing the Smart Farmer System —a Dynamic True Value framework derived from real-time data to anticipate market intent and liquidity behavior .
If this resonates with you, drop a comment below— constructive insights are always welcome .
The Dynamic True Value - a Smart Farmer System: Terminology and Mechanics
: For now, I have firmed up POC - Price of Control, VAP - Value Average Pricing, SULB - Sell Upper Limit Bound, BLLB - Buy Lower Limit Bound.
Mechanic:
POC - Where fair value price dynamic is read.
VAP - Trading above indicates bullish sentiment of the cycle, and the opposite for bearish sentiment.
A crossed over of:
Grey POC above Green VAP - Signaling distribution, accumulation, consolidation, build-ups, correction, retracement .
Green VAP above Grey POC - Bullish strength and momentum consistency .
Pink VAP above Black POC - Bearish strength and momentum consistency .
Flip of Pink VAP to Green VAP - Sentiment flips from bear to bull, and the same goes for green flip to pink showing bull to bear.
Validation of entry signals requires:
Signal's candle must close past the opposite side of POC – flip sentiment .
The confirmation candle (is the closed next candle immediately after entry signal candle) must continue closed past the POC – maintain sentiment .
The progress candle (is the next candle closed right after the Confirmation Candle) shows traction, momentum build-up, and volume consistency .
Hint of invalidation:
Signal's candle is considered void if the next candle prints a new entry signal in the opposite direction. This often signals accumulation, sideways movement, build-up, uncertainty, or swings in range .
The immediate next candle closed past POC to the opposite side.
What to understand about Liquidity Trap, SULB, and BLLB:
Liquidity traps
Often occur at the recent/previous flatlines of Dynamic True Value (POC, VAP, SULB, BLLB) .
It is worth paying attention to the market’s intent and institutional positioning.
Signs of exhaustion, absorption, inducement, offloading, and accumulation are visible in the M1 (one-minute) TF, with significant confluence near the previous/recent flatlines of Dynamic True Value in the higher/macro-TFs.
An Anchored VWAP tool can be helpful for filtering noise in the market. This tool can be found in the drawing tab in the TradingView platform.
SULB
Details the dynamic of upper resistance where Bears remain in control below the dynamic level.
Below this limit bound (LB) , bears show strength – bear sentiment .
A converging price toward this LB indicates bulls are present.
Moving past this LB (a candle closed above) and successfully RETESTING newly formed support indicates a confirmed directional shift . Followed by printing a new BLLB in the next following candles with price continuing to rise above this failed SULB.
A rejection below LB (a rejection/exhausted candle closed below LB) and successful RETEST reaffirms the resistance holds , indicating downside continuation .
BLLB
Details the dynamic of lower support where Bulls remain in control above the dynamic level.
Above this LB, bulls show strength – bull sentiment .
A converging price toward this LB signifies bears are present.
Moving past this LB (a candle closed below) and successfully RETESTING newly formed resistance indicates a confirmed directional shift . Followed by printing a new SULB in the next following candles with price continuing to push lower below this failed BLLB.
A rejection above LB (a rejection/exhausted candle closed above LB) and successful RETEST reaffirms the support holds , indicating upward continuation .
Important Notes:
Select preferred Entry’s Signal TF (ex. M3 TF, M5 TF for scalping strategy, M15 for intraday/daily strategy, 4H TF for day-to-weekly strategy, etc.).
Always refer to the selected Entry’s TF for trading progress. Anticipate TP and SL by watching the range in this TF.
Non-entry TFs are not for entry purposes. These multi-TFs are used for measuring strength, momentum, liquidity, positioning, structure – The market intends . The Non-entry TF is used to anticipate institutional executions and liquidity pools.
These criteria MUST BE MET. A failed criterion suggests vague execution. Be patient and wait for clear validations.
Institutions excel in creating illusions.
SFS is designed to stand ready, calm, and execute with Clarity.
SFS cuts through noise, distraction, and stays independent of NEWS, GEOPOLITIC, RUMORS, and herd mentality because all these are designed to mislead retail traders into institutional traps.
When we see such ambiguity against the criteria, we know not to fall into the TRAP and become the liquidity FUEL.
Stay sharp, only respond when signals are firmed. SFS is designed to counter Smart Money capitalism. It is about time to level the playing field.
Liquiditymethod
Liquidity - How to easily spot it!Here's how you can easily use liquidity to create wealth 🤑
Knowing how to identify liquidity is an important aspect of trading that shouldn't be overlooked, BUT contrary to popular belief, it's not the greatest thing since sliced bread...
It does have its significance and it's place, but understanding WHY "liquidity" is formed is more important than the WHERE ...
Once you know why, you can slay hard every single day!
Follow me for more educational posts and market analysis:)
Anyway, that's all for now,
Hope this post helps and as usual...
Happy Hunting Predators
🦁🐯🦈

Learn to identify liquidity levels. Before we begin, we need to understand what liquidity is.
A market with high liquidity is one where there is a large number of buyers and sellers willing to trade in that particular asset. This means that there is a high availability of buy and sell orders, allowing transactions to be executed quickly and with minimal impact on prices.
Where are the most liquid points located on a chart?
These points are found at the highs and lows. This is because at these points, many people are waiting for the zone to act as support or resistance, or for the price to break the zone (breakout) to continue its direction. I always use daily, weekly, and monthly timeframes to identify these zones.
Why the liquid points are importante on a chart?
Liquidity is extremely important because it is the direction in which the price moves. The price will always move towards these points to attract liquidity to the market. Without liquidity, financial markets cannot function.
Which indicator can you use to identify liquidity levels?
Previous Days Week Highs & Lows by sbtnc
Certainly, this indicator will facilitate the process of identifying these points, but it will not identify all of them.
-----Remember, like everything in trading, this needs to be combined with other confluences. It won't work by itself.-----
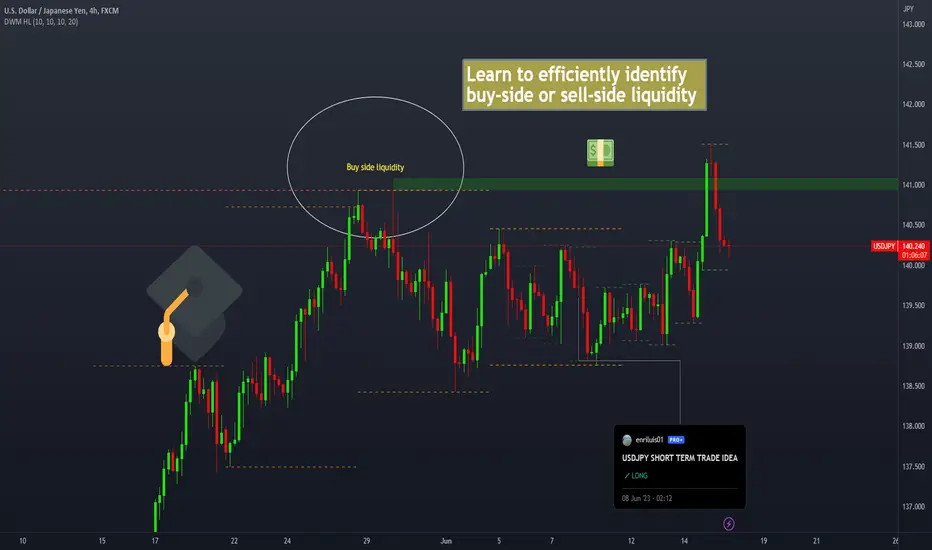
Explanation of the example presented in the chart.
I had some strong confluences indicating that the price was likely to have a bullish move. As seen in the COT report, there was aggressive selling of JPY. One of the things that helped me take this trade with confidence is that, as you can see in the circle, there was a weekly and monthly high together without being cleared. This created a double top pattern. Since this was such a liquid point, it gave me the confidence that the price would move towards this point before changing direction. And it did exactly that after consolidating for several days. These liquidity points can be used as confluence in our analysis, as well as a potential take profit level.
LESSON 1: TRADE THE LIQUIDITY OR BE THE LIQUIDITYWhat is Liquidity in Forex Trading?
Liquidity is the presence of orders at specific prices in the market, ensuring that transactions can take place without disruptions. When traders talk about liquidity, they are usually referring to the resting orders in the market. These orders can be absorbed or targeted by banks and financial institutions (BFIs) to influence the patterns of price movement. Liquidity can be found throughout the market, although certain areas may have higher levels than others. The good news is that it is indeed possible to learn how to identify and recognize liquidity patterns.
Liquidity comprises a variety of orders that gather in the market, including limit orders, stop loss orders, and stop limit orders. These orders come into play when prices reach specific levels of supply or demand in the market. Understanding liquidity is essential in comprehending how prices move.
Why do you need to understand Liquidity?
Liquidity is crucial for predicting price movements. Analyzing liquidity, along with market structure, supply and demand, and order flow, provides insights into potential price directions. It's important to consider liquidity alongside trend analysis and supply and demand to understand market conditions effectively. Highly liquid markets can be manipulated by large banks or institutions, leading to liquidity shortages, price slippage, and poor trade execution. Recognizing liquidity pools during slow sideways price movements is key.
What are the main types of Liquidity in Forex trading?
1. Buy-side liquidity (see chart for example)
Buy-side liquidity refers to the accumulation of orders above a range or high, including buy-stop limits and stop losses placed by sellers and breakout traders. Banks and financial institutions (BFIs) may target these orders to fuel temporary or sustained bullish price movements.
2. Sell-side liquidity (see chart for example)
Sell-side liquidity refers to the collection of orders situated below a range or low, including sell-stop limits and stop losses placed by buyers and breakout traders. Banks and financial institutions (BFIs) can target these orders to generate temporary or sustained bearish price movements. Similar to buy-side liquidity, sell-side liquidity serves a crucial role in the market dynamics.
Do you have any questions? feel free to ask.
Cheers,
David

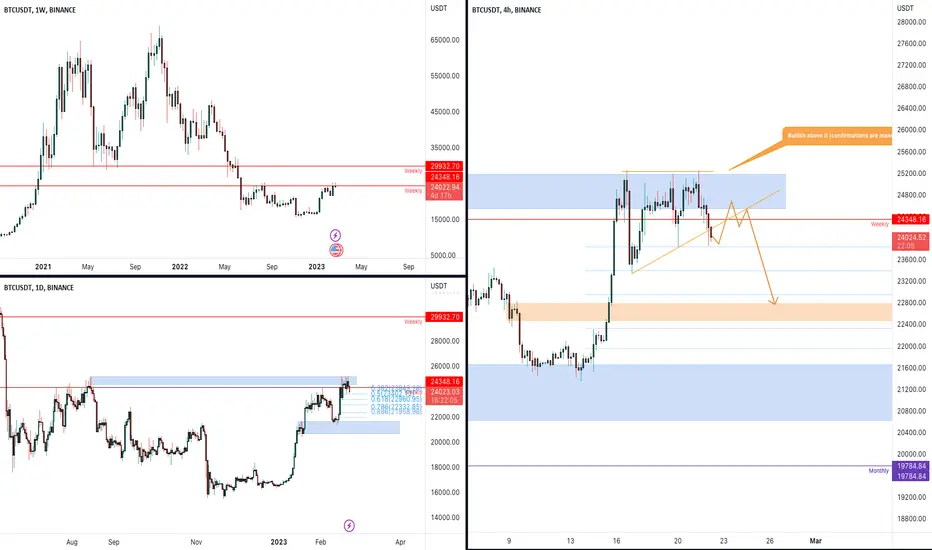
BTCUSDT time to retracement?Recently, the market has created equal highs in the 25k area, where there is also a daily supply level. This indicates that there is strong resistance in this area, and that buyers have struggled to push the price higher.
However, there is potential for the market to grab new liquidity from the 22-23k area, where there is a 0.786 Fibonacci level. This level is often seen as a strong level of support, and if buyers are able to push the price higher from this level, it could signal a potential shift in market sentiment from bearish to bullish.
It's important to note that this scenario would only be invalidated if the price were to create a breakout from the 25k area with confirmations. A breakout above this level could indicate that buyers are able to overcome the resistance in this area and push the price higher.
–––––
Follow the Shrimp 🦐
Keep in mind.
🟣 Purple structure -> Monthly structure.
🔴 Red structure -> Weekly structure.
🔵 Blue structure -> Daily structure.
🟡 Yellow structure -> 4h structure.
⚫️ Black structure -> <= 1h structure.
Follow the Shrimp 🦐
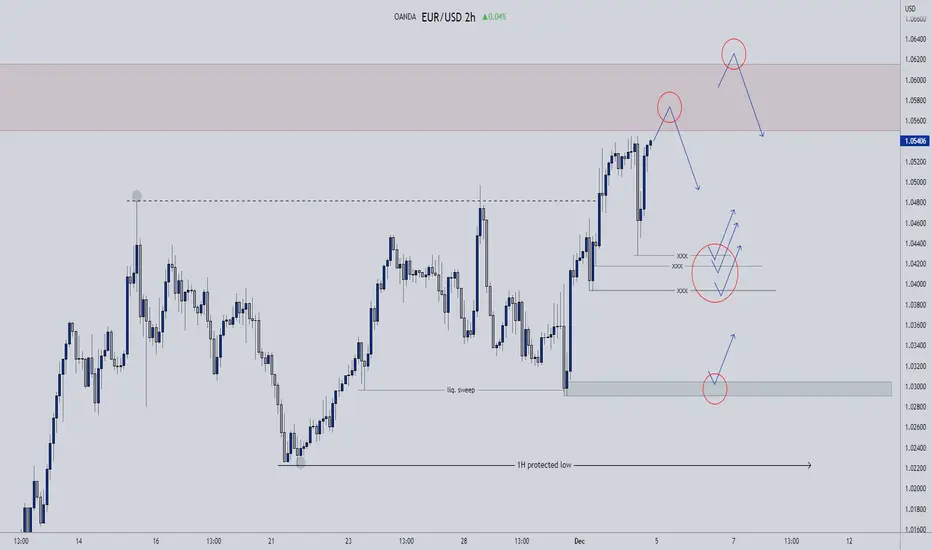
Interesting points in marketIn my opinion places that i draw on chart can be a nice opportunities for some trade setup on LTF. Hard to say market direction for now because we have a lot of upside movement recently. Supply that we actually approaching can send us at least make pullback, but if market want to go up, values where is resting liquidity, marked xxx on the chart can be nice turning points.
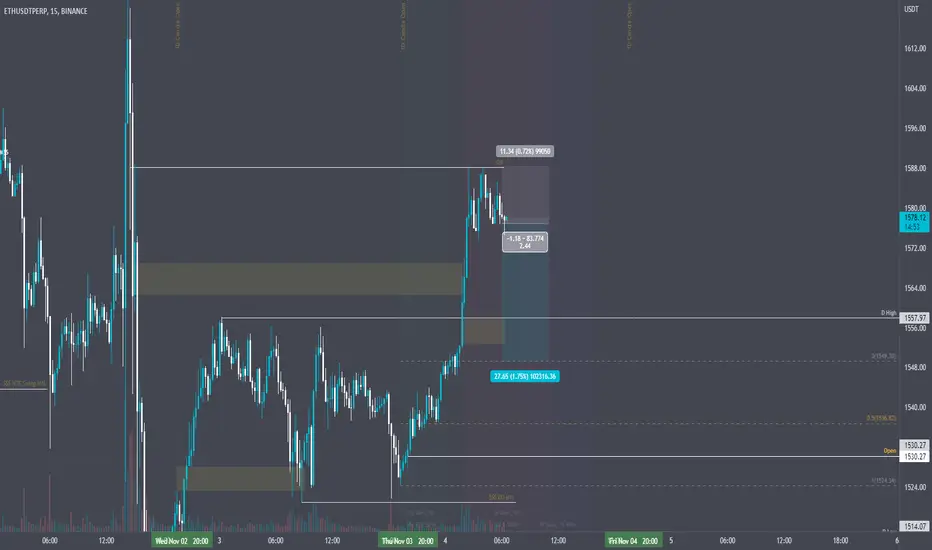
ETH SHORT Scalp London OpenDay's Bias: Neutral Bullish
Plot:
A Possible Counter Trend Setup to scalp internal liquidity. Price hits a -OB then occurs a short entry setup to seek lower prices and internal liquidity.
Price left the Asian Range as a continuation of previous day's price action.
Price leaves FVGs close to today's Asian Range High.
Target's can be the FVG or Asian Range High, may possibly reach for Asian Range 50%.
Price may continue to drop to lower prices already taking out HTF external liquidity, specially as we get close to the weekends.
Strategy: Asian Range Implementation + London Open Setup.
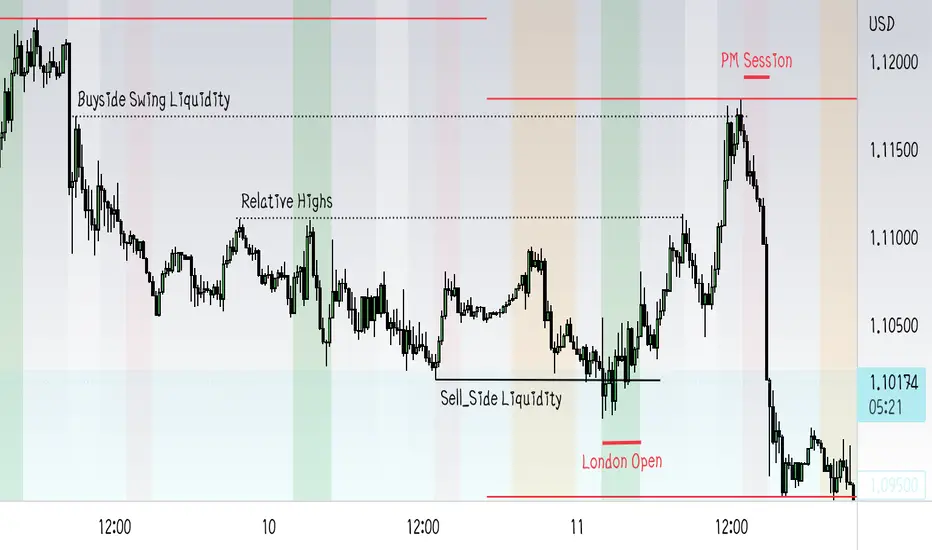
Zoom In And Learn! GBPSUD Yesterday's Trade AnalysedGBPUSD yesterday's trade was very good and I anticipated it since the day before yesterday..
You can see on the chart the following:
We had a level of "Sellside liquidity" and the price reaching just before London Open.
Price showed strength and confirmation for entry, targeting, first, the Relative Highs, and next, the Swing Buyside Liquidity to which the price reached up and reversed (we closed position a bit after that)..
DXY was confirming the move..
Would be happy to hear from you in comments 😊
Stay Sa£e & &ood Tradin&
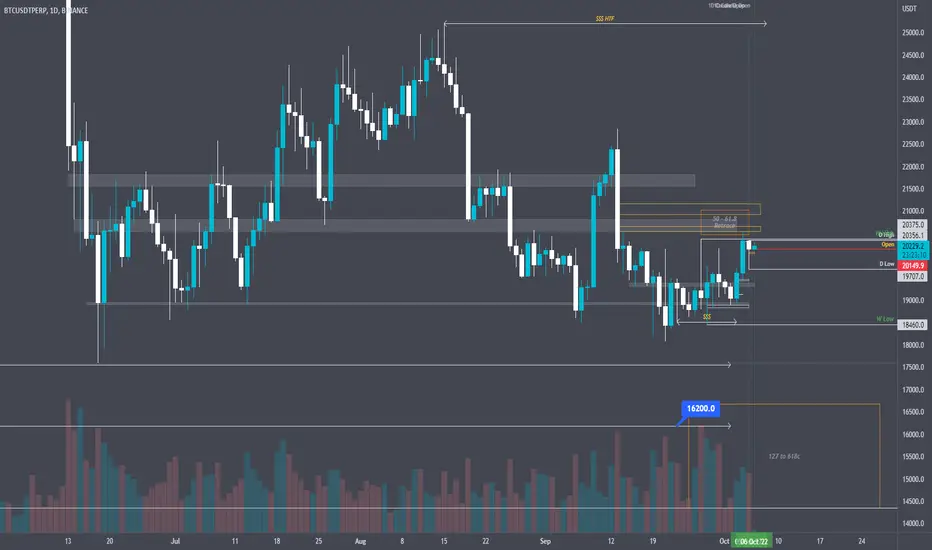
BTC SHORT gearing towards $16200Market still taking out internal Longs and keeping external Shorts. No good price action to break an external Buy side High. Not a single good support below $18000 anymore after price took out close by liquidity below $17600. A clue that the market will more likely seek more Sell side liquidity and consolidate to fuel a major market structure break.
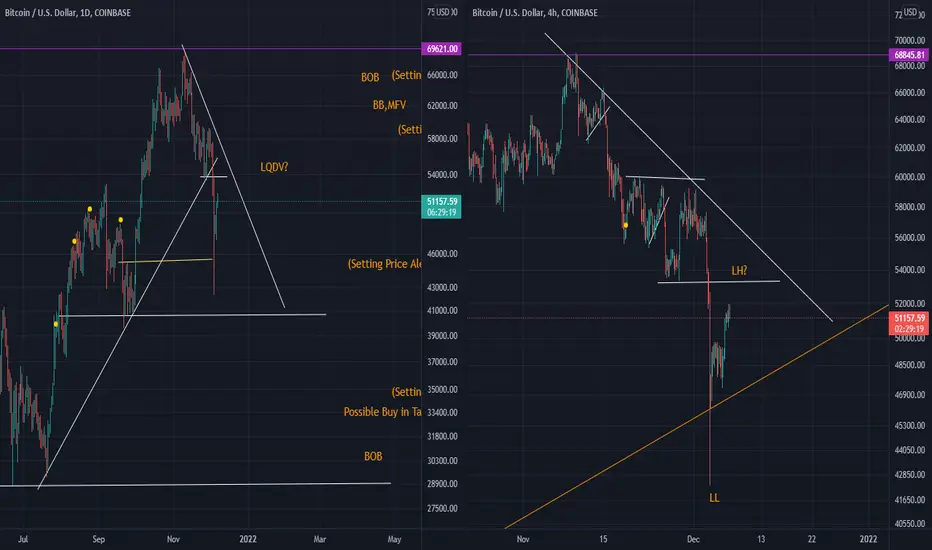
BTCUSD DEC2021BtcUSD, currently following bearish trends and structures. As long as the structure holds thinking price will target the lower price target and fill in the mpib and possibly test the b. ob. then return to mfv testing the bb. (Setting price Alerts at each target area.)
BTCUSDT wants liquidity from 23k
The price is testing the monthly support on the 0.618 Fibonacci level.
The Market has two demand zones.
The first one between 30k and 20k, and the price could grab the new liquidity around the 23k for the reverse trade.
The second one is between 16000$ and 12000$.
How approach on it?
If the price is going to grab the new liquidity from the 23k demand zone, we could see a new pullback after a new breakout of 30k. According to Plancton's strategy , we can set a nice order
–––––
Keep in mind.
🟣 Purple structure -> Monthly structure.
🔴 Red structure -> Weekly structure.
🔵 Blue structure -> Daily structure.
🟡 Yellow structure -> 4h structure.
–––––
Follow the Shrimp 🦐

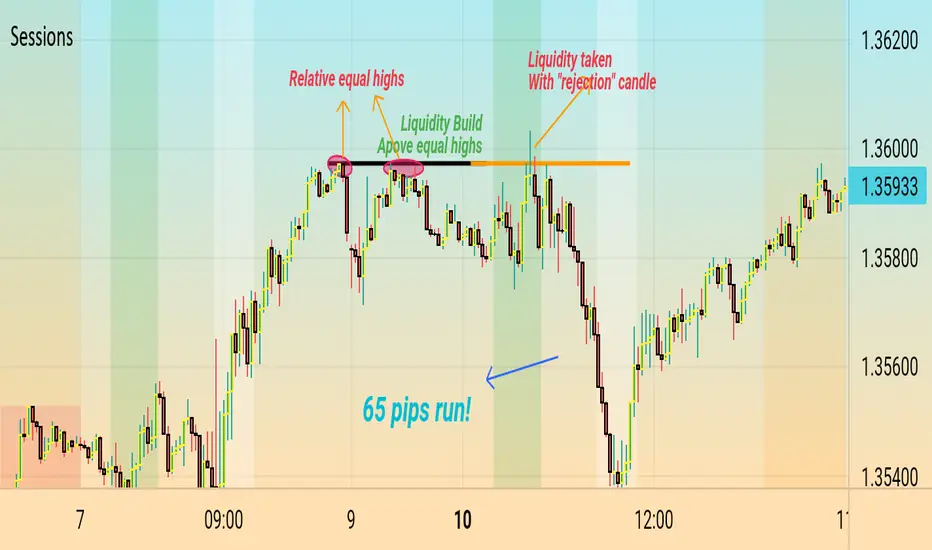
Only Strategy You Ever Need! .. Liquidity Build&SweepHello everyone!
Liquidity is the main force that moves all markets, understand it well, and everything becomes clearer...
Liquidity, simply, is "where orders are resting". Sometimes it is clear, other times not. So you have to look really well into where we have relative equal highs (sell-side) or lows (buy-side).Does that mean to jump into buying below relative equal lows/selling above relative equal highs right away? Of course no. As explained above, most of the time we have an indication as to whether the Market is responding as it shouldmd or not. Like a rejection or multiple rejections or a candle pattern or whatever.. you should see and indiction in price action, not indicators. Also pay attention to time frames. Equal highs/lows should not be treated the same way in small and big time frames... At least 15-min timeframe is recommended...
Your comments are highly appreciated...
Please don't forget to ▶️ FOLLOW & ▶️LIKE if you found my tutorial a help to you... Great content is to come yet.. hopefully..
Thanks Guys!
$WKHS EV Vehicles and Drones Workhorse Group Inc., a technology company, designs, manufactures, builds, and sells battery-electric vehicles and aircraft in the United States. The company also develops cloud-based and real-time telematics performance monitoring systems that enable fleet operators to optimize energy and route efficiency. It offers electric and range-extended medium-duty delivery trucks under the Workhorse brand; and HorseFly Unmanned Aerial System, a custom-designed purpose-built all-electric drone system. The company was formerly known as AMP Holding Inc. and changed its name to Workhorse Group Inc. in April 2015. Workhorse Group Inc. was founded in 2007 and is headquartered in Loveland, Ohio.
