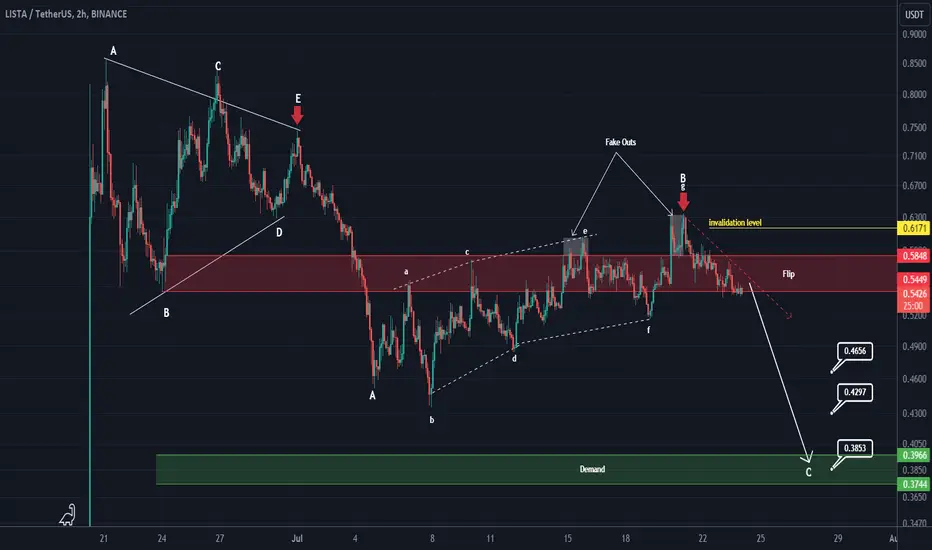
LISTA looks bearishFrom the left side of the chart, where the red arrow is, it looks like an ABC or more complex pattern is forming.
Wave B looks like a diametric that has ended.
Now the price seems to have entered wave C. Wave C is bearish.
Also, on the chart, we have a resistance flip range that the price has faked out twice and then rejected downwards.
Consolidation below this flip range will provide further confirmation for the drop.
Closing a daily candle above the invalidation level will violate the analysis
For risk management, please don't forget stop loss and capital management
Comment if you have any questions
Thank You
LISTAUSDT
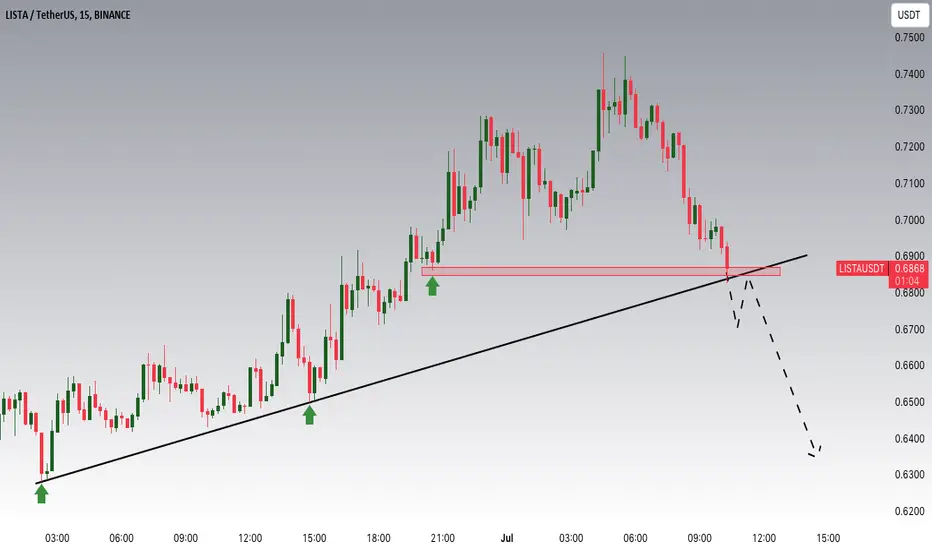
LISTAUSDT Is Atttempting To Breakout The TrendHey Traders, in today's trading session we are monitoring LISTAUSDT for a selling opportunity around 0.6850 zone, LISTAUSDT is trading in an uptrend and currently seems to be attempting to break it out. If we get dips below 0.6850 support we will be looking for a retrace of the trend towards more lows.
Trade safe, Joe.
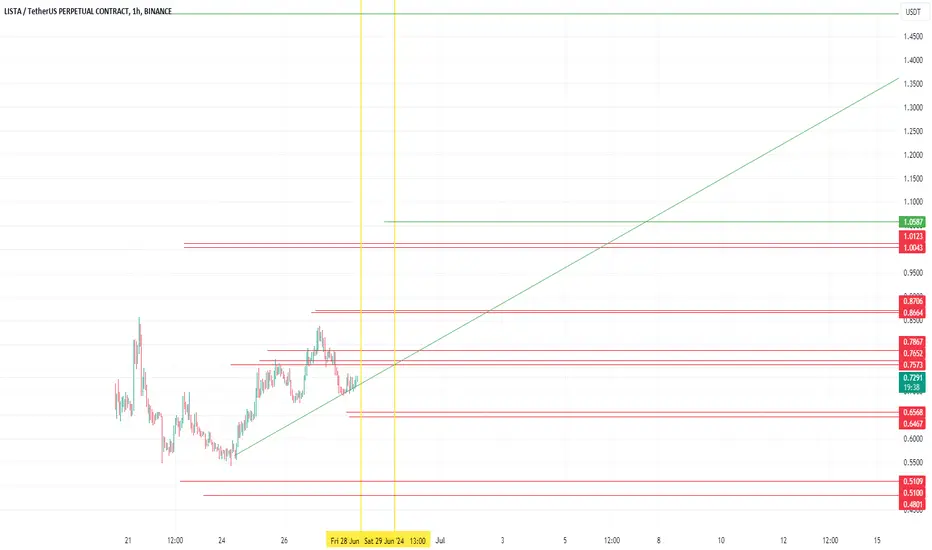
Lista chartLista key levels. Each horizontal line represents support and resistance with the green lines representing ideal targets for a bull run. The green diagonal line is the support pushing the price up, when it brakes the price can go to the lower targets.
The vertical lines are trigger points for pumps or dumps.
This is done using an experimental method inspired by Da Vinci. This is not financial advice.
LISTA LISTA failed order block (3) and moving upside. But not moving deeper upside. So it's indicating still LISTA bearish.
Order block (1) is next support zone. If this zone was fail, LISTA moving downside.
