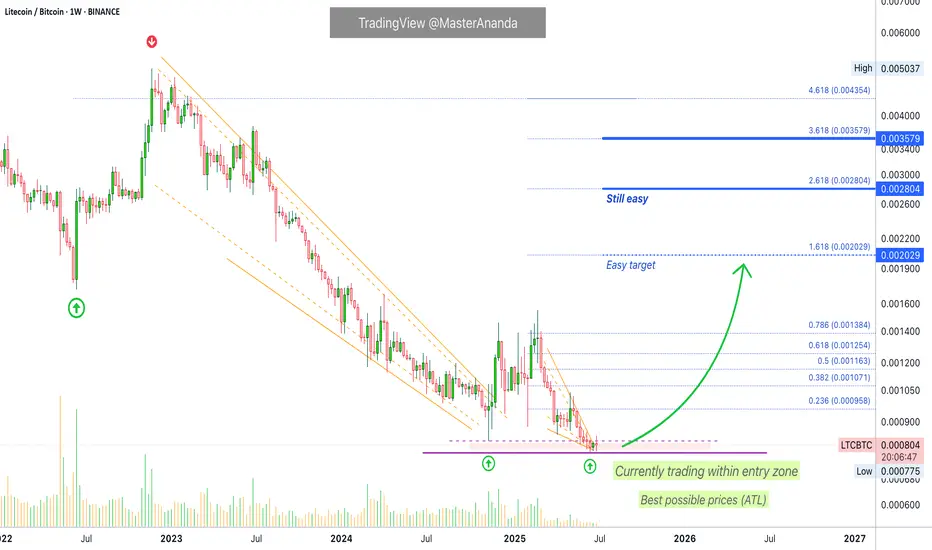
Litecoin vs Bitcoin —The Institutional Wave? Consider the ETFsStarting November 2022 LTCBTC (Litecoin vs Bitcoin) went on a major downtrend, until November 2024. After November 2024 this downtrend is no more.
There was a bounce late last year and this event changed the chart. The latest low last month, June 2025, ended up as a technical double-bottom. Less than 5% below the November 2024 low and this low happened after 217 days. This means that in seven months sellers became exhausted and they couldn't produce a new major low. This reveals that the bearish trend is over. Once the downtrend ends, we get a change of trend, a change of trend implies an uptrend, an uptrend implies long-term growth. We are looking at a long-term bottom and... From the bottom we grow.
This is not an opportunity that presents itself often. The BTC trading pairs are hard to trade. These are for experts only. A new opportunity is developing that can lead to exponential growth. It is amazing how this section of the market works. LTCBTC will grow as Bitcoin and the rest of the market grows. This tends to produce a multiplier effect that is hard to explain. You will understand when you see it in action.
LTCBTC is hitting bottom. The bottom is already established, several weeks old. The candles low is flat, we can expect massive growth; excitement and institutional adoption on Litecoin thanks to the ETFs, it will be the first time this pair grows in years and the type of chart it will produce it is hard to tell.
We are entering uncharted territory. The bullish phase can be mild just as it can be ultra-strong. There is no limit to the upside. It can grow for years or for 4 to 8 months. Both scenarios look good.
The best part is to catch the bottom; an early wave. Prices are low now, easy to buy and hold. Focus on the long-term.
Litecoin has good potential for this incoming 2025 bull market.
Thank you for reading.
Namaste.
Litecoinetf
Will The LTC-USD ETF Be Approved? LTC Breakout?1. Trend Analysis:
o Price action shows an upward breakout, supported by the Bollinger Bands widening. This is a sign of increasing volatility with a potential bullish continuation.
o Historically, LTC tends to consolidate near the middle band before significant breakouts toward the upper band.
2. Volume: Very important this is the basics
o Increased volume supports the current price breakout, providing confirmation of the move's strength.
Key Levels:
• Support: Middle Bollinger Band (~$117), acting as a dynamic support level.
• Resistance: Upper Bollinger Band (~$140+), which may act as a short-term resistance. This analysis shows profit above 140 as a target, I think it could go as high as $300-$400 after the Litecoin ETF is approved*. (If Approved)
Actionable Insights:
• Bullish Scenario: If LTC-USD continues trading near or above the upper Bollinger Band, it could signal further bullish momentum. Traders might look for breakouts above recent highs. I’m not a trader but a swing trade here over a few weeks could be a good payoff.
• Bearish Scenario: A reversal or sell signal on the DeMark 9 indicator, coupled with price closing below the middle Bollinger Band, could suggest a trend change to the downside.
