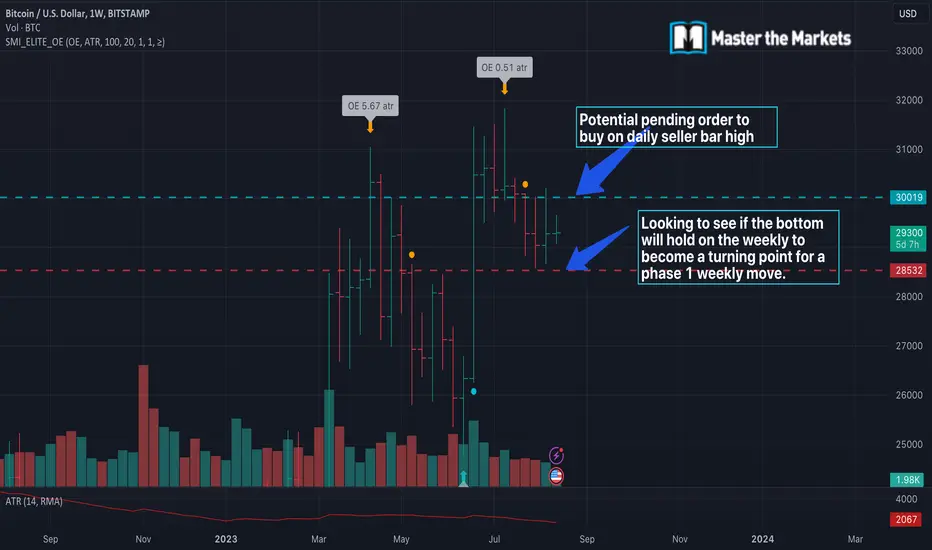
Is BTCUSD low at 28477 going to hold and become a W bottom(3)This is in reference to our previous ideas of looking at a potential entry on 4h and daily timeframe to capture a weekly Phase 1 turning point. The rationale is based on our smart money framework and indicator.
The last weekly potential bottom has not held and price is going further down.
Lets wait and see if this week's bottom holds. Our first point of consideration is when the 4h or the daily bottom confirms by the SMI backed by VSA. The critical level to observe is 24756 as in the chart image. if that is broken,trend changes and it will be a downtrend.
Refn images and links from our previous ideas are as below.
Livetrading

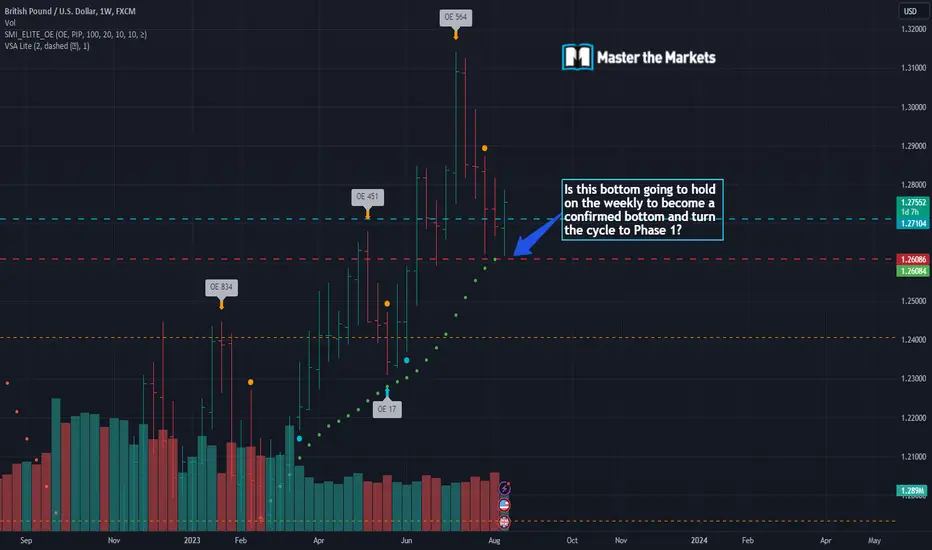
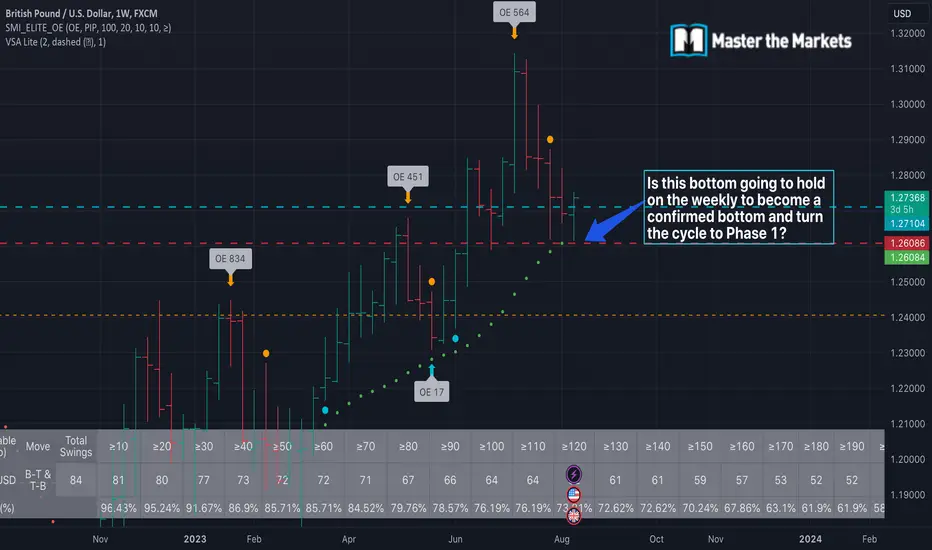
Is GBPUSD low at 1.2616 going to hold and become a W bottom(6)This is in reference to our previous idea of us entering on the 4H timeframe bottom confirmation towards a daily bottom and then a weekly bottom to confirm. It was entered based on price and volume spread analysis rationale and the cycle framework methodology by the smart money indicator. Please refer to our reference videos below.
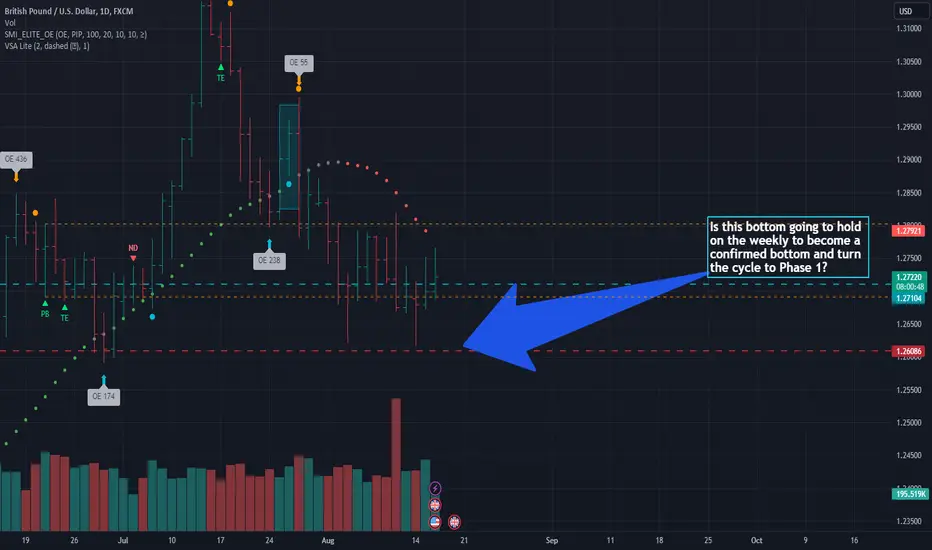
As of today, the trailing stop loss based on the daily timeframe got hit. We successfully captured a 4h bottom holding onto to become a daily bottom. However, the daily bottom did not hold to become a weekly confirmed bottom as today's massive seller bar took out the daily low. By understanding the cycle and smart money framework, we are not put off by this loss but see it is as one of many trades for the strategy edge to work out over the the law of numbers. The sequence of trading events are shown by the numbered points on the chart from the time we entered to the time we exited.
Here is the reference image of the trade we initially took.
All reference ideas and images are as below.
If you have any questions or comments, list them below.

Is GBPUSD low at 1.2616 going to hold and become a W bottom(5)This is in reference to our previous idea of us entering on the 4H timeframe bottom confirmation towards a daily bottom and then a weekly bottom to confirm. It was entered based on price and volume spread analysis rationale and the cycle framework methodology by the smart money indicator. Please refer to our reference videos below.
As of today, the bottom on daily timeframe confirmed yesterday. Good job on those who stuck on the trade despite the selloff on friday last week. We have now successfully captured a 4h bottom holding onto becoming a daily bottom by understanding the cycle and smart money framework. Now,we will manage the trade on daily timeframe till it confirms its bottom on the weekly timeframe. Let's wait and see. Patience is virtue.

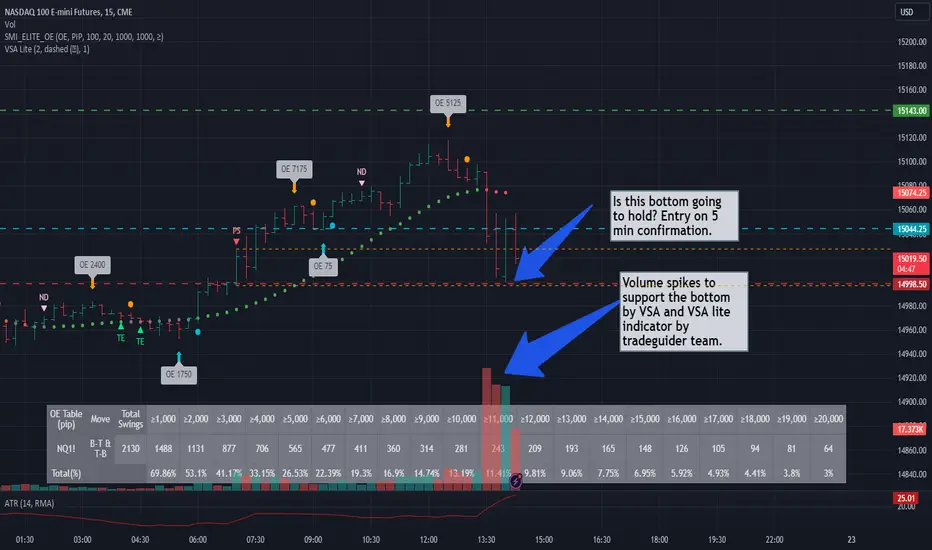
Is E-mini futures 15min bottom going to hold for Daily RangeWe are looking at a potential entry on 5min bottom confirmation by the Smart Money and the VSA lite indicator. It is supported by the volume spikes as you can see on the chart image for the 15min bottom to hold. We are looking for price to go upward and hit the target in regards to capturing the daily ATR range. Reference videos to watch are the stretch principle videos originated by institutional quant traders which are included below.
Live Trading Session 234: Potential Trades on GBP,Brent & moreIn this live trading session video,we look at potential trades setting up for the week on GBPUSD,S&P 500,Brent Oil,Bitcoin and many more.

Is GBPUSD low at 1.2616 going to hold and become a W bottom(4)This is in reference to our previous idea of us entering on the 4H timeframe bottom confirmation towards a daily bottom and then a weekly bottom to confirm. It was entered based on price and volume spread analysis rationale and the cycle framework methodology by the smart money indicator. Please refer to our reference videos below.
As of today, the daily bar seems to be going against us. At this moment,most traders will panic and look to bail out of the trade. However, when you know your strategy rules and its edge over the law of numbers, you will stick in the trade. In this trade, till the potential daily bottom (as in the image below) is taken out, trade is still valid. We can look for potential trailing levels looking at the 4h timeframe.
Let's wait and see. Patience is virtue.
P.S. Remember that the principles from these ideas can be cross transferred to any strategy.

US30 weekly top overdue for a UT P2 moveWe are waiting for the the top to confirm on the weekly timeframe on US30. Once top confirms, this will be a weekly P2 move on US30. Then we will be looking at the daily timeframe for bottom confirmations to ride the P1 move on weekly. We are following the smart money framework based on cycles and the volume spread analysis methodology to capture the turning points in the market and to ride the big runners.
Please refer to our previous live stream video series on the cycle framework methodology.

Is BTCUSD low at 28477 going to hold and become a W bottom(2)This is in reference to our previous idea of looking at a potential entry on daily seller bar high to be taken out for price to continue further upwards and go onto confirm the bottom on daily and then weekly according to our smart money framework and indicator.
The bottom has not held and price is going further down. The trade is now invalid and the
order will now be cancelled. Refn image from our previous idea as below.

Is GBPUSD low at 1.2616 going to hold and become a W bottom(3)This is in reference to our previous idea of us entering on the 4H timeframe bottom confirmation towards a daily bottom and then a weekly bottom to confirm. It was entered based on price and volume spread analysis rationale.
As of today,the daily bar seems to be going in our favour for the 4th day in a row. Let us see if the bottom confirms on the daily today according to the Smart Money framework and indicator.
If it does, we would have got the 1st part right of the 4h bottom confirming to become the daily bottom and then the last part which we need to see if it goes to confirm the weekly bottom.
Refn Images as below.
Waiting for EURUSD weekly top to confirm before trading P1 moveWe are looking to capture a weekly P1 move on EURUSD after the top confirms on the weekly timeframe. We are following the smart money framework based on cycles and the volume spread analysis methodology to catpure the turning points in the market and to ride the big runners.

Is GBPUSD low at 1.2616 going to hold and become a W bottom(2)This is in reference to our previous idea of us entering on the 4H timeframe bottom confirmation towards a daily bottom and then a weekly bottom to confirm. It was entered based on price and volume spread analysis rationale. Let us check and see if the bottom confirms today according to the smart money framework. So far, the daily is going in our favour.:)
Refn Images as below.
Is BTCUSD low at 28477 going to hold and become a weekly bottom We are looking at a potential entry on daily seller bar high to be taken out for price to continue further upwards and go onto confirm the bottom on daily and then weekly according to our smart money framework indicator.
BTCUSD(Long)
E - 30035
SL - 28476
T - To be confirmed(TBC)
We will be tracking this move and updating the post as we go along on the charts and on video. Keep a look out for it traders.
Is GBPUSD low at 1.2616 going to hold and become a weekly bottomWe are looking at a potential entry on 4h bottom confirmation according to our smart money framework indicator and for it to go onto confirm the bottom on daily and then weekly.
E - 1.2711
SL - 1.2615
T - To be confirmed(TBC)
We will be tracking this move and updating the post as we go along on the charts and on video. Keep a look out for it traders.
Live Trading Session 233: Gold trade closed & Potential Tradesn this live trading session,we look at why we closed the trade on Gold and potential trades setting up for the week on GBPUSD,S&P 500,Brent Oil,Bitcoin and many more.

Live Trading Session 232: 1 open Gold trade & Potential TradesIn this live trading session,we look at how to manage our open position on Gold and potential trades setting up for the week GBPUSD,S&P 500,Brent Oil,Bitcoin and many more.

HOW-TO:How much move is left upon point of entry(OE)In this video,we look at our invite only script of Smart Money Indicator(SMI) Elite OE and how it helps us determine how much move is left upon point of entry(aka OE) on a statistical probability basis. The SMI is not a buy and sell indicator. SMI quantifies the tops and bottoms to give you a solid structured framework to design robust strategies on. Please refer to our 7 steps to consistent trading performance videos on our trading view channel to understand further the methodology and reasoning behind the SMI which was developed in the 1960s by institutional quant traders.
Refn Link: tradingview.sweetlogin.com

Live Trading Session 231: 1 closed and 1 open Gold tradeIn this live trading session,we look at potential trades setting up for the week and open positions on Gold,GBPUSD,S&P 500,Brent Oil,Bitcoin and many more.

Live Trading Session 230: 3 closed and 1 open trade,SMI and VSAIn this live trading session,we look at potential trades setting up for the week and open positions on Gold,GBPUSD,S&P 500,Brent Oil,Bitcoin and many more.

Live Trading Session 229: Trade setups,Open trades,SMI and VSAIn this live trading session,we look at potential trades setting up for the week and open positions on Gold,GBPUSD,S&P 500,Brent Oil,Bitcoin and many more.

Live Trading Session 228: Trade setups,Open trades,SMI and VSAIn this live trading session video,we look at potential trades setting up,open positions on Gold and Ethereum along with the SMI and VSA methodology.

3 Types of Stop LossesToday’s topic is going to be on three types of stop losses . This is a very critical topic because stop losses come under the category of risk management.
Risk management is such a pivotal, important and critical topic. Why? Because professional traders and investors, the first thing that they always do and constantly think about before they get into a trade or investment is not how much profit they’re going to make, it’s how much they can afford to lose.
The only control that you have when you enter into a trade and you’re in the trade is the risk factor because most of us will not have the capital power to control that trade. It’s a collective pool of people’s thoughts and a lot of other factors that come in which then determines how the price moves in the market, especially how smart money enters the market actually. So in light of all of that, the real power that you have, the real control that you have is your risk management. How much you can afford to lose. In terms of that, we’re going to be looking at the three types of stop losses and how to stop your loss when the market does something which is not favourable to you and not in line with the direction of the trade that you are taking on.
The first type is what we call the technical stop . This is the one most people will be familiar with. That’s where all your different kinds of stop losses come under: moving averages, channels, trend lines and so forth. All these are summarised under technical stop losses. Even if you use tier based stop losses, they come under technical stop losses.
The second one is called a money stop . A money stop is basically one where you write in your rules, and this is how you execute a trade as well is that you say, for example, you enter a trade and it is going well in profit. You tell yourself to trail your stop loss to break even as soon as the trade is 3% in profit. You don’t care what the moving averages are or where the price pattern is whatsoever, you would just move your stop loss to break even. So that is purely based on money. That is called a money stop because the stop loss is adjusted according to your profits or your losses. Usually it’s to your profits – that’s when you trail and adjust your stop loss.
The final one is the time stop . As you’ve already guessed, the time stop is based on time. Especially for intra-day trading it’s very important because you know certain times of the day volume is really high and other times of the day volume starts to dry up. So especially if you want to capture a certain percentage of move, you want to capture it before a certain time and you usually know that after 5pm or 6pm the volume usually dries up. Price movement is not really that much especially towards 9pm. So you can have a rule saying, for example, at 5pm or 6pm you’ll look at exiting a trade if it’s not reached an objective. If you’re a swing trader you start saying things like you know if it’s consolidating for 10-15 days in a row I will possibly exit out of the trade. So all that is basically based on time.
Let me ask you a question. Out of all the three stops I’ve talked about: technical, money and time, what do you think is the strongest stop of them all? I think, if my guess is right as we have coached thousands of traders, most of them usually tell me it’s either the technical or the money stop. In fact, let me tell you Traders, the weakest one of them all is the money stop because there’s no basis for it. It’s just based on money and just trailing it. The strongest is the time stop because everything is determined on time and you’re time bound in everything that you do. If you look at daily activities: waking up, going to work, having meals, going to bed – your life is time bound.
Here’s the final most critical point. If you actually want to make your risk management really strong, the trick is not to put emphasis on either one of them according to strength, but to make them sync with each other so that they can then adapt to market conditions. It’s basically a confluence of the types of stop losses that can help you to generate the rules which can adapt to market conditions. For example, when you start out if you put in your initial stop loss in a technical place and as time then moves by then you would then get more aggressive with your stop loss and as it’s nearing towards exit, if you’ve reached a certain profit potential as the market price is still hovering around, losing momentum, then you would then start to go into money stop. Money stop is especially useful if you’re in swing trading. For example, when we took the DOW Jones trade and we took that 2,000 point move on a mismatched strategy when it had already done 80% of the move we used a money stop because we don’t want to give back all that profit back to the market. So that’s when we start to us a money stop and a combination of time stop, initially starting with a technical. So that’s how you do it.
Do have a good think about this because this is so critical Traders. If there’s only one thing you have total control of, it’s your stop loss, it’s your risk management. So contemplate this, revisit your strategy rules and see how you can optimise that for maximum performance of your strategy.
I believe that you have really enjoyed this topic and have some amazing value from this. Until the next time, as we always say, stay disciplined, follow your trading plan and keep trading like a master .

Live Trading Session 227: Trade setups and Open PositionsIn this live trading session,we look at potential trades setting up for the week and open positions on Gold,GBPUSD,S&P 500,Brent Oil,Bitcoin and many more.

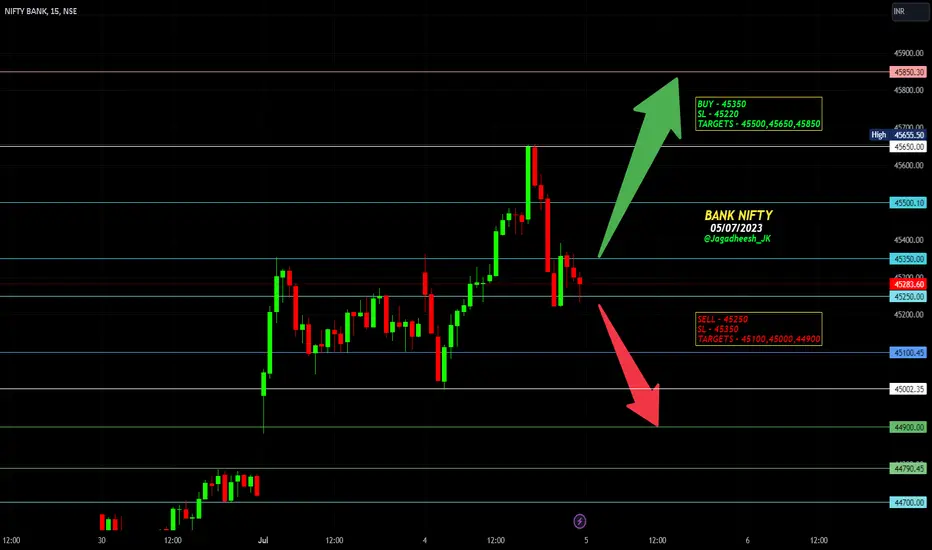
BANK NIFTY ANALYSIS - 05/07/2023BUY ABOVE - 45350
SL - 45220
TARGETS - 45500,45650,45850
SELL BELOW - 45250
SL - 45350
TARGETS - 45100,45000,44900
Disclaimer - All information on this page is for educational purposes only,
we are not SEBI Registered, Please consult a SEBI registered financial advisor for your financial matters before investing And taking any decision. We are not responsible for any profit/loss you made.
HAPPY TRADING GUYS