Location, Location, Location!!!Knowledge is Power!
But how deeply do most people really understand this?
The average mind thinks power comes from possessing knowledge. But here’s a deeper truth — simply imagining yourself with mastery can trigger powerful feelings. Why? Because as Terence McKenna once described, the human brain is a chemical factory. An inspired thought — a glimpse of future achievement — can activate a cocktail of serotonin and dopamine, giving us a real sensation of power. And yet… did anything really change?
This is where ancient voices — shamans, philosophers, and modern mentors — whisper:
“You are already there…”
But are you really?
The answer is Yes… and No.
You feel the outcome, but you haven’t earned it yet. You’re not truly there until you’ve gone through the effort — the hours and hours of disciplined study, reflection, and ignoring the mental traps like “take a break,” “you have time,” or “scroll a bit.” Power, in this case, is the Knowledge itself — and to approach Power, you must become Power. Or else, it will crush you — like a boot crushes an ant. (Yes, that’s borrowed from the Avengers… we all need a laugh too.)
To actually reach that imagined reality, you must prove yourself to the knowledge itself. You have to earn it — through discipline, sacrifice, and unbroken focus. That means hours of study, observation, application, and repetition — no matter how many distractions your mind throws at you.
Focus on one subject until it bends for you.
Focus like your life depends on it.
Because in a way… it does.
🧠 Opportunity Cost = Power Equation
This focused, intentional work is what economists call Opportunity Cost. It’s the measure of how productively you spend your time. Every marked level, every reaction, every shift in volume is either:
• A step closer to mastery, or
• A missed opportunity, depending on what you choose to focus on.
TradingView becomes your journal.
A sacred workspace in the chaos.
A tool to track your evolution — mentally and technically.
🔍 The SHIBA/USDT 4H Breakdown
On the 4H chart of Shiba Inu, key swing levels are marked — targets that can serve as entry/exit decisions depending on your strategy.
But the magic is not in the lines.
It’s in how volume reacts to those levels.
🔺 Volume — The King
Currently, the 4H Volume shows signs of a bearish continuation. But lower timeframes are beginning to show the initial signs of accumulation — strength where weakness used to live.
This is the beginning of Effort vs Result analysis:
• Are we seeing strong volume but no progress? (Demand absorption?)
• Are we seeing low-effort pushes into supply that fail to break key levels?
That’s how Smart Money behaves. Quietly, strategically, and always one step ahead.
And all this happens near key demand/supply zones — where Location meets Volume.
🔄 Timeframe Psychology: Past–Present–Future
Lower timeframes = The Past (they push).
Higher timeframes = The Future (they pull).
Your active timeframe = The Now — where you make your move.
A shift on the 3M chart might hint, but until it aligns with the 1H or 4H, nothing is confirmed. That’s why true traders are observers first, executors second.
🎯 Alignment: Levels, Volume, Effort
• 📍 Levels: They are not just technical — they are psychological battlegrounds.
• 🔊 Volume: It shows us where energy is being spent and whether it’s paying off.
• 🧱 Effort vs Result: The ultimate measure of Smart Money’s hidden hand.
When everything aligns, you don’t guess — you act.
🧭 Final Thoughts
At the time of this writing — 17:26 IST on June 18, 2025 — the 4H chart remains bearish in tone. But markets shift fast, and for all I know, a power transition could be unfolding on a micro timeframe as I type. That’s the nature of this game.
TA is not rigid. It is an art.
And once mastered, it becomes a part of how you think — not just how you trade.
Use your time wisely.
Let your focus become your fortress, and that fortress will guard you through every storm.
Work Smart. Think Deep. Act with Purpose.
Study the Bitcoin and Bitcoin Dominance cycle to understand altcoin flow.
Explore previous posts — I’ve shared them to help you grow.
The market is a breathing organism, I’ve pointed this in previous ideas. If you’re in sync with it—you’ll feel it.
And for those who believe there’s more to learn—but are struggling to find answers—there’s no shame in asking questions. But remember, nothing in the market is free.
Work Smart, and you’ll earn the right to follow — and even think like — Smart Money.
Till next time, take care—and trade wisely.
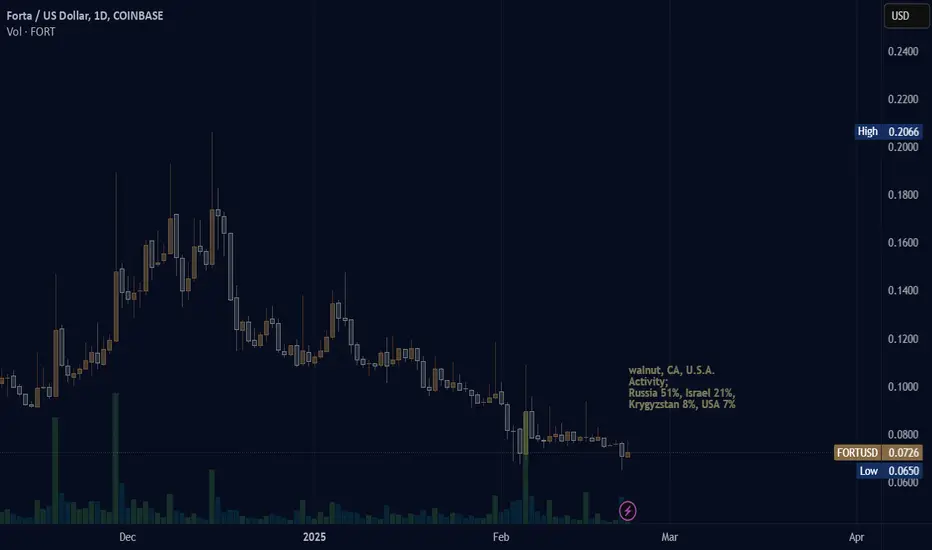
Location

(FORTA) fortaActivity update for forta. Change shows Russia with the highest activity and second is Israel. Both war nations, possibly usage is for the purpose done by people who hope to be protected by agencies that may invade, or perhaps by the people doing the invading.
(TIME) chrono.tech "activity in Nigeria"33% of activity on Chrono.tech (TIME) is currently found to be in the Nigeria location using crunchbase.com data provided by Semrush analytics.

Amazon Free Game Downloads for March Gameday Happens in Madden NFL 22. Dominate with Ultimate Team rewards for Prime members and check back each month to claim your packs. All-new features like Next Gen Stats star-drive AI and immersive Dynamic Gameday deliver the most authentic gameplay experience ever.
Surviving Mars
Surviving Mars is a sci-fi city builder all about colonizing Mars and surviving the process. Choose a space agency for resources and financial support before determining a location for your colony. Build domes and infrastructure, research new possibilities, and utilize drones to unlock more elaborate ways to shape and expand your settlement. Cultivate your food, mine minerals, or just relax by the bar after a hard day’s work.

Quality And Location Spreads Provide Fundamental CluesMy introduction to commodity markets came in the 1970s when I was invited to work for the summer for the world’s leading commodity merchant company. In the 1970s, Philipp Brothers’ headquarters were in the heart of New York City. The company had offices all over the world. Where it did not have an office, it had a network of agents. Philipp Brothers bought commodities from producers and provided financing for raw materials production and sold to consumers. In an era of rising inflation in the late 1970s, the company was so profitable that it bought the leading Wall Street, privately held bond trading and investment banking firm, Salomon Brothers.
My first job was delivering telex messages to trading and traffic departments. Traders were the kings, earning millions in profits. The traffic department arranged the logistics of moving raw materials around the globe from production points to consuming locations. The telex messages contained information about proposed transactions and completed ones. I read each one with great interest. Those messages turned out to be an invaluable education in the business.
The high school job turned into a lifelong career. The excitement of markets and the global nature of the commodities business was a powerful force that caused me to forgo law school for a career as a commodity trader.
Market structure- We looked at processing spreads and term structure
Location-location-location is the real estate mantra- It applies to commodities too
Different qualities command premiums or discounts
Another part of market structure that can provide valuable clues and makes the pieces of the puzzle form a picture
I view the commodity markets as a jigsaw puzzle with many moving pieces. Each market has idiosyncratic characteristics. Quality and location are parts of each market’s structure and can provide insight into the path of least resistance of prices.
Market structure- We looked at processing spreads and term structure
Over the past two weeks, I highlighted processing spreads and term structure, two critical puzzle pieces. In the future, I will cover substitution spreads and the essential technical factors that held uncover a picture of the path of least resistance for prices.
Processing spreads tell us about the demand for one commodity that is a product of another. Crude oil crack spreads and soybean crush spreads were examples.
Term structure tells us about the supply-demand balance as backwardation where deferred prices are lower than nearby prices for the same commodity indicates supply shortages or concerns. Contango, where deferred prices are higher, suggests plenty of nearby supplies to satisfy demand or a market is in equilibrium with supply and demand balanced.
This week, we will look at location and quality spreads covering the same commodity’s regional dynamics and different compositions. These spreads shed light on areas of the world where a commodity may trade at a significant differential or where other forms or variations of the same commodity are at premiums or discounts, which could signal price changes.
Location-location-location is the real estate mantra- It applies to commodities too
A location spread reflects the price of the same commodity for delivery in one location or area versus another. The most recent example of substantial location differentials has been in the natural gas market.
The natural gas futures contract on the CME’s NYMEX division reflects the price of the energy commodity for delivery at the Henry Hub in Erath, Louisiana.
The chart shows that in October 2021, the futures reached the highest price since February 2014 when they traded to a high of $6.466 per MMBtu, only 2.7 cents below the 2014 $6.493 high.
Meanwhile, shortages of natural gas in Asia and Europe pushed the energy commodity price over five times higher than the NYMEX futures price. Since natural gas in liquid form travels the world via ocean vessels, the high prices in Asia and Europe have a bullish impact on US prices.
Meanwhile, prices in the US can vary dramatically from the NYMEX Henry Hub price, which is a benchmark. Following the price action in natural gas swaps between one US region and others can provide clues about the energy commodity’s price path.
Commodity production tends to be localized in areas of the world where the earth’s crust contains reserves or the soil and climate support crop growth. Consumption is widespread as people worldwide require essential staples. When local shortages occur, prices can rise to substantial premiums to benchmarks. In glut conditions, they can fall to significant discounts. Monitoring these location differentials in all commodities provides valuable information about supply and demand characteristics.
Different qualities command premiums or discounts
A quality spread is the price differential between one form or composition of a commodity and another in the same raw material. An example is the price differential for one hundred-ounce bars of gold and four hundred-ounce bars of gold. Each COMEX contract calls for 100 ounces of the precious metal, the US standard of trade. The London gold market is a far more active wholesale market, where the standard of trade calls for the four hundred-ounce bars. Price differentials reflect the price and time to process one form of gold into the other. Significant premiums or discounts of either size bars, or different sizes such as kilos bars, one-ounce bars, or others, can tell us about retail or wholesale gold demand.
When we drink a cup of coffee, we rarely think of the origin of the beans that are ground into the caffeinated beverage. Arabica coffee beans trade in the futures market on the Intercontinental Exchange. The Arabica beans tend to be most popular in the US. Starbucks, Dunkin Donuts, and most US establishments offer Arabica coffee to consumers. Brazil is the world’s leading producer of Arabica beans.
Meanwhile, Vietnam is the leading product of Robusta coffee, which is the beans required for espresso coffees. Robusta coffee futures trade on the Intercontinental Exchange in Europe. A weather event in Vietnam or Brazil can cause supply issues for Arabica or Robusta beans, leading to a price change in one or both variations of the soft commodity.
There are many other examples of quality spreads where one form or size of a commodity can experience supply or demand changes that impact the overall price action in the raw materials.
Another part of market structure that can provide valuable clues and makes the pieces of the puzzle form a picture
Location and quality factors can reveal underlying fundamental trends in a commodity. Comparing current levels to historical ones and explaining the changes often leads to an improved understanding of previous price trends and can help predict the future path of least resistance of prices.
Location and quality differentials are parts of a market’s overall structure. Combined with the other structural factors, they can uncover opportunities that improve the odds of success.
---
Use the links below to sign up for the Monday Night Strategy Call this week. You can also access the full article for free using the other link below.
Trading advice given in this communication, if any, is based on information taken from trades and statistical services and other sources that we believe are reliable. The author does not guarantee that such information is accurate or complete and it should not be relied upon as such. Trading advice reflects the author’s good faith judgment at a specific time and is subject to change without notice. There is no guarantee that the advice the author provides will result in profitable trades. There is risk of loss in all futures and options trading. Any investment involves substantial risks, including, but not limited to, pricing volatility, inadequate liquidity, and the potential complete loss of principal. This article does not in any way constitute an offer or solicitation of an offer to buy or sell any investment, security, or commodity discussed herein, or any security in any jurisdiction in which such an offer would be unlawful under the securities laws of such jurisdiction.

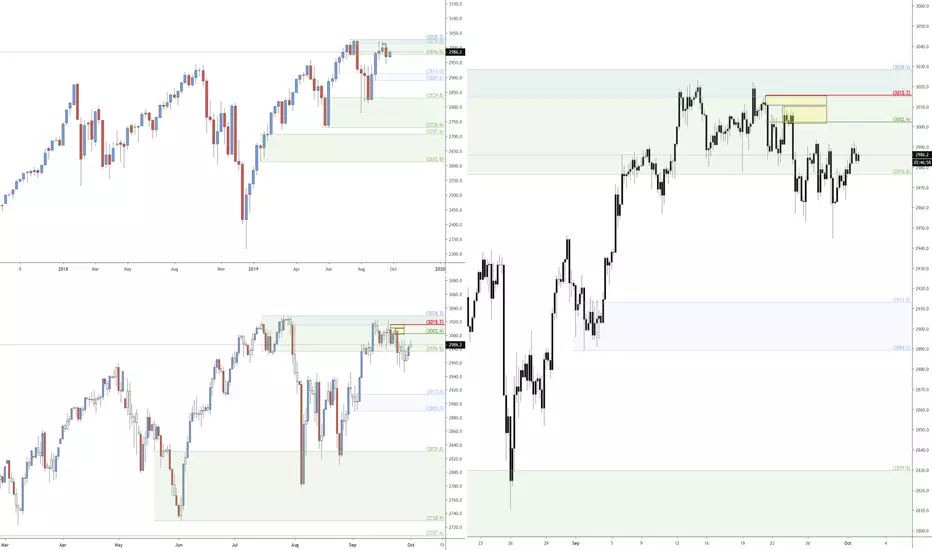
SPX H4 SHORTA new level of quality supply has been formed in a level on level scenario. Would be looking to get short at the H4 supply when prices trace to that level
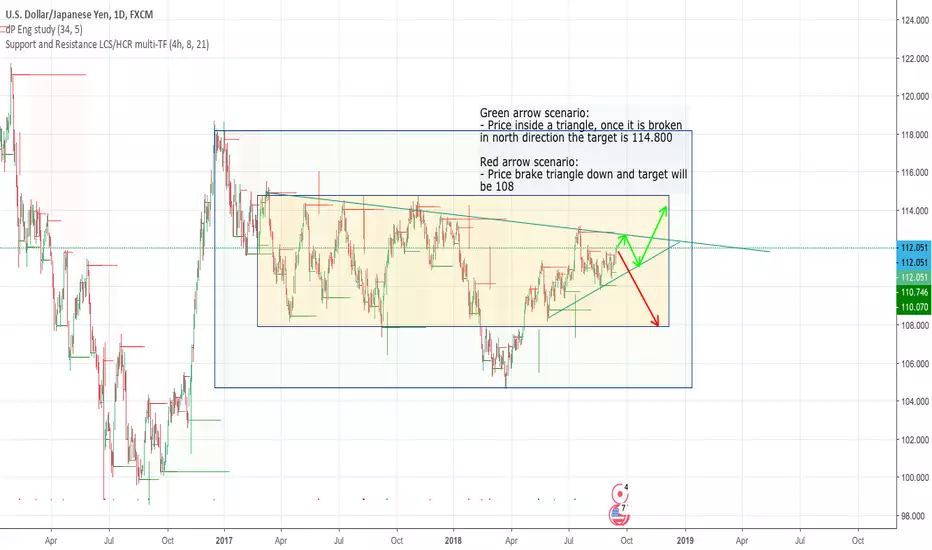
USDJPY forecast - location - setupUSDJPY forecast - location - setup:
Green arrow scenario:
- Price inside a triangle, once it is broken in north direction the target is 114.800
Red arrow scenario:
- Price brake triangle down and target will be 108
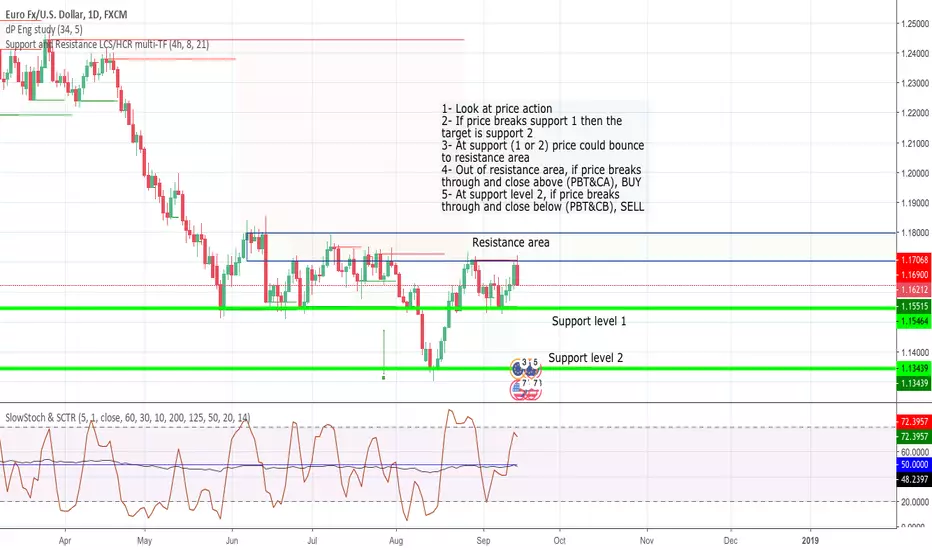
EURUSD Forecast - location - setupEURUSD Forecast - location - setup
Chart ready for next week scenario and analysis:
1- Look at price action
2- If price breaks support 1 then the target is support 2
3- At support (1 or 2) price could bounce to resistance area
4- Out of resistance area, if price breaks through and close above (PBT&CA), BUY
5- At support level 2, if price breaks through and close below (PBT&CB), SELL
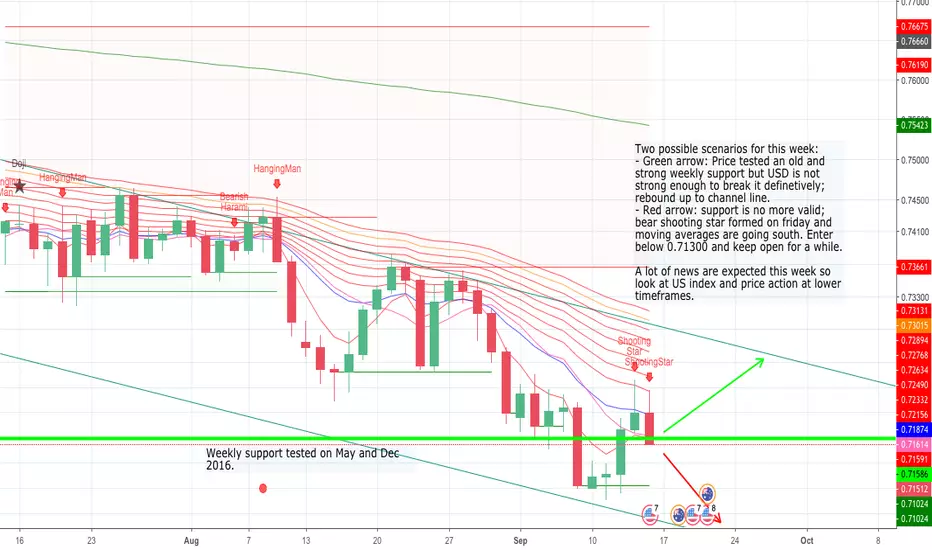
AUDUSD forecast - location - setupAUDUSD forecast - location - setup
Two possible scenarios for this week:
- Green arrow: Price tested an old and strong weekly support but USD is not strong enough to break it definetively; rebound up to channel line.
- Red arrow: support is no more valid; bear shooting star formed on friday and moving averages are going south. Enter below 0.71300 and keep open for a while.
A lot of news are expected this week so look at US index and price action at lower timeframes.
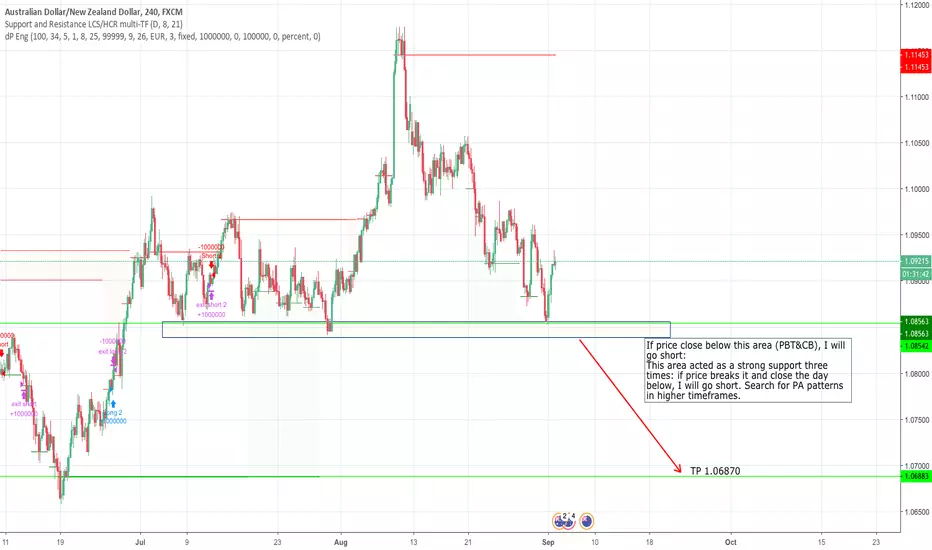
AUDNZD waiting for support breakIf price close below highlighted area (PBT&CB), I will go short:
This area acted as a strong support three times: if price breaks it and close the day below, I will go short. Search for PA patterns in higher timeframes.
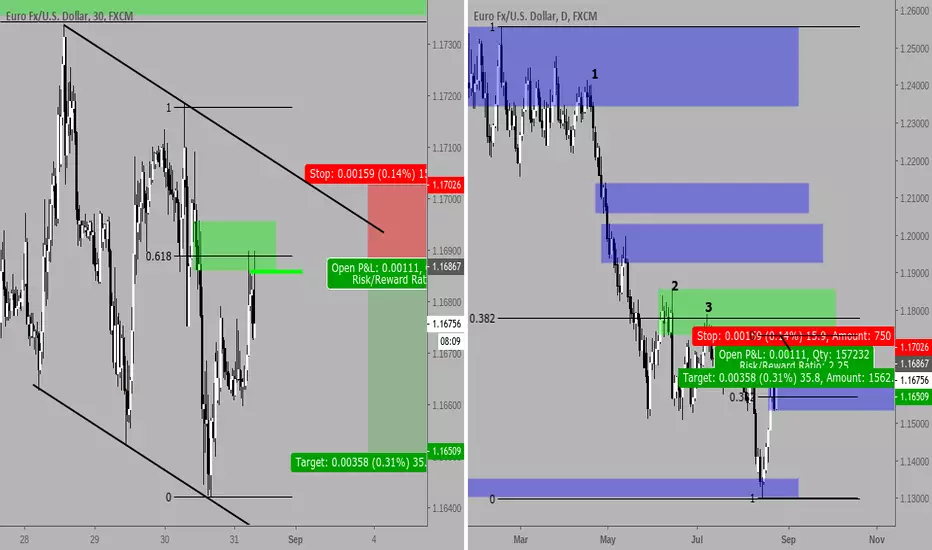
EURUSD with larger timeframe trend tradeJust shorted the EURUSD on the 30min chart from the green thick line due to multiple confluences both on the higher as well as the lower timeframe.
Looking to take a 2:1 on this one.
Good luck!