LODHA - Symmetrical Triangle Breakout Trade SetupAbout Pattern:
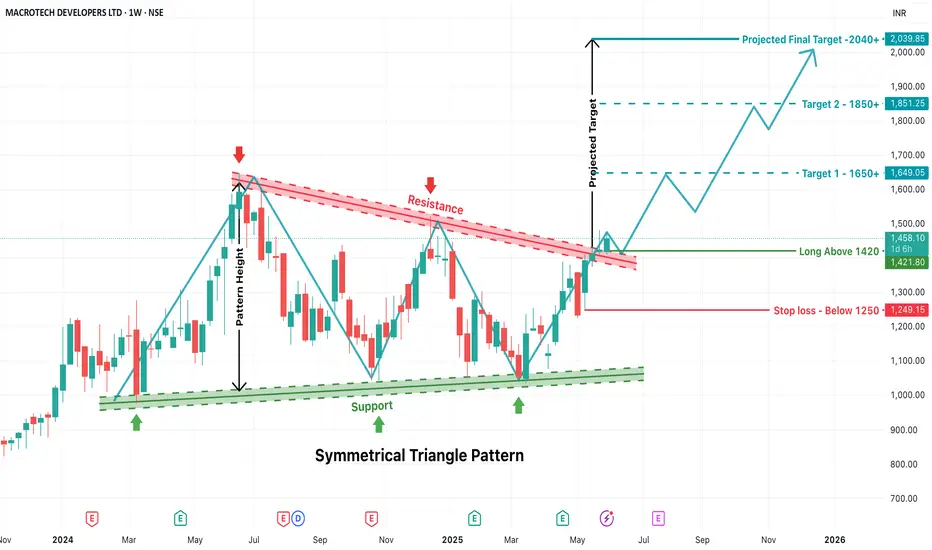
A Symmetrical Triangle Pattern is a continuation chart pattern formed when price action creates lower highs and higher lows, converging toward a point. It reflects indecision and compression in price before a breakout occurs. The breakout can be on either side, but here, a bullish breakout has occurred.
Support Line: Formed by connecting the swing lows (green arrows), which are gradually increasing.
Resistance Line: Formed by connecting the swing highs (red arrows), which are gradually decreasing.
This convergence of support and resistance forms the triangle.
Breakout Confirmation
Breakout Level: ₹1420
The stock has clearly broken out above the resistance trendline, indicating a strong bullish signal on the weekly timeframe.
Entry and Stop Loss Strategy
Entry Point: Enter the trade only above ₹1420 after confirmation of breakout. This acts as a psychological and technical barrier.
Stop Loss (SL): Set below ₹1250, which is well below the previous swing lows and triangle support. This acts as a safety net in case of a false breakout or reversal.
Target Calculation – Based on Pattern Height
Pattern Height:
Calculated from the highest swing high inside the triangle to the lowest swing low.
This vertical distance is then added to the breakout point (₹1420) to estimate the price targets.
Target 1: ₹1650+
This is the first resistance zone post-breakout and a psychologically important round number.
Target 2: ₹1850+
Based on the full extension of the pattern height and intermediate resistance zone.
Final Projected Target: ₹2040+
This is the complete projection of the triangle pattern height.
This setup is suitable for:
Swing traders looking for positional opportunities
Investors seeking breakout confirmation for fresh entries
Trend followers waiting for consolidation breakouts
Once price sustains above ₹1420, the stock is expected to follow a bullish trajectory toward ₹1650–2040+ over the coming weeks/months.
LODHA
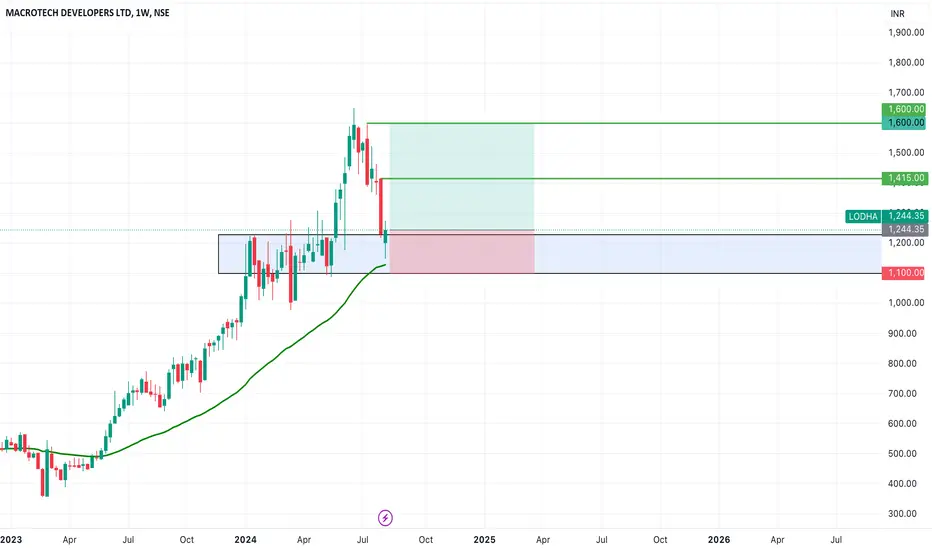
SWING IDEA - MACROTECH DEVELOPERS (LODHA)Macrotech Developers , a prominent real estate company in India, presents a swing trading opportunity based on its current technical setup.
Reasons are listed below:
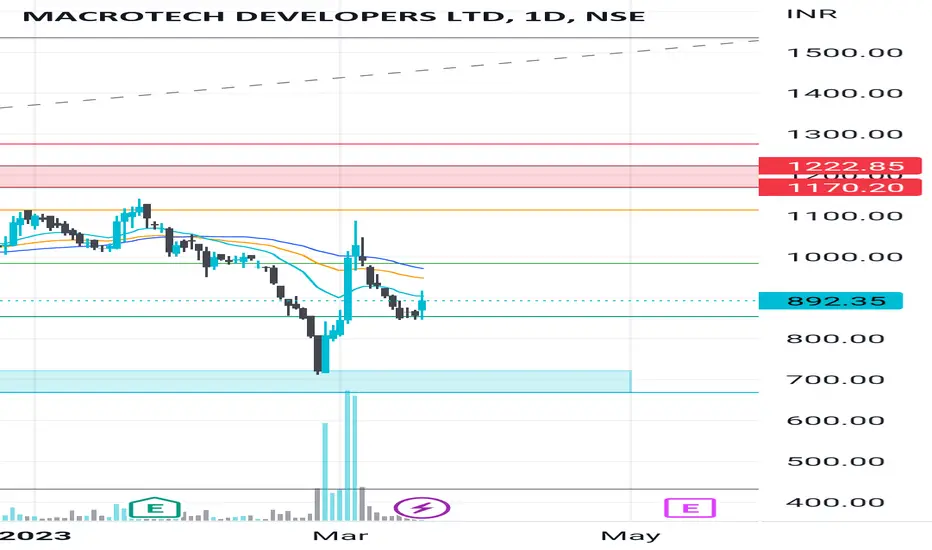
1200 as a Strong Support Zone : The 1200 level has been a significant support zone, providing a strong foundation for a potential upward move.
Double Bottom Pattern on Daily Timeframe : A double bottom pattern has formed on the daily chart, which is a classic bullish reversal pattern, indicating the potential for an upward trend after testing the support zone twice.
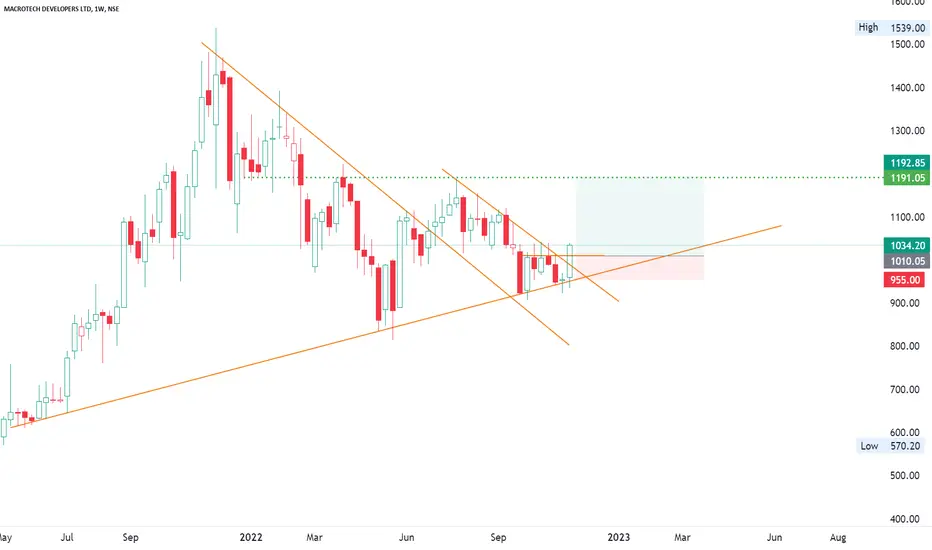
50 EMA Support on Weekly Timeframe : The stock is finding support at the 50-week exponential moving average, which often acts as a strong support level, reinforcing the bullish sentiment.
200 EMA Support on Daily Timeframe : The 200-day exponential moving average is also providing strong support on the daily chart, indicating the long-term trend remains intact.
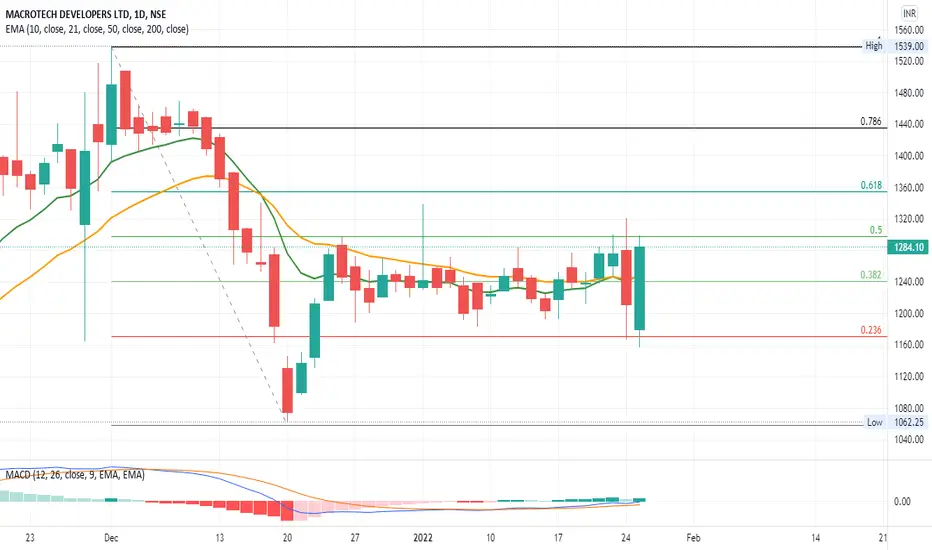
0.382 Fibonacci Support: The stock has bounced off the 0.382 Fibonacci retracement level, suggesting that the current price level is a strong support area, and there may be further upside potential.
Target - 1415 // 1600
Stoploss - weekly close below 1100
DISCLAIMER -
Decisions to buy, sell, hold or trade in securities, commodities and other investments involve risk and are best made based on the advice of qualified financial professionals. Any trading in securities or other investments involves a risk of substantial losses. The practice of "Day Trading" involves particularly high risks and can cause you to lose substantial sums of money. Before undertaking any trading program, you should consult a qualified financial professional. Please consider carefully whether such trading is suitable for you in light of your financial condition and ability to bear financial risks. Under no circumstances shall we be liable for any loss or damage you or anyone else incurs as a result of any trading or investment activity that you or anyone else engages in based on any information or material you receive through TradingView or our services.
@visionary.growth.insights
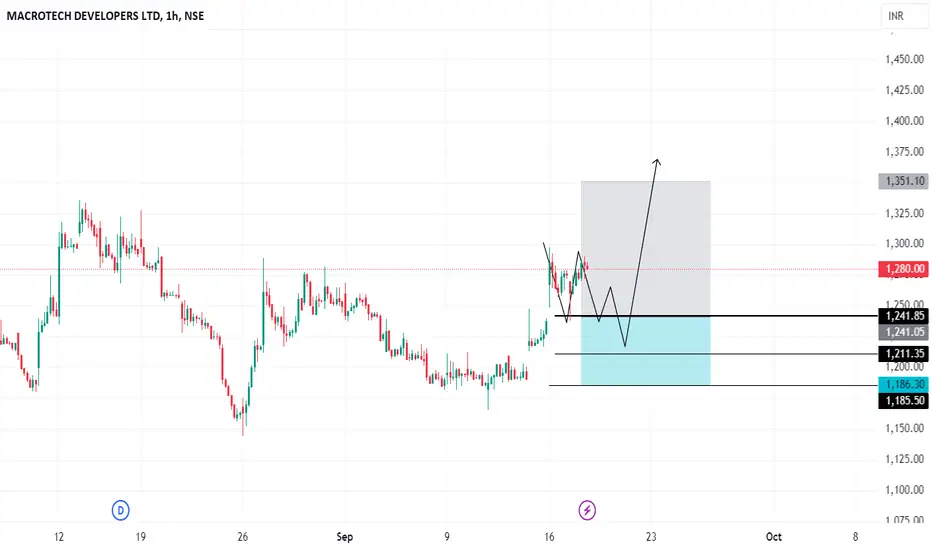
Keep An Eye - LODHA📊 Script: LODHA
📊 Sector: Construction
📊 Industry: Construction
Key highlights: 💡⚡
📈 Script is trading at near its support level keep an eye on stock, we may see some good rally.
📈 One can go for Swing Trade.
⏱️ C.M.P 📑💰- 1239
🟢 Target 🎯🏆 - 1339/1398
⚠️ Important: Always maintain your Risk & Reward Ratio.
✅Like and follow to never miss a new idea!✅
Disclaimer: I am not SEBI Registered Advisor. My posts are purely for training and educational purposes.
Eat🍜 Sleep😴 TradingView📈 Repeat 🔁
Happy learning with trading. Cheers!🥂

LODHA GIVES STRONG BRAKEOUT IN DAILY CHARTNSE:LODHA
LODHA gives double strong brake out in Daily chart.
Buy 1350
SL 1240
Target 1550,1650+
time Duration 1-2 month

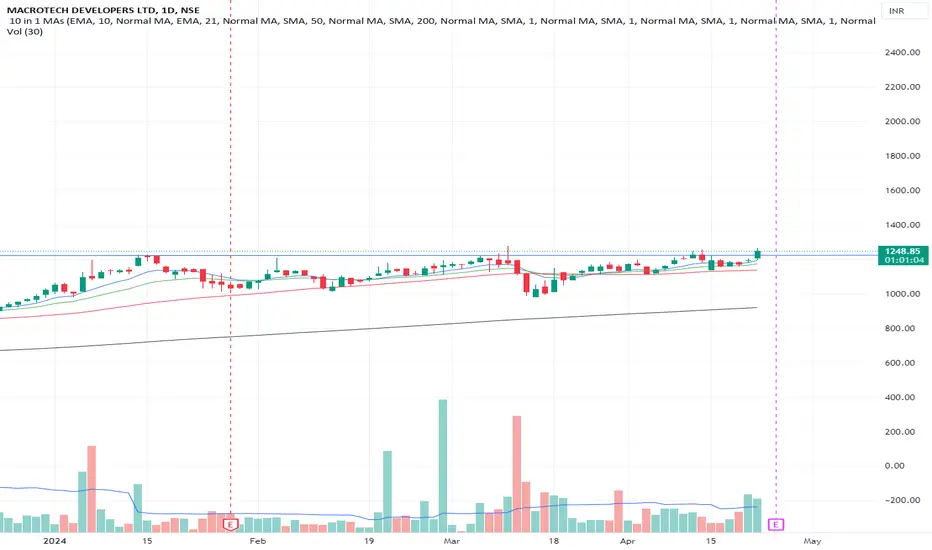
VCP in LODHA - 25% up move expected after breakoutMACROTECH DEVELOPERS (LODHA) - is nearing its 52 week high with a dry up in volume on a daily time frame with a consolidation from the past 100 days.
The company has seen an influx of institutional investing in the last quarter.
Good for swing traders to be kept on watchlist. Look for volume gain above the 30w moving average on weekly time frame.
Can expect an upward momentum of a min of 25%.
Entry - INR 1245
SL - 8%
TSL - According to your risk profile.
Disclaimer: Please be advised that the information provided is not intended as financial advice. It is imperative to conduct thorough research before making any investment or trading decisions.
Just A View - LODHA📊 Script: LODHA
📊 Sector: Construction
📊 Industry: Construction
Key highlights: 💡⚡
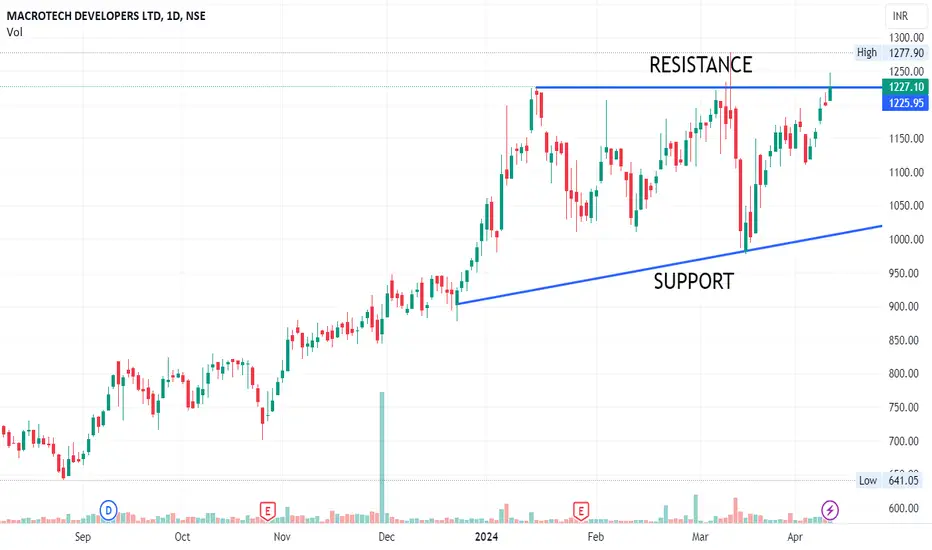
📈 Script is trading near at resistance level which is 1225 keep an eye on stock we may see some rally.
⏱️ C.M.P 📑💰- 1127
🟢 Target 🎯🏆 - 1293
⚠️ Important: Always maintain your Risk & Reward Ratio.
✅Like and follow to never miss a new idea!✅
Disclaimer: I am not SEBI Registered Advisor. My posts are purely for training and educational purposes.
Eat🍜 Sleep😴 TradingView📈 Repeat 🔁
Happy learning with trading. Cheers!🥂
LODHA Good for 5-10% ROI SwingThe stock is at an ATH.
It looks good for an entry above 818, ascending triangle in formation in Daily.
The stock is strong in Monthly as well, it has broken out of a Triangle pattern and then moving up strong after pushing all the sellers down with buying pressure evident.

Lodha upside possible After a very good uprally from it's demand zone, lodha has yet again came at a very good support of Fibonacci so a good upside can be expected.
Good for very short term
LODHANSE:LODHA
One Can Enter Now ! Or Wait for Retest of the Trendline (BO).
Note :
1.One Can Go long with a Strict SL below the Trendline or Swing Low of Daily Candle.
2. Close, should be good and Clean.
3. R:R ratio should be 1 :2 minimum
4. Plan as per your RISK appetite
Disclaimer : You are responsible for your Profits and loss, Shared for Educational purpose!
MACRO TECH(LODHA) ANALYSIS!!i have drawn perious waves, to understand how the stock moved.
plus the rectangle figure is the range for the breakouts.
i have even put the moving averages for your analysis .
(red one- 50MA, blue one - 100MA).

LODHA is looking Bullish Above 1300LODHA is looking Bullish if sustain above 1300 on closing basis will touch 1350-1400-1450-1550 in coming days, as follow 1:1 SL as safety point
Macrotech Developers..LodhaMacrotech Developers. (Lodha)
Breakout is seen on the chart. May move higher as the realty sector is also in an uptrend.
View invalid if moves below 1030 or below the trendline drawn.
Note: only for educational purposes. Not a buy/sell recommendation.
#stocks #stockmarket #analysisonly
