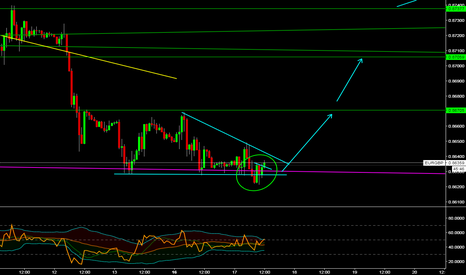
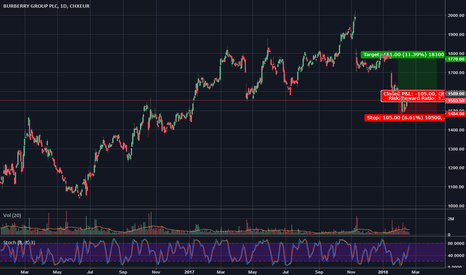
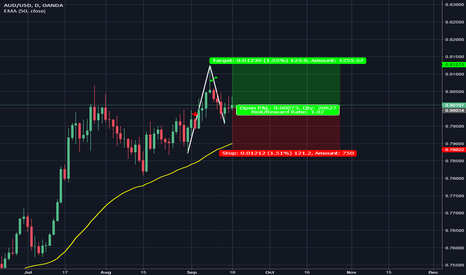
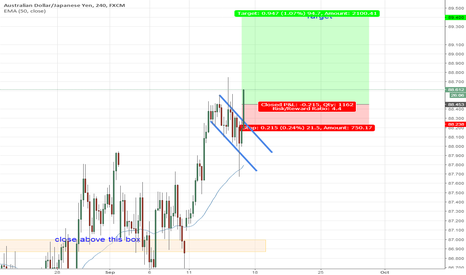
How about going long on CHFJPY today to end the week?I am placing a buy here with the bulls on CHFJPY because here after careful review, trend analysis and pattern recognition on the 1hr time frame for entry I have identified an opportunity to buy for the CHFJPY pair with confluences to match. Take a look at my analysis I would love your feedback. My trades a specifically for intra day trading I am completely out of the market by 5pm EST each day with my profit or loss taken
London
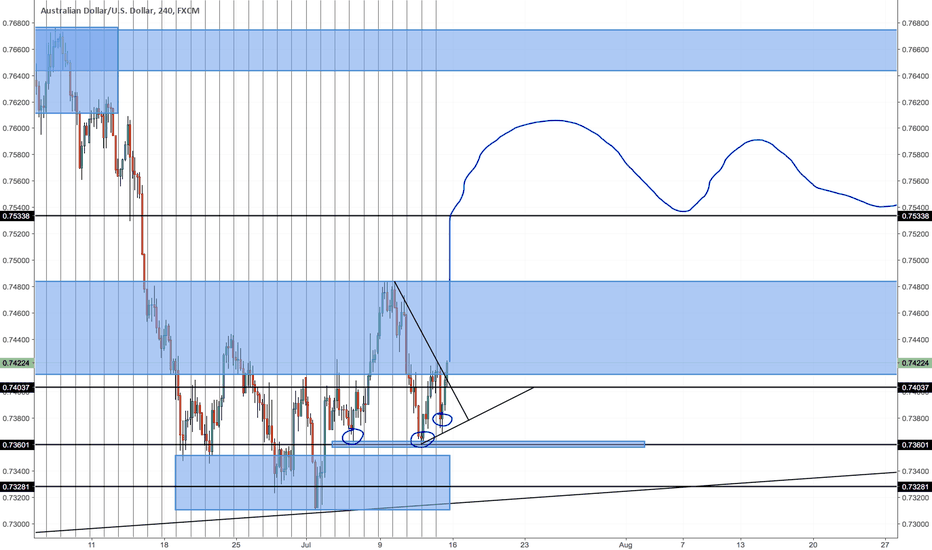
Price Action On AU / BullishLooking at previous structure of price for AUD/USD I have marked on this chart
my higher highs, higher lows for previous bull trend as well as lower lows and lower highs for bear trends (D & 4H) with the rectangle blue boxes
January 15 2016 prices reached a low at 0.6829
deep re-tracement a few months later May 2015 20-June 02 Price retraced at 0.7163 never breaking the previous support
later that year price also retested that same support level in December 20 2016 - January 3 2017 then began its bullish trend again
Current - Price has rejected breaking a strong level of support 0.7328
waiting for a retest of the 0.7360 price before looking to go long on this trade
my bullish trend line is still valid
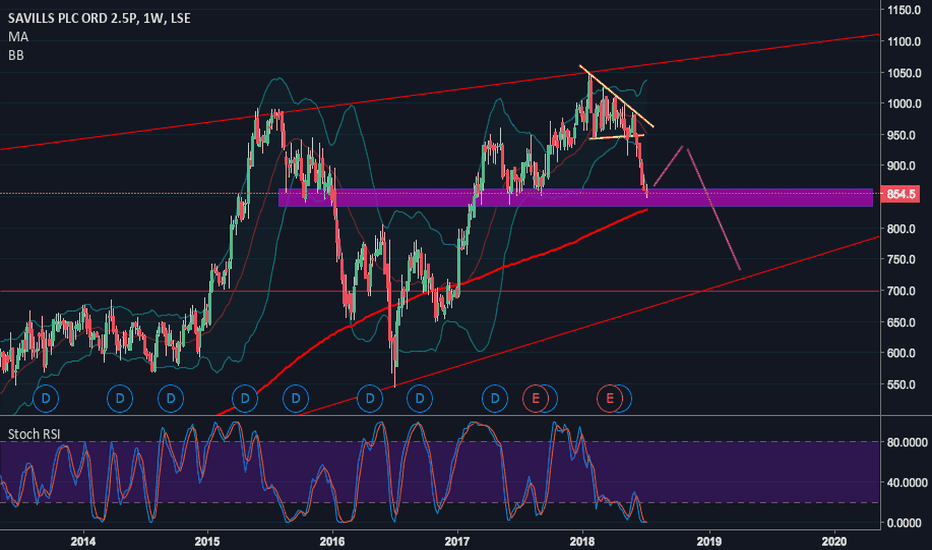
The London Housing Bubble, ChartedThis is the weekly chart of Savills PLC, real estate provider.
I rarely trade stocks, but sometimes I see an opportunity that piques my interest, because it a) has an interesting chart and b) fits into my fundamental world view.
In this case, I believe that housing is over-leveraged, and is 'affordable' only as a result of an artificially low interest rate environment. I especially believe this to be the case in London, which has been subject to an onerous property bubble, which will pop due to simple mean reversion, and Brexit fears.
SVS is my go-to vehicle for this trade. SVS has dropped like a stone form a multi-month consolidation, and it now coming into a support zone. A bounce is to be expected. A kiss of the prior consolidation support-turned-resistance would be textbook. I expect a rejection there, or lower, providing a continuation and measured move to long-term support.
I am short, and will look to add on a multi-week high.
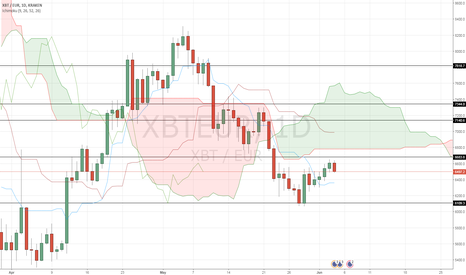
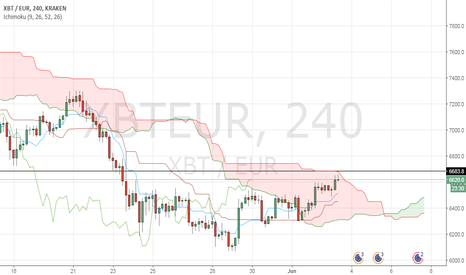
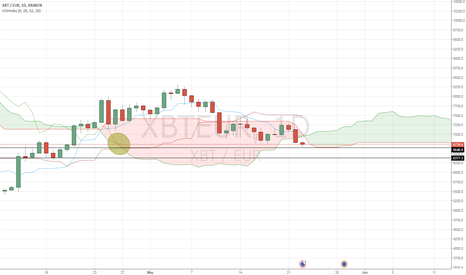
The price of Bitcoin (€) might get uptrend in daily timeframeActually, the price of the Bitcoin (in Euro) is about to get over the 4-hour timeframe Ichimoku Cloud.
€6683 might be the first level (if crossed) that could be a confirmation of the uptrend. The Lagging Span Line (Chikou Span Line) should get completely over the Kumo Cloud in daily timeframe, that means that a full Japanese Candlestick should be over the Kumo Cloud (Open Price and Close Price) to have a confirmation of the uptrend and that would be a potential buy zone.
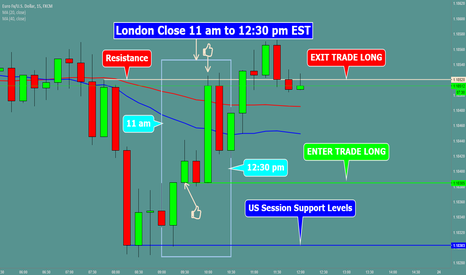
WHAT IS THE BEST PAIR TO TRADE LONDON CLOSEDuring the US Session between 11 am to 12:30 pm EST is the London Close time range to trade. London Session ends and pairs will have a small reversal as they close out many of their trades. The EURUSD is the best pair to trade this strategy. 10 pip scalp trade.
AUD/USD POSSIBLE LONG BASED ON DAILY ANALYSIS. 10:34 am - AUD/USD 1HOUR CURRENTLY SITTING ON 50ema AND RANGING IN A 'BULLISH' FLAG PATTERN.
ENTER LONG UPON BREAK OF CHANNEL.
Daily 123 Gr4d candlestix .
1st Target Gr4d the close above '2'
right now looking for confirmation on 1hr & 4hr timeframe for a Cgr4d within the Flag/Channel.
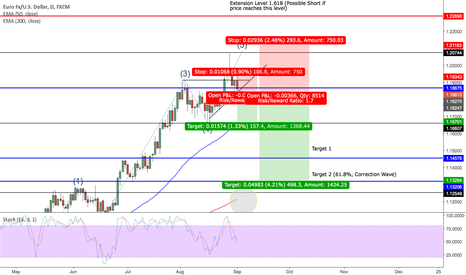
EURUSD POTENTIAL DOWSIDE TARGETSOn the daily time frame we have a possible 5-Elliot wave formation, with the 5th impulse on a 1.217 extension. Price is currently sitting around the monthly and weekly resistance level (1.200). We can possibly trade the correction wave to the downside on PA confirmation. We have multiple possible trade setups for different strategies and styles of trading. We have our weekly trade and possibly a trade setup that will run between two to four weeks. This is only a trade “IDEA” our trades will be only executed on price action confirmation. If price does break and close above 1.200 and hits our stop loss we can possible see price extend to the 1.618 extension (1.2300); we will also seek further shorts from this level on PA confirmation.
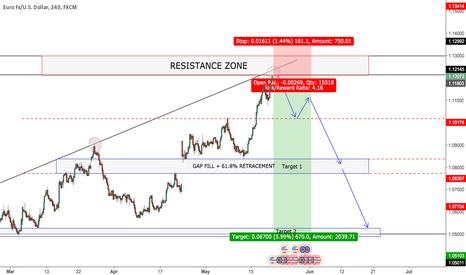
EURUSD OUTLOOKLooking bearish to the downside to cover the gap (Gapfill) inline with the daily + Weekly 61.8% retracement + POSSIBLE CORRECTION WAVE. First downside target being 1.07750, however a management target should be considered around 1.10300 (Red dashed support). Once this level is broken the bears will gain further momentum. Our second target being 1.0500. However, once our first target is met management must take place. Stops should be placed around 1.13500. If price breaks above this level we can see further bullish momentum.
This is only an outlook, trades will be conducted according to strategy and risk/money management.
***TRADE AT OWN RISK***
DIA: Dow showing 30 points up in London. Cheap as chipsDIA: SPDR Dow showing 30 points up right now at Igindex.com. that's damn cheap. Take a look at Germany- up 138. Dow and Nasdaq both trading now and are still offering great returns for the brave bull who uses stops sensibly (so they don't get hit unless the market is turning down bigtime)
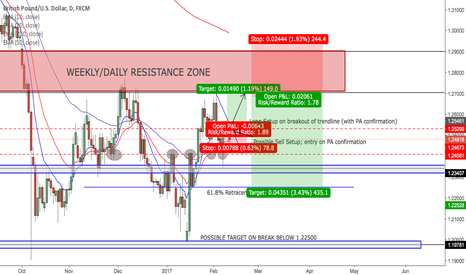
GBPUSD POSSIBLE SETUPS As you could see 1.24050 is holding as key support level. We have strong bullish candlesticks sitting on the 200 EMA (Magnetic Support) presented on the 4 Hour timeframe. The UK government is confident with brexit. We can possibly see price reach 1.2700. Our long entries will be triggered on the break above the trendline and the red dashed level (1.25400); entries will be confirmed on bullish PA. If however, the charts project strong bearish PA at this level we may consider setting up a short setup. Our longer term trade setup will be the possible short setup around 1.2700 to our downside targets outlined, 1.23500, 1.22500 then possibly 1.2000. However, the short setup will also be confirmed on bearish PA. Our stops will be places above the Weekly/Daily Resistance zone around 1.29450.
***TRADE AT OWN RISK***
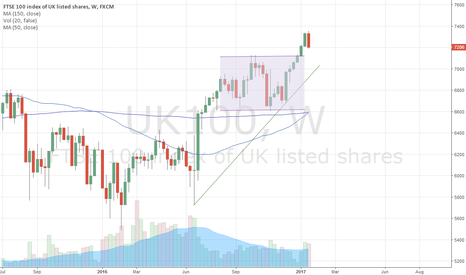
FTSE 100 - Short term sellSince the vote on Brexit, the path taken by the index is fairly obivous. The impulsion started at the end of June then is followed a period of consolidation from beginning of August until the end of 2016.
The new year started with a serie of new highs when the index reached 7341
The daily graph shows some sign of a reversal with a recent cross of the MACD, a momentum about to go into negative territry and a clear downtrend on the RSI. These indications open the way for a short term downtrend.
This feeling is confirmed by the weekly chart, showing a nearly perfect Marubozu, sign of a reversal in investors' mind and displaying an obvious sellers' dominance.
- Short term, close long or open short to get the opportunity of the index going down until its trend (or 50) near the 7,000 mark
- Mid to Long term, the uptrend still prevails.
- A break below the 7,000 points would confirm the short term short position and initiate a short position.
- On the contrary, a rebound would be a good entry point for a long position

