The US's trend remains unchanged: bullishThe US's trend remains unchanged: strongly bullish. After yesterday's decision taken by the FED, which decided to keep rates unchanged, investors reacted as analysts had expected. Without excessively increasing of long positions but keeping prices stable.When President Powell's conference began, he said that even if the US economy is stable now. The inflation below the 2% target area a step back is not expected by cutting rates and Injecting new money into the market. The price began to undergo a series of sales making them retrace and close the session on their respective key supports.
Technical scenario
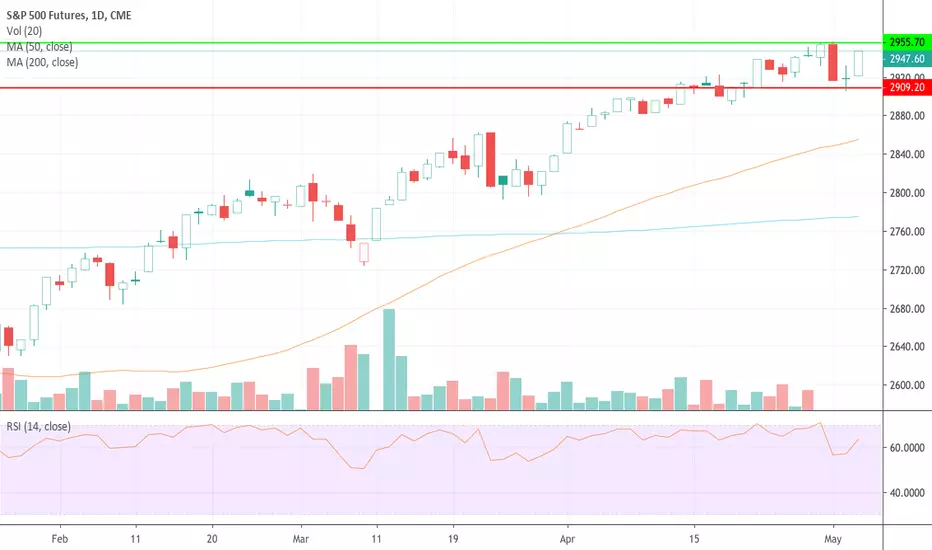
The US's trend remains unchanged: bullish and this descent, however, should already be over. From those levels it is assumed that prices can start again and reach their strengths. Those are at 29700 for SP500, 26900 for DOW JONES and 7900 for NASDAQ. The technical structure remains projected to the upside. In the case of SP500, on the higher time frames it is traveling above the EMAs. Almost certainly will touch the resistance zone set at 2940 points within a few hours. If it breaks the upward one, it will try to retest the area between 2960 and 2970 points.
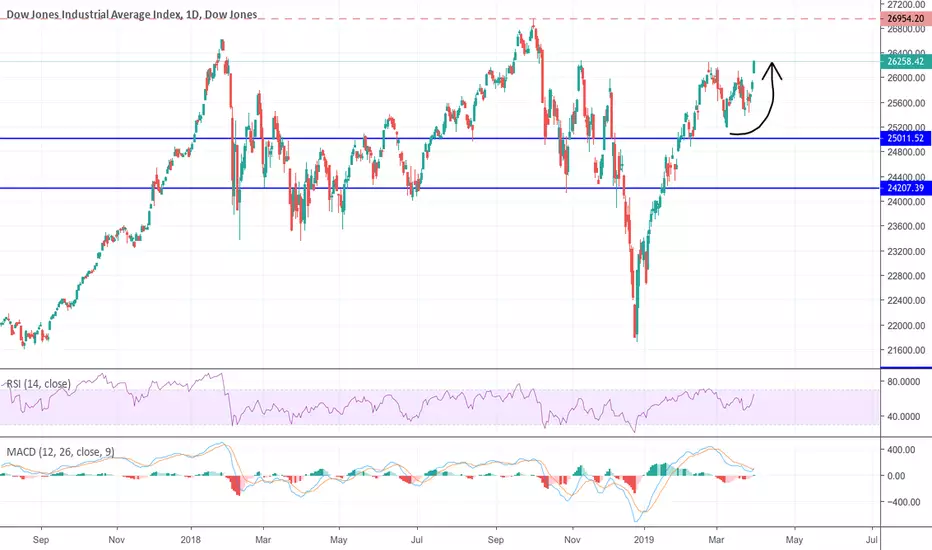
In the case of the DOW JONES, the descent of Wednesday / Thursday has already been partially reabsorbed. After the test of the support at 26160 points, the price is now again directed towards the maximums of the period. On breaking the level set at 26600, this will continue up to the absolute maximum at around 26900 points.
Trading Ideas
We recommend a long entry on one of these three indices, the indications are for the three major US indices.
The SP500 the SL will be under the support set at 2910, the TP will be at 2940 (intermediate tp) and 2960 (final tp).
DOW JONES the SL will be under the support set at 26160, the TPs will be at 26600 and 26900 points.
And the NASDAQ the SL will be under 7720 points, the TPs at 7860 and 8000 points.
Long-trade
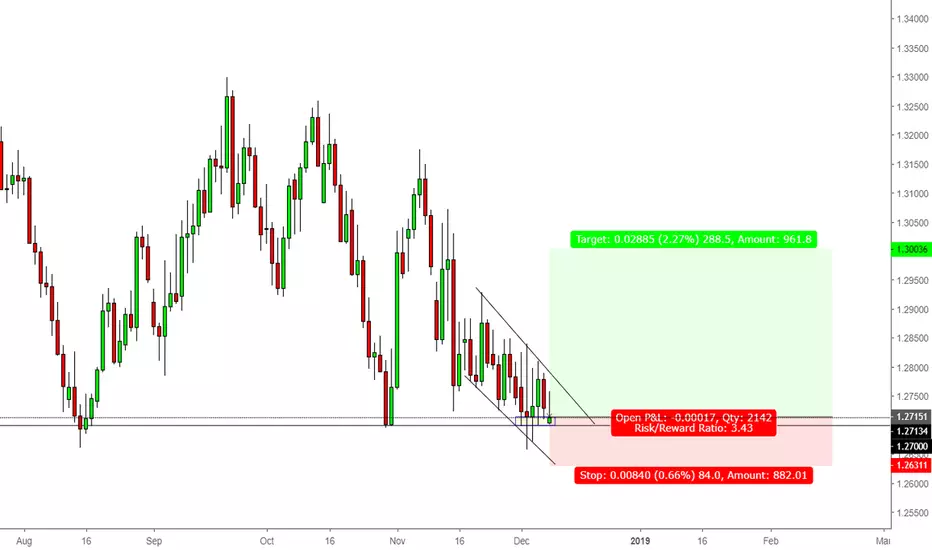
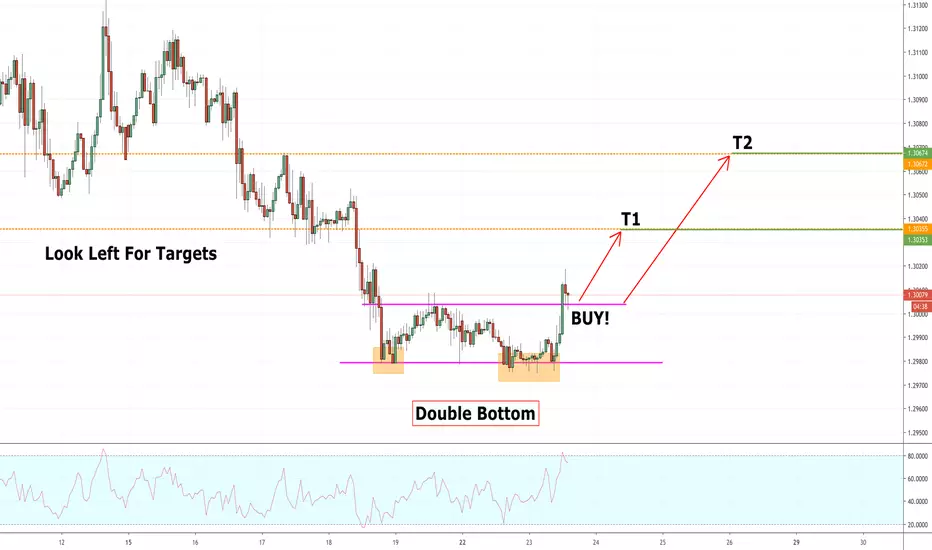
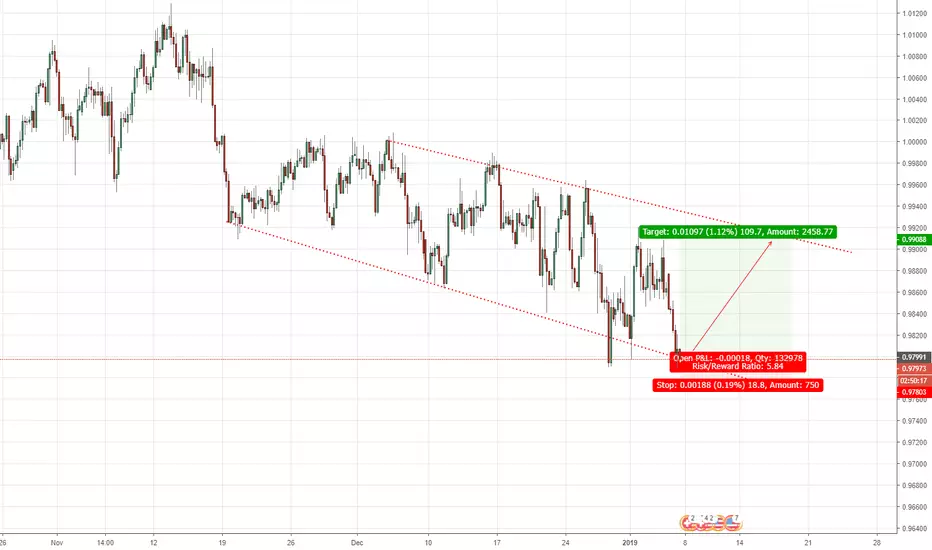
LONG GBPUSD: double bottom + rsi divergence
buy the retest of a broken resistance line
T1 - 1.3035
T2 - 1.307
stop below the bottoms!
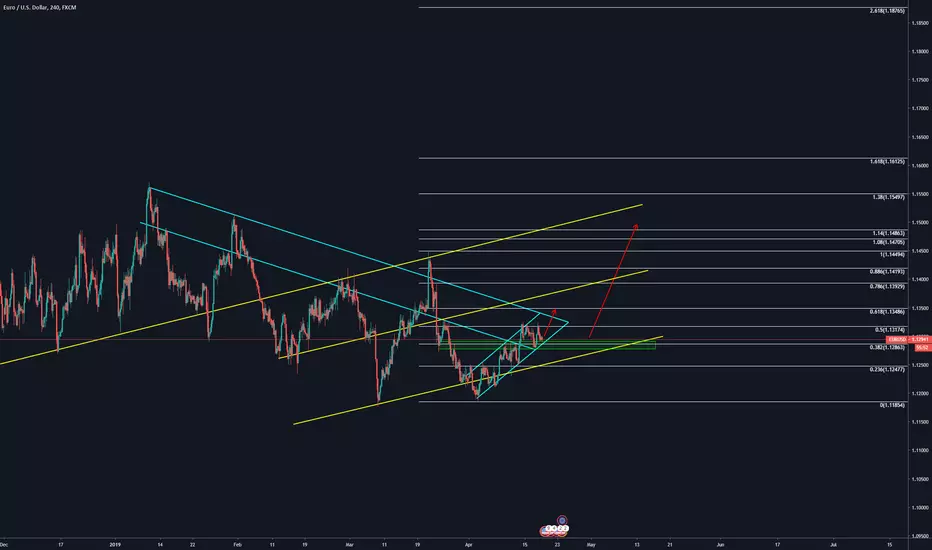
EURUSD, Continuously upward on H4.Euro / U.S. Dollar FX:EURUSD
H4:
==>Tendency goes to upward
== >Break obstruction
==>Above help
==> Waiting breakout confirm
==> BUY

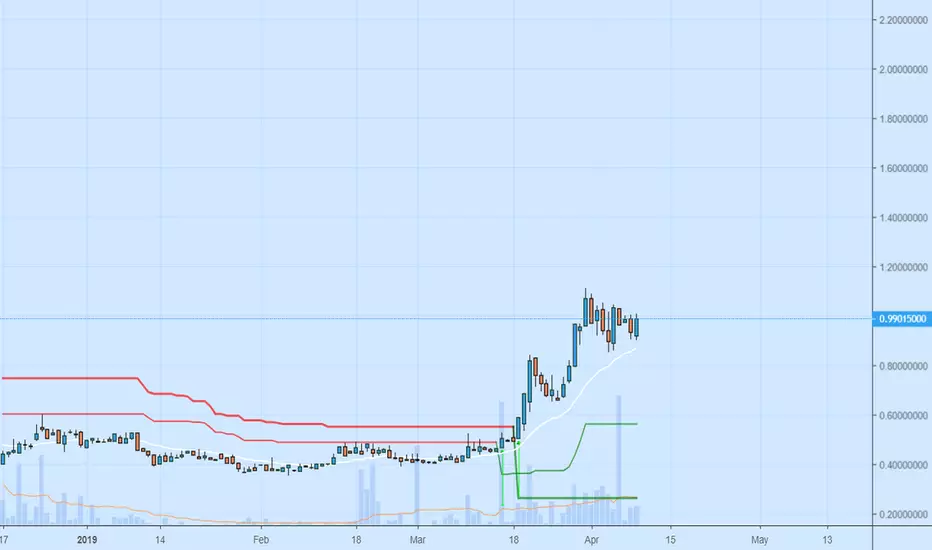
Long on XTZUSD Entered a long trade on XTZUSD. Take profit, entry and stop loss on the chart. Let's see if it will hit the target.

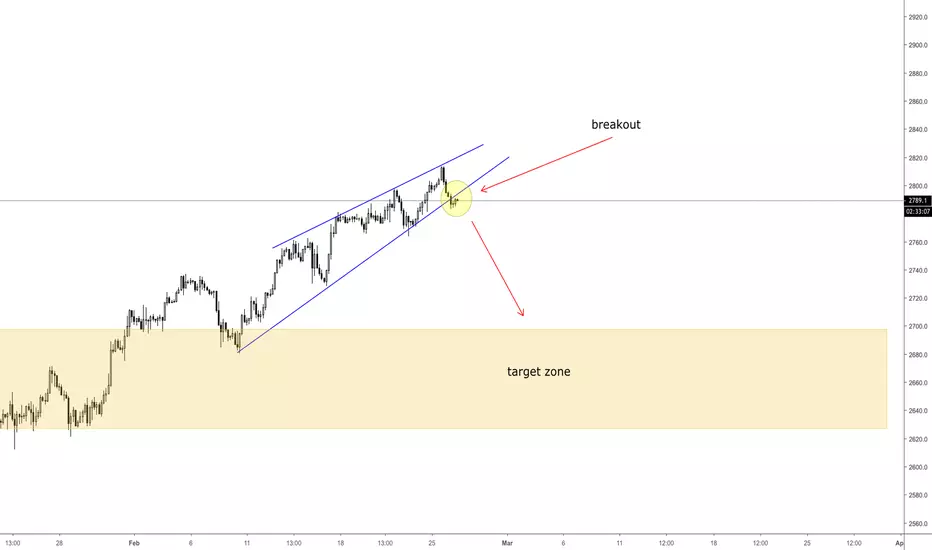
The American indices are once again pushing upwardsAll of them break the key short-term resistance. After having passed that period of weakness characterized by bearish sessions, as we expected after Powell's conference. The three downtrends, which were due to start on March 20th post-FED, did not reach the respective support areas where we had hypothesized the target zones. As regards SP500, when price was at 2820, we had identified the possible target at 2640 points. While the descent stopped at around 2780 points. Same thing for DOW JONES, it hit the SL. NASDAQ, which should have retraced from 25750 and 7370 points to reach the support levels set at 25000 and 6900 points, stopping however at 25340 and 7250 respectively. These descents would have had to last many sessions (forming a mini-trend in the short / medium term ) having been reabsorbed in 4-5 sessions. It is very likely that now the prices will go to reach the successive resistances. Those are placed behind of the absolute maximums to then again suffer a bearish attack. Always towards the key supports mentioned above.
To summarize: we expect a continuation of this very short-term uptrend. Targets on the static resistances placed respectively at 2906/2930 points (SP500), 26700 (Dow Jones) and 7660 points (Nasdaq). We enter on a long position on the SP500 with target the first resistance set at 2906 and we keep it in the portfolio for a few sessions. Our opinion the main trend must undergo a reversal because of the fundamental configured scenario.
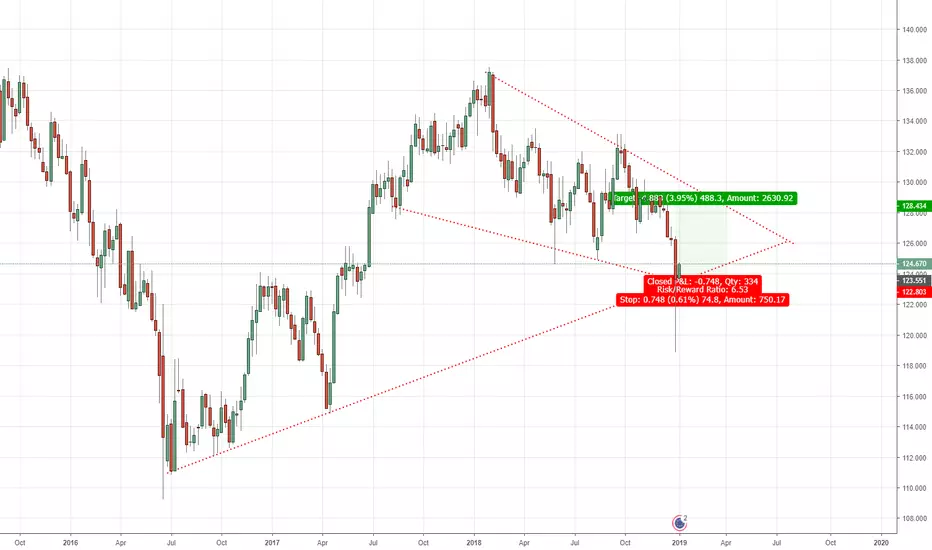
GBP JPY LONG TO JUST ABOVE DAILY RESISTANCEAfter 5 days of consolidation above the weekly resistance now support . also a fake breakout yesterday and MA's still in the biased direction in the weekly daily and 4 hour. i favour a long position for 118 pips.
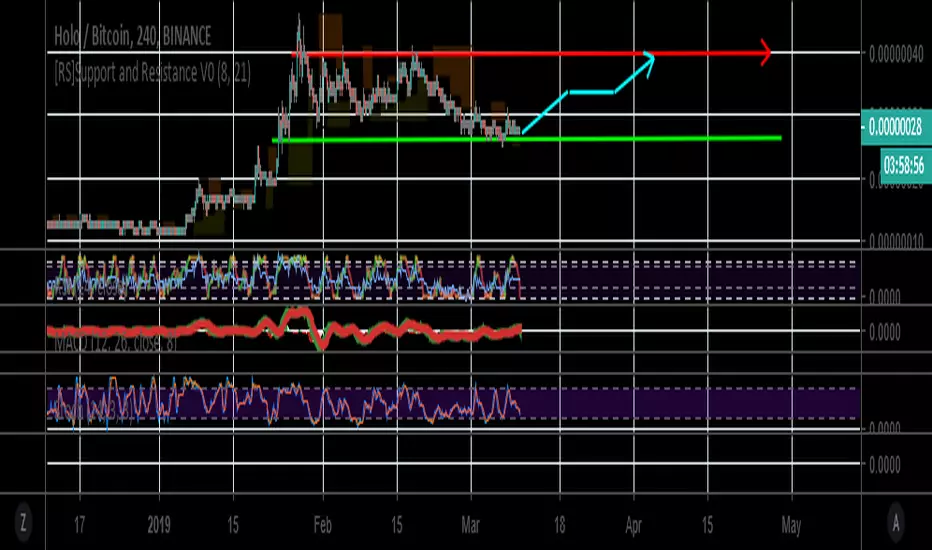
HOT HOTBTC Forming for move upEntry at green line
Exit at red line
SL:24
This is just a tip/ do your own research/ check the 1 day chart down!
S&P500 (SPX500USD) short.Targets and stops on the chart.
Don't forget to like and follow.
Thank you.
Which door do you open? Support or Resistance Technical side
The price touched the resistance area identified by the EMA144 daily at 57.80 and was then rejected up to 54.80 dollars per barrel, where the dynamic support identified by the EMA20 daily is located. If this support zone is not violated during the day, it is probable that the price will move again to 58/60 $. If instead this support should yield to the downside, we will see the price back again near the Ichimoku cloud support on tf daily, at the price of 51 dollars per barrel.
The storage and the target
It will be important to understand the weekly level of oil stocks that will be published at 22.30. So far, both technically and fundamentally, the most probable hypothesis is a rebound on the EMA20 daily and then try to reach the psychological resistance area at 60 $.

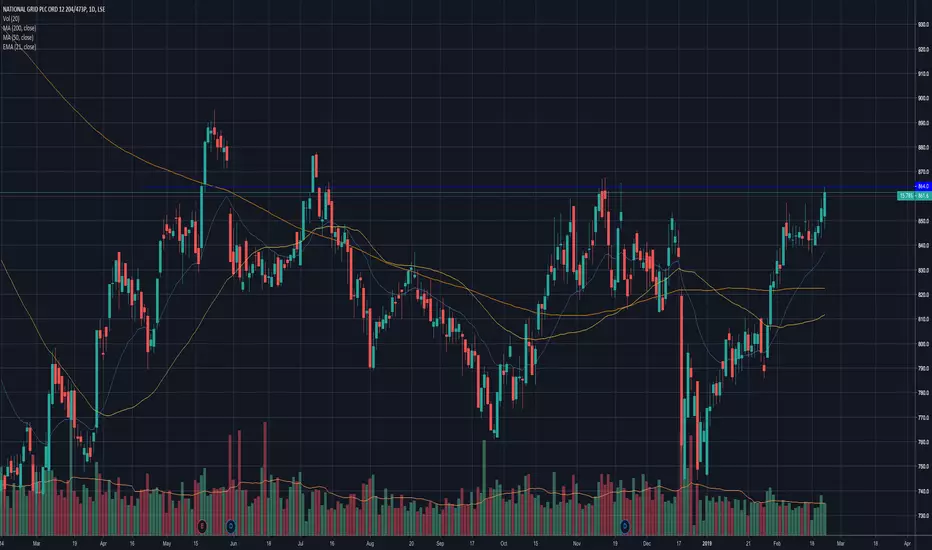
NG (National Grid) long LSE:NG.
A stock I will be keeping a close eye on this week is NG or national Grid a ulisities giant with a market cap of 29 billion, it is the largest UK provider of energy and has a presence in the US market. NG has struggled since May to break the 864 level and is approaching that zone again, ten day volume is massively below its longer run three month average indicating that investors are on the sidelines. After three previous attempts at this level fourth time's the charm, however I would like to see some consolidation under the round number support before a break out on high volume. The game plan is to place a stop order at 864.1 sey for a breakout from this level, a proper stop loss can be determined after confirmation of the breakout. I hope you like this idea and as always feel free to pick it apart and tell me where i could be wrong, if you enjoy the content and wish to see more give me a follow any support you can offer would be appreciated happy trading.
Joe
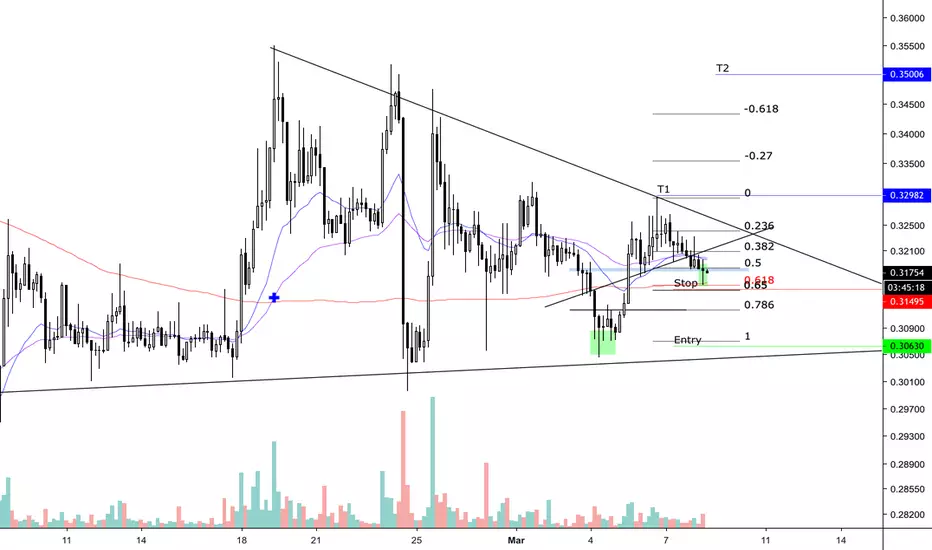
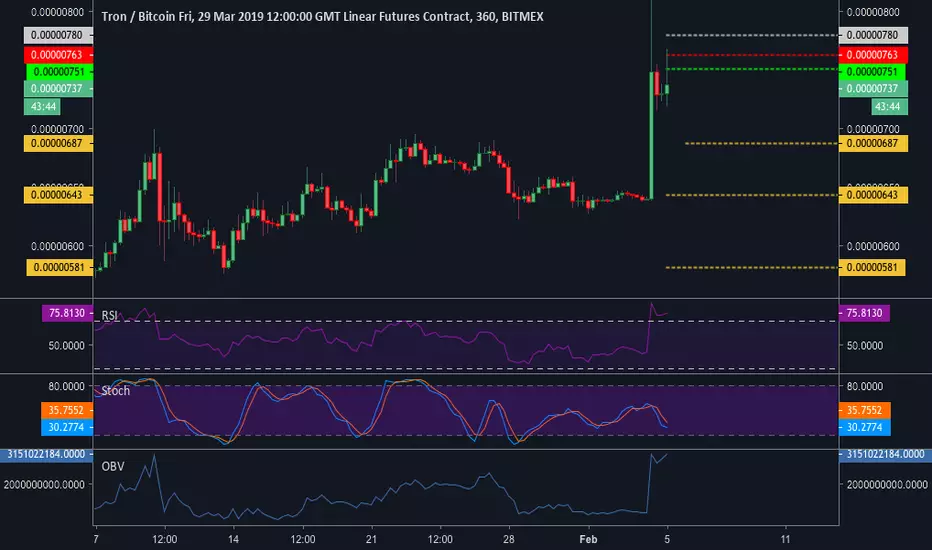
TRXPrevious TRX short was stopped out with minimal loss. SL had moved down after position was in profit, so total loss was 5% of trading/mex account or 0.003% of total account.
The pump on Bitmex was a high probability scenario as mentioned before. I am going to assume the main manipulation is over and have reentered on the current pump. Position size is smaller for now. Considering this a high risk trade as Large players are obviously throwing their weight around with TRX at the moment.
SL (grey)
Entry (green ) filled
Additional short orders (red)
TPs (orange)
Difference between spot and futures PA is glaring
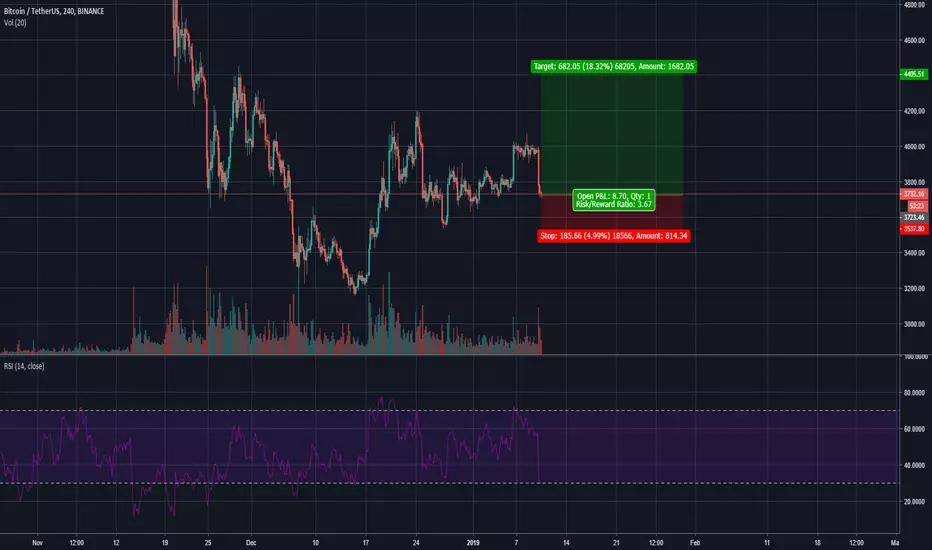
Long position opportunity !!! Hi there!
Here is my first publication here in Tradingview.
The reason to make this move is because, IMO of course there is no reason more than a little whale selling and causing this little flashcrash. The most logic movement now, is to buy this "dip". Flashcrashes never determine longterm trends.
By the way, since the begioning of 2018, the price has decreased 90% of its value so, in my opinion, at the moment, there is no more value in selling/shorting and every sell happen after the 6000$ range is an opportunity, very oversold now, RSI very low too and Momentum is decreasing in 1W candles.
Stoploss is set at around 5% wich is the previous minimun placed.
Opportunity for a small trade.
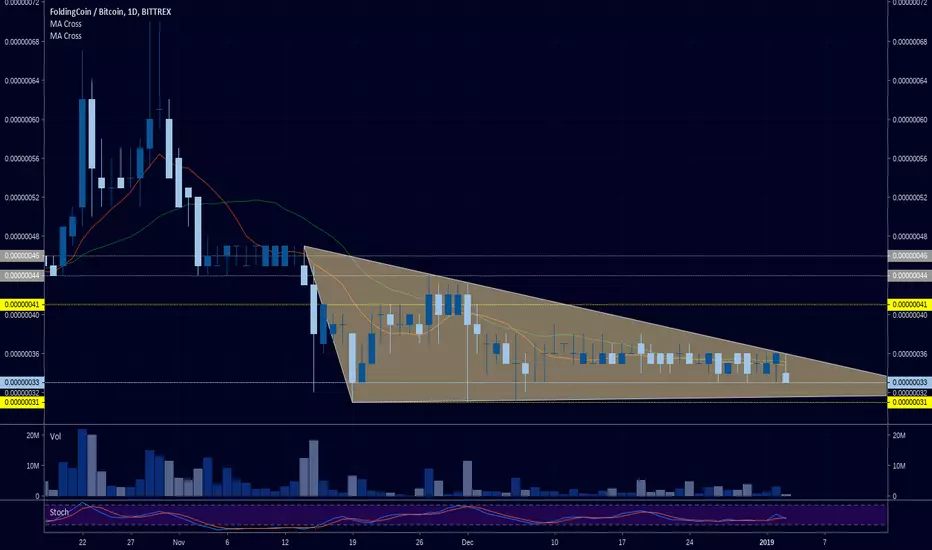
#FLDC long termStarting the new year with my tradingview charting practice and also improving my skills. This time I'm bringing you an altcoin that is called FoldingCoin and it has to do with online betting. I started to watch this altcoin when I managed to get some for very cheap and sell for almost 3 times its value at the time. This one in particular its been going in a down trend for quite a long time following some other major coins. The main problem that I'm seeing is that it is just above the lowest monthly level I've draw and its bouncing within the week resistance and the monthly support if it breaks it it could go toward the weekly lowest. If it can keep on accumulating without breaking the wedge towards the bottom line it can start a new move upwards and recover some of its previous week looses.
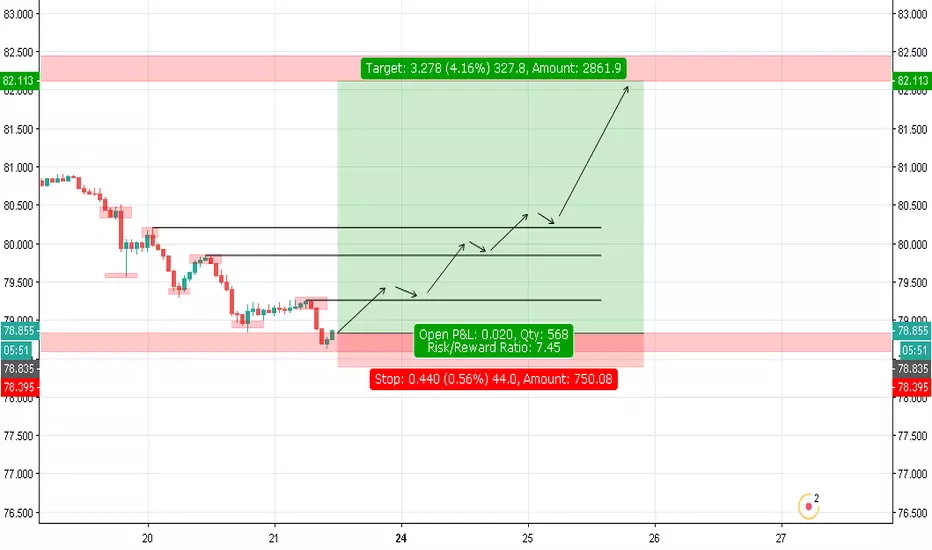
AUDJPY LONGswing setup for AUDJPY, on the daily chart you will be able to clearly see that this pair has touched a major PRZ level, on the hourly chart i have mapped out possible scenarios of how AUDJPY will react to different sup/resis levels, before it makes its way up to 82.110
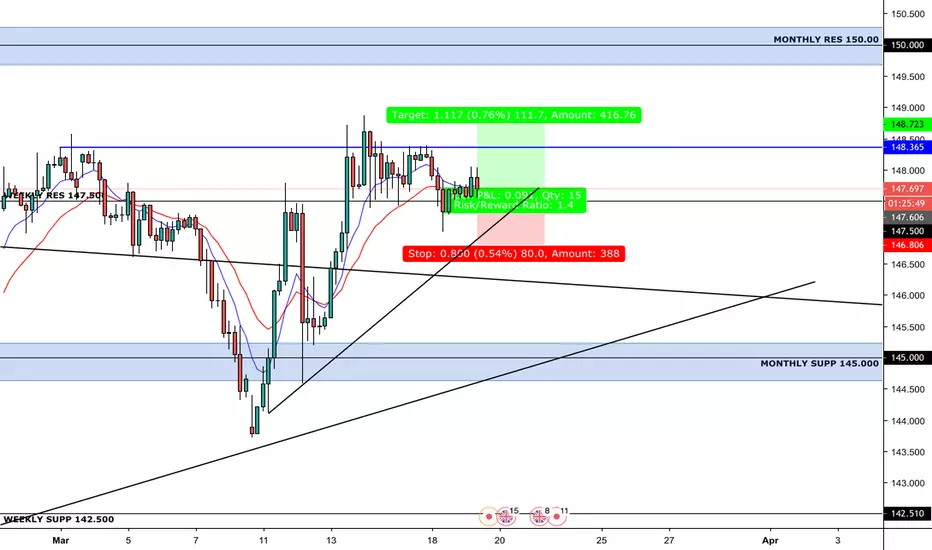
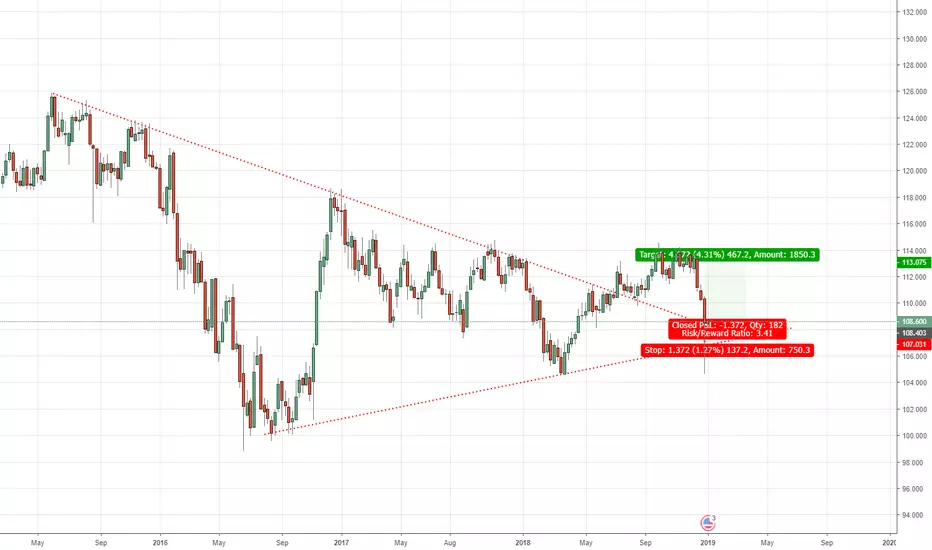
GBP/JPY Trading plan.Hey! I am back, this time with something completely different, Forex.
If you are interessted in some boring talking, go ahead and read why forex is better than trading crypto.
As its way more mature market, and is not bound to anything, for example as each crypto is bound to Bitcoin.
I am not leaving crypto market, I am holding my XRP tokens and starting to trade this market as I can accumulate profit more easily, dont get me wrong, even on Crypto market I was in profit during the whole crash trough 20,000 to 3,000 but unfortunately in Bitcoin value.
In forex I can fully use my technical and trading skills and make another step of mastering trading, as I managed to double my Deposit just in three weeks with 0.01 iot on each trade.
Being unable to set stop loss on Binance, before you were in a trade was really big dissadvantage to me, and the fact that you can only have opened positions only from Bitcoin value you own, wasnt really good too.
So Forex Market it is, lets move on the chart and actual trading plan.
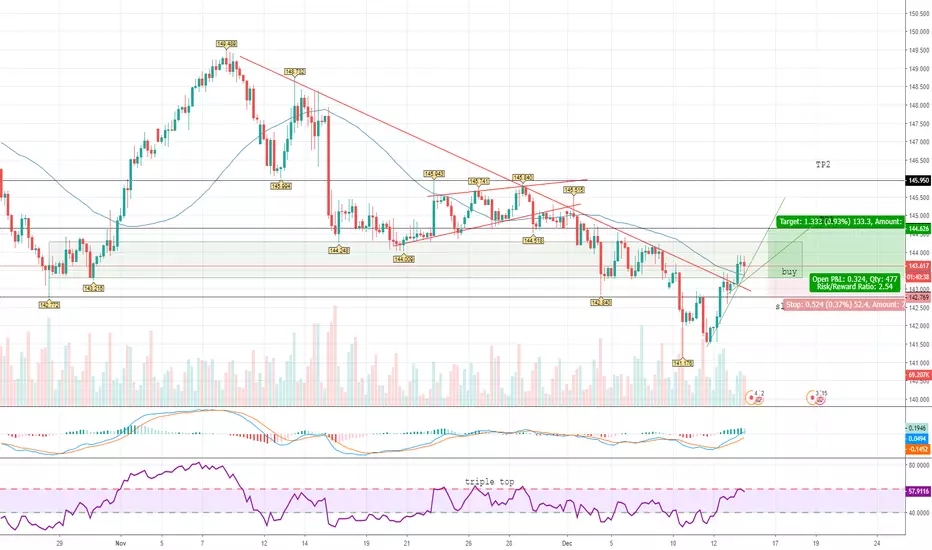
Long. Why?
Downtrend has been broken
Area ressistance was broken
50MA was broke
Buy signal was given on higher timeframes.
Oversold.
Here are levels for the trade.
Buy around 143.300
Stop loss below 142.800
Take profit below 144.600
Thats all from me, for now.
If you agree with this Technical Analysis , consider leaving that "Agree Button" blue, as it leads me to post more similiar Technical Analysis .
Thanks for your time and good luck trading!