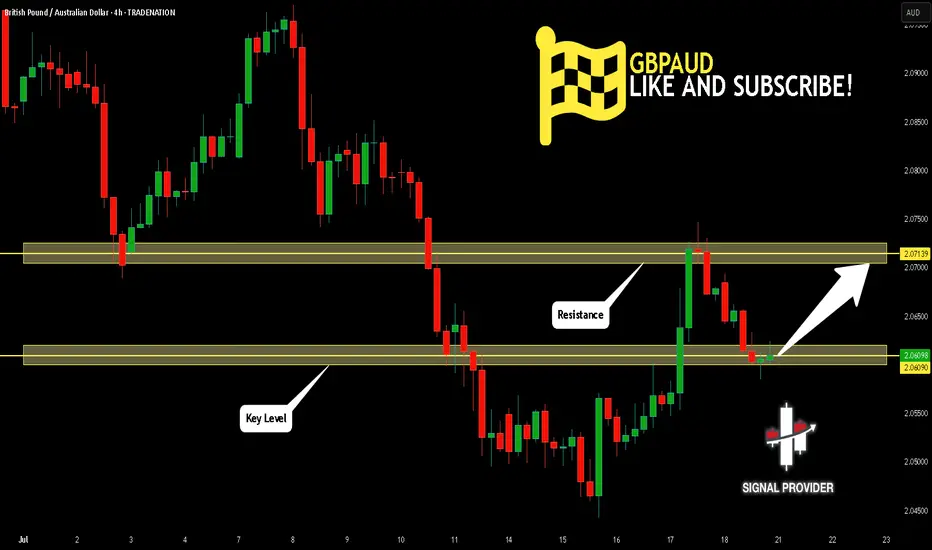
GBPAUD Will Go Up From Support! Long!
Here is our detailed technical review for GBPAUD.
Time Frame: 4h
Current Trend: Bullish
Sentiment: Oversold (based on 7-period RSI)
Forecast: Bullish
The market is on a crucial zone of demand 2.060.
The oversold market condition in a combination with key structure gives us a relatively strong bullish signal with goal 2.071 level.
P.S
We determine oversold/overbought condition with RSI indicator.
When it drops below 30 - the market is considered to be oversold.
When it bounces above 70 - the market is considered to be overbought.
Disclosure: I am part of Trade Nation's Influencer program and receive a monthly fee for using their TradingView charts in my analysis.
Like and subscribe and comment my ideas if you enjoy them!
LONG
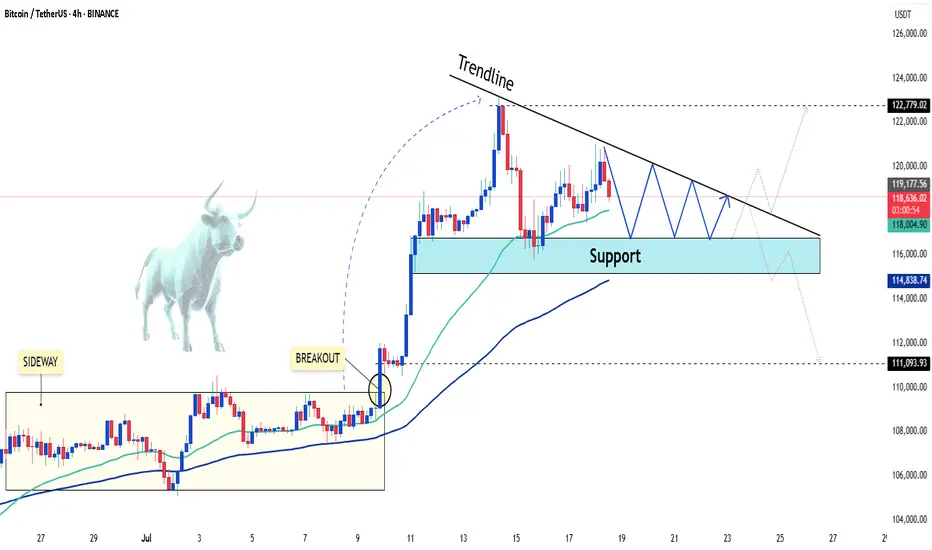
BTCUSDT: A Period of Adjustment and the Next TrendAfter a strong rally to record highs, BTCUSDT is currently entering a period of slight correction. The coin is now trading around 118,500 USD, down more than 0.57% on the day.
From a technical perspective, BTCUSD is moving within a narrowing price wedge, showing a slight downtrend. The support level at 116,500 USD is acting as a springboard for the Bulls. However, as the price approaches the tip of the wedge, a breakout may occur at any time, with two possible scenarios highlighted on the chart.
My personal outlook is that BTCUSDT will continue to decline in the short term before breaking out of the wedge in an upward direction. What do you think about BTCUSDT?
Please share your thoughts in the comments and don’t forget to like this post!
Wishing you all happy and successful trading!
FET Setup: Reclaim, Retest, RallyScenario:
Price reclaimed the 1W order block (OB), confirming strong support in the $0.60–$0.70 area.
If price consolidates above this weekly OB, expect continuation toward the $0.96 equilibrium/resistance zone.
A pullback to retest the 1W OB as support (especially in August) is possible and would be a high-probability entry zone for longs.
Failure to hold the 1W OB would invalidate the bullish setup, so stops should be placed below this level.
Reasoning:
The successful reclaim of the weekly order block signals a structural shift from bearish to bullish. Holding above this area invites further upside, as demand is confirmed. A retest and bounce from the 1W OB would provide a strong confirmation for additional upside, while failure to hold would indicate the move was a deviation. Patience for a clean retest is likely to reward, with targets toward the equilibrium near $0.96.

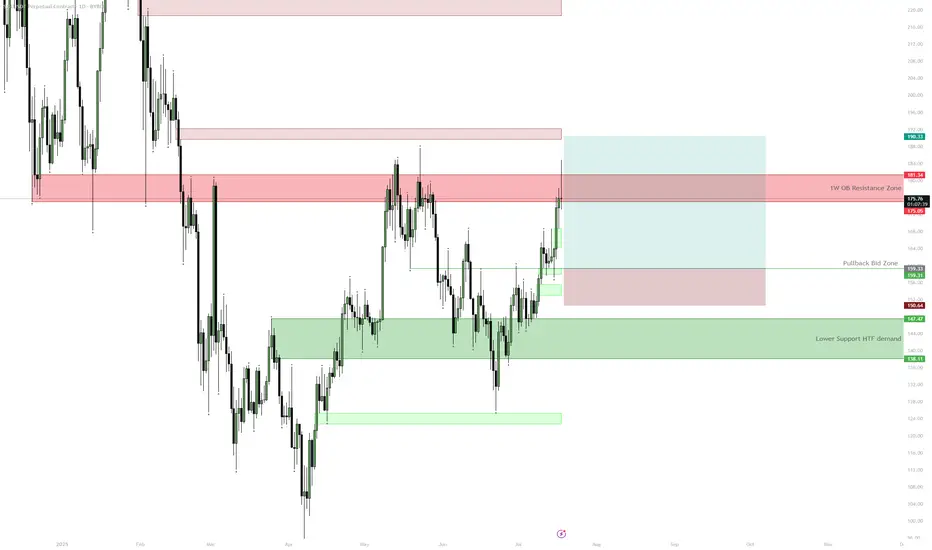
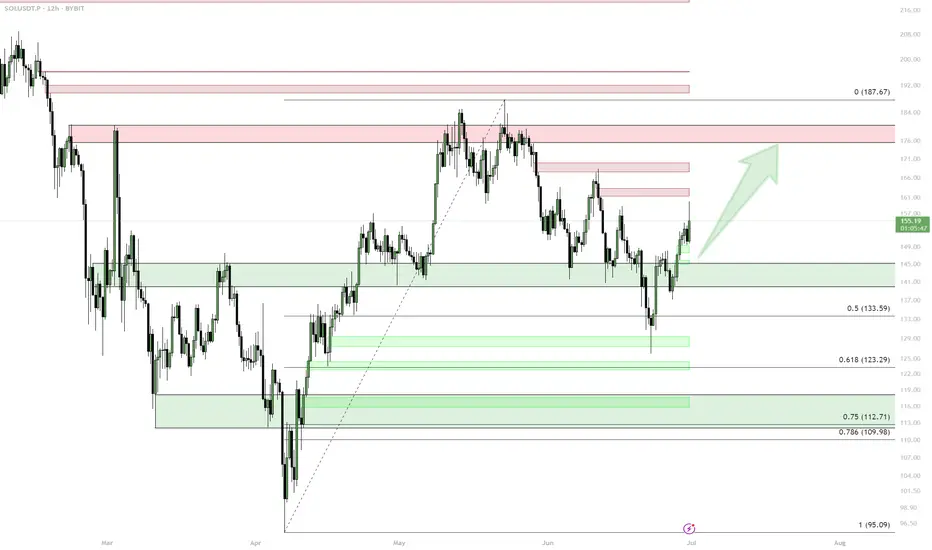
SOL — $180 HTF Resistance | Consolidation ExpectedSOL is approaching a key HTF resistance zone at $175–$181 with 1D RSI close to overbought. Unless price cleanly breaks above this area, a pullback to $160 or even the $138–$147 demand zone is likely before further upside. The setup provides a better risk/reward for longs on pullbacks after consolidation rather than chasing at resistance.
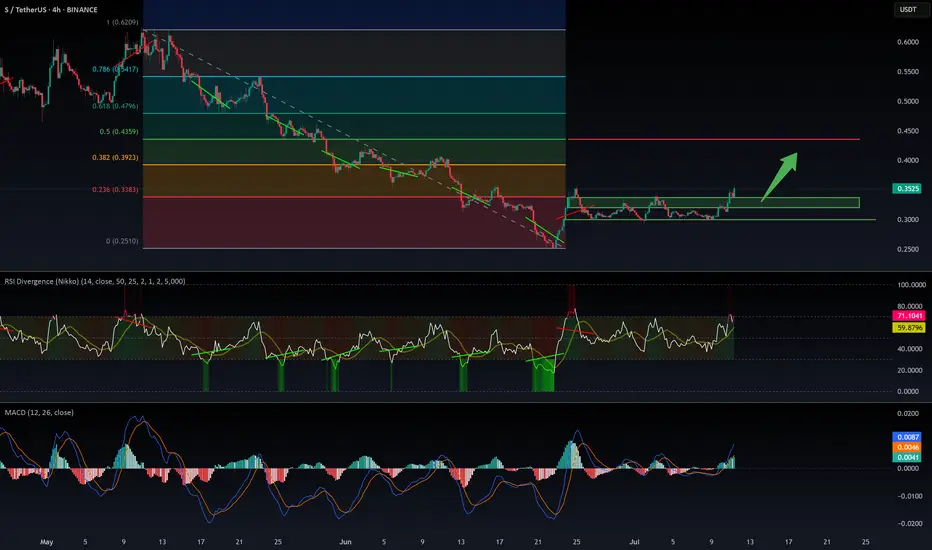
$SUSDT (or S , ex FANTOM): good entry for a long setupCrypto Market Outlook
The overall crypto market is in a clear uptrend.
The money printer is running, and USD dominance is dropping — all signs pointing to a potential continuation of the rally in the coming months.
Unless a black swan event hits, it's not too late to position yourself if you’re still on the sidelines.
⚠️ Always manage your risk with a proper stop loss — altcoins move fast and can reverse just as quickly.
One interesting setup: $S
✅ Relatively new
✅ Didn’t pump too hard
✅ Broke out of its downtrend
✅ Found solid support
The Fib levels offer good targets for take profit zones.
🔍 Ideal entry: within the green box or lower.
Let the pump cool off — it could offer a perfect entry opportunity. Be patient and wait for a good position.
If $S pumps from here without retrace:
→ Jump in with a tight stop loss
→ Or look elsewhere for a better risk/reward setup.
DYOR.
#Crypto #Altcoins #Bitcoin #ETH #Trading #CryptoMarket #TechnicalAnalysis #RiskManagement #DYOR
SOL Breakout — Eyeing $180 NextCRYPTOCAP:SOL | Breakout above channel — main target $180 next.
Watch $140–145 for retest/bounce. If failed, $112 is major support.
Trend: Bullish | Next stop: $180
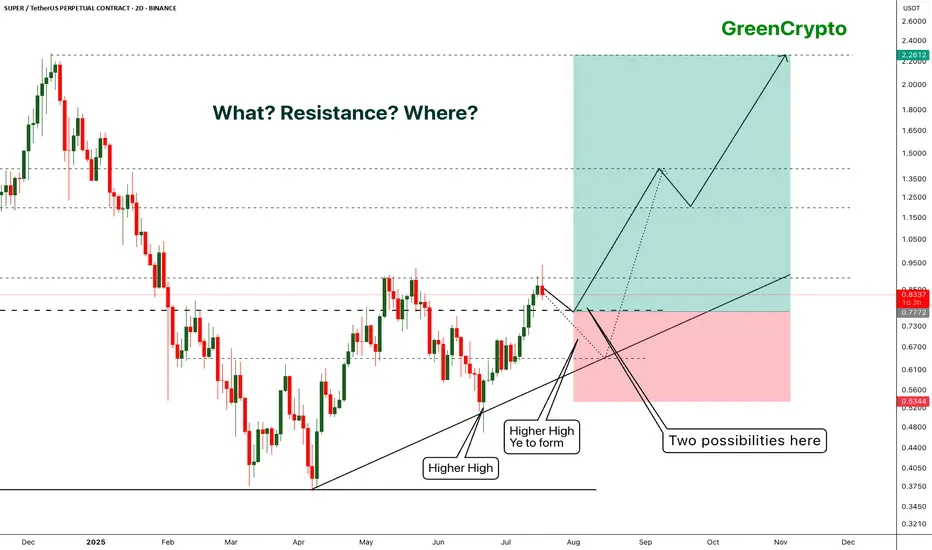
SUPER - Getting ready for the super run- Price is trading near the resistance after forming higher high.
- it's highly likely that price will get rejected around the resistance and will form another higher high.
- this is an excellent opportunity for us to enter the trade.
Entry Price: 0.7322
Stop Loss: 0.5344
TP1: 0.8939
TP2: 1.0517
TP3: 1.2867
TP4: 1.6336
TP5: 2.2243
Max Leverage 5x.
Don't forget to keep stoploss.
Support us by Liking and following.
Thanks and Cheers!
GreenCrypto
JTO — 1D Trend Breakout & MSS Hold1. Buy zone: 1.86–1.95 (hold above 1D S/R + MSS)
2. Entry: after trend breakout + MSS confirmation
3. Target: FVGs above, full tp 2.78
4. Stop: below 1.76

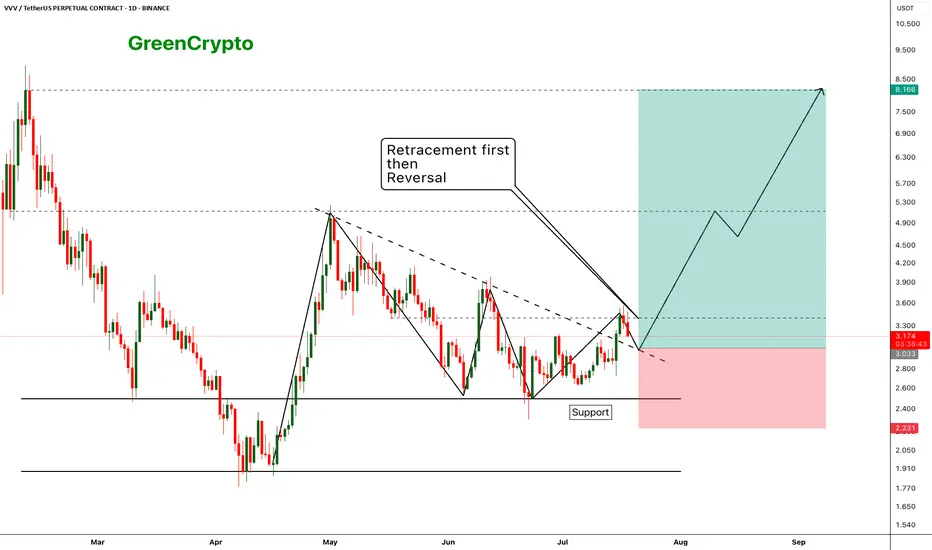
VVV - Expecting perfect reversal after the retracement- price has broken out from the resistance trendline and now we are seeing a retracement as expecting
- Price should hold the support (previous resistance) and reverse from the suppport zone.
- we can enter our trade once the retracement completed
Entry Price: 3.033
Stop Loss: 2.231
TP1: 3.411
TP2: 4.037
TP3: 4.851
TP4: 6.360
TP5: 8.028
Max Leverage 5x.
Don't forget to keep stoploss.
Cheers!
GreenCrypto
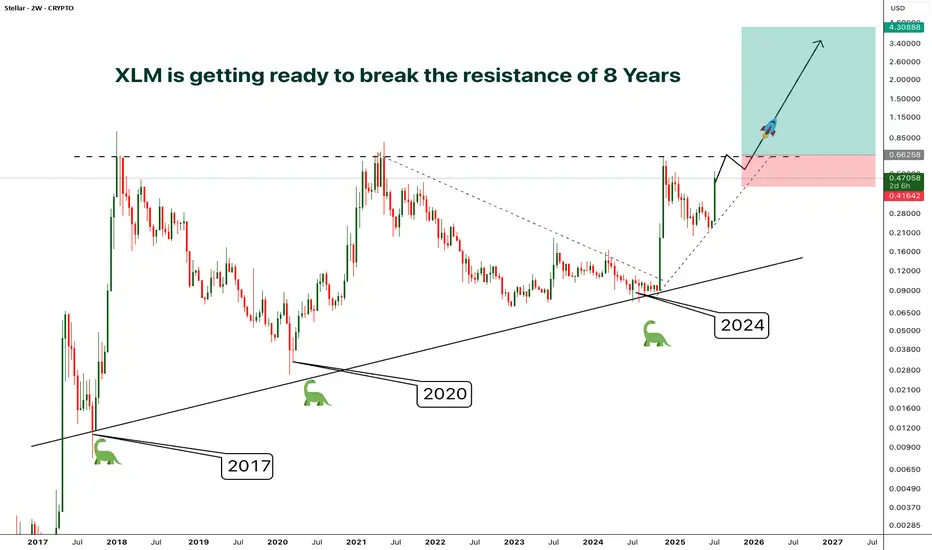
XLM - Resistance/Consolidation of 8 Years- Finally after 8 years of consolidation and getting rejected by the resistance at the same level around 0.65, XLM is preparing to break out from the almost decade old resistance
- A clear breakout from this resistance will phenomenal
- The price surge after the breakout will be unlike anything you've ever seen.
- I'm planning to enter after a confirmed breakout, entry before the breakout will be risky in case if the price gets rejected again.
Entry Price: Candle closeAbove 0.65
Stop Loss: Below 0.41
TP1: 0.88574
TP2: 1.21012
TP3: 1.92545
TP4: 2.68849
TP5: 4.27772
Don't forget to keep stoploss
Cheers
GreenCrypto
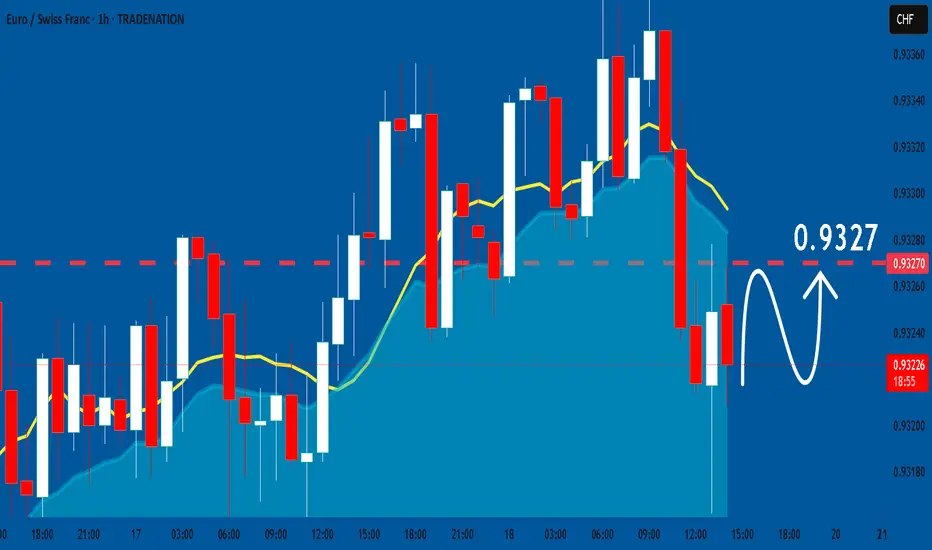
EURCHF: Bullish Continuation is Highly Probable! Here is Why:
Remember that we can not, and should not impose our will on the market but rather listen to its whims and make profit by following it. And thus shall be done today on the EURCHF pair which is likely to be pushed up by the bulls so we will buy!
Disclosure: I am part of Trade Nation's Influencer program and receive a monthly fee for using their TradingView charts in my analysis.
❤️ Please, support our work with like & comment! ❤️
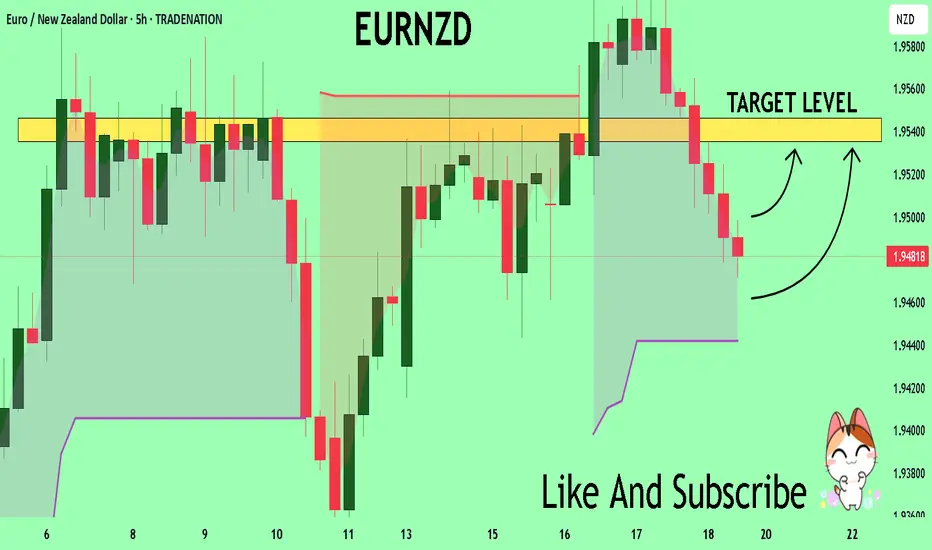
EURNZD On The Rise! BUY!
My dear friends,
EURNZD looks like it will make a good move, and here are the details:
The market is trading on 1.9481 pivot level.
Bias - Bullish
Technical Indicators: Supper Trend generates a clear long signal while Pivot Point HL is currently determining the overall Bullish trend of the market.
Goal - 1.9535
About Used Indicators:
Pivot points are a great way to identify areas of support and resistance, but they work best when combined with other kinds of technical analysis
Disclosure: I am part of Trade Nation's Influencer program and receive a monthly fee for using their TradingView charts in my analysis.
———————————
WISH YOU ALL LUCK
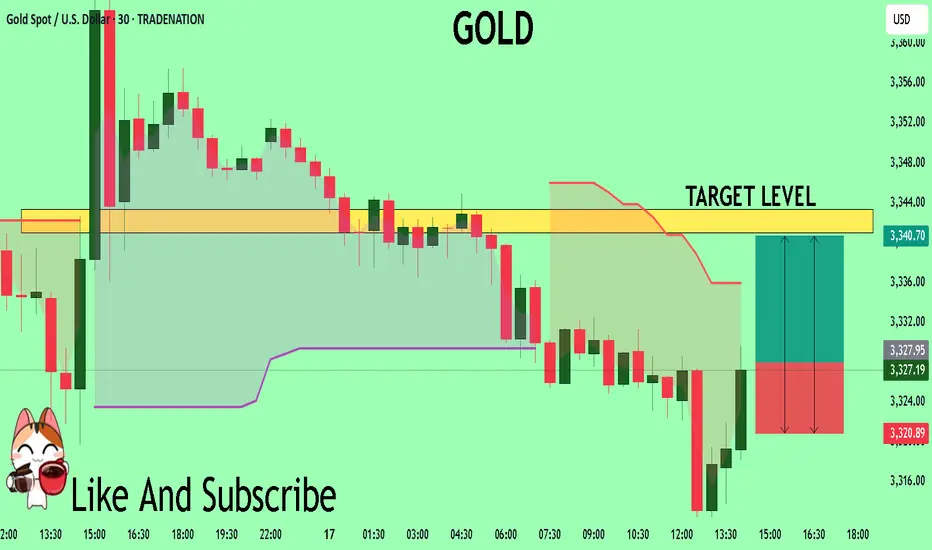
GOLD What Next? BUY!
My dear friends,
GOLD looks like it will make a good move, and here are the details:
The market is trading on 3328.1 pivot level.
Bias - Bullish
Technical Indicators: Supper Trend generates a clear long signal while Pivot Point HL is currently determining the overall Bullish trend of the market.
Goal - 3340.9
Recommended Stop Loss - 3320.8
About Used Indicators:
Pivot points are a great way to identify areas of support and resistance, but they work best when combined with other kinds of technical analysis
Disclosure: I am part of Trade Nation's Influencer program and receive a monthly fee for using their TradingView charts in my analysis.
———————————
WISH YOU ALL LUCK
XRPUSD - Why I see that Ripple even higherMedianlines, aka "Forks" have a simple but effective ruleset inherent. These rules describe the movement in certain situations. And of course, the most probable path of wher price is trading to.
Here we a rule in play that projects more movement to the upside, even if BTCUSD has had a strong pullback to the south.
Let's see:
If price is closing above a Centerline, then chances are high that it will retest it. If it holds and starts to continue it's path (to the upside), then the next target is the U-MHL, or the Upper Medianline Parallel, was Dr. Allan Andrews named it back many decades ago.
So, there we have it.
Chances are high that Ripple will reach new highs, with a final target at the U-MLH.

ETH 1D Overview Finally we are seeing altcoins regaining lost ground on Bitcoin and the second largest crypto by market cap is rallying strong.
Since ETH has such strength currently the opportunity to short is quite slim with high risk, however I think it's important to see where ETH may find some resistance or if a pullback was to happen, where would it come from?
The first level is the bearish orderblock level that has just been tapped as of writing. This area previously began the sell-off at the end of 2024 by confirming a new lower high. Naturally this area will present problems for the bulls and so a potential pullback could be initiated from this level. I would like to see a sweep of the stop loss positions just above the area and then a SFP to confirm the pullback is in motion.
Should the bearish orderblock fail the next clear level is the daily local top around $4000. A big even level and the area that started 5 months of downtrend. IMO the most likely level where longs will take profit. I do think if we see any form of consolidation between the bearish orderblock and the local high the bulls will look to carry the rally on, shallow pullbacks maintain momentum
Ten out of the last eleven days have been green candles with the only one day being red just above a key high, I expect if we are to get a pullback that bullish orderblock area ($2900-3000) to be retested as support. Therefor if any of the above areas initiate a pullback this area should provide support and therefor a long entry.
To clarify I am in no way bearish about Ethereum, this is just a plan for different eventualities.

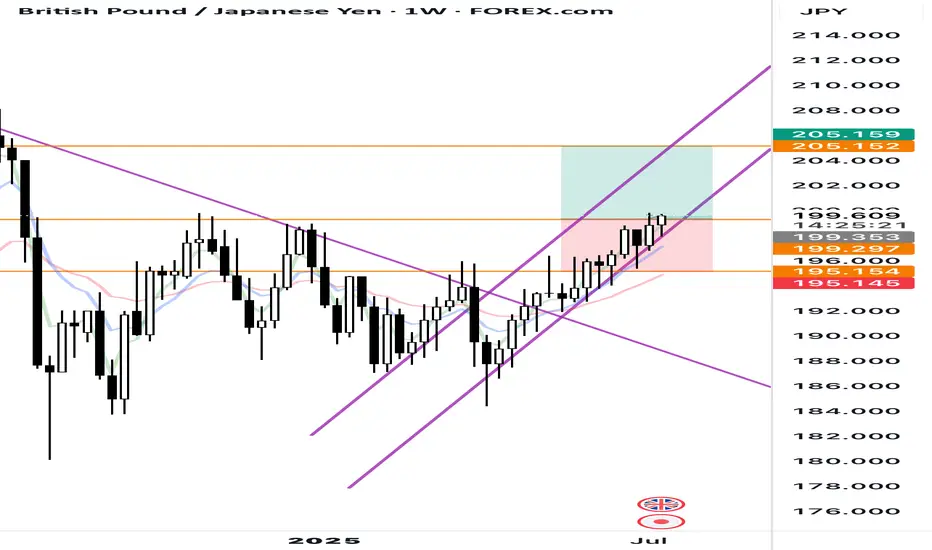
GBPJPY long outlook Looks like we just broke resistance area now heading up to next resistance area level.
I have set some support and resistance lines to project my outlook .
What do you it’s think?
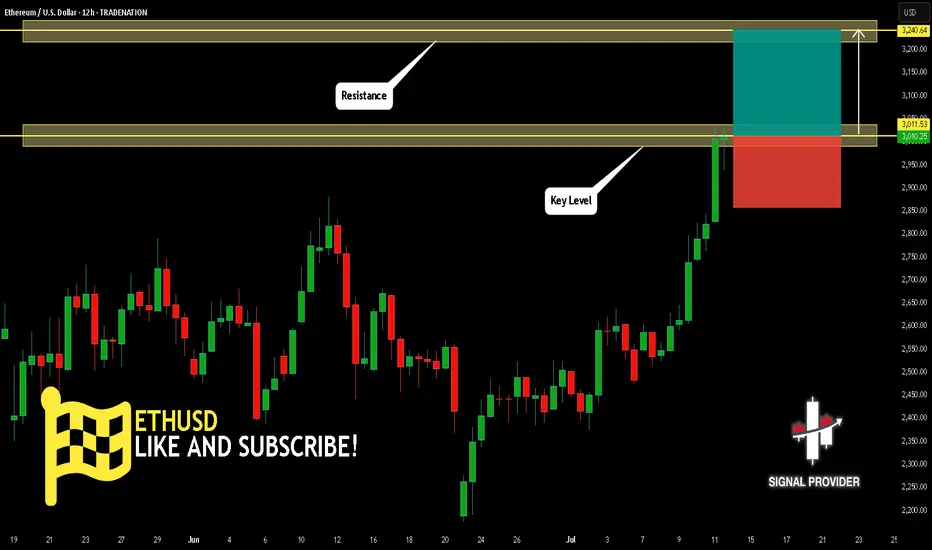
ETHUSD Is Going Up! Buy!
Please, check our technical outlook for ETHUSD.
Time Frame: 12h
Current Trend: Bullish
Sentiment: Oversold (based on 7-period RSI)
Forecast: Bullish
The market is approaching a key horizontal level 3,011.53.
Considering the today's price action, probabilities will be high to see a movement to 3,240.64.
P.S
The term oversold refers to a condition where an asset has traded lower in price and has the potential for a price bounce.
Overbought refers to market scenarios where the instrument is traded considerably higher than its fair value. Overvaluation is caused by market sentiments when there is positive news.
Disclosure: I am part of Trade Nation's Influencer program and receive a monthly fee for using their TradingView charts in my analysis.
Like and subscribe and comment my ideas if you enjoy them!
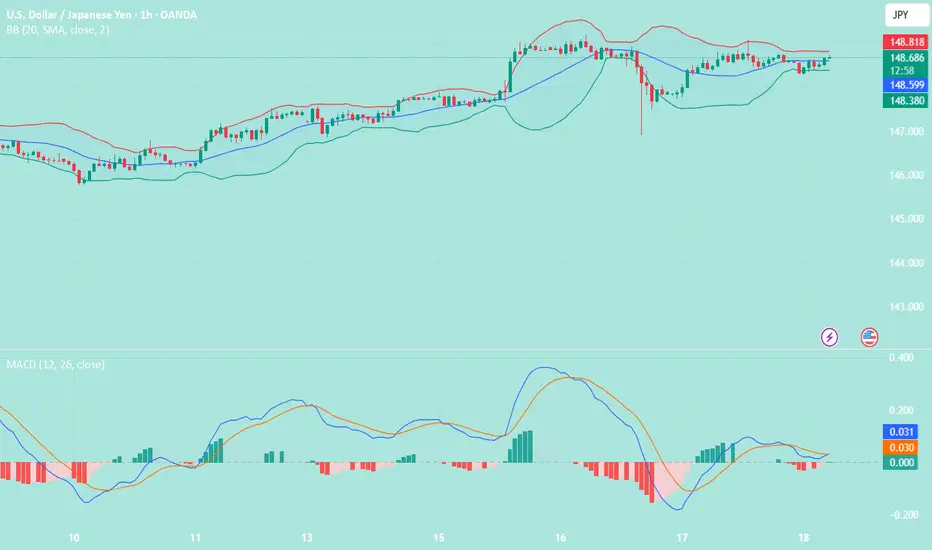
USD/JPY(20250718)Today's AnalysisMarket news:
① Kugler: It is appropriate to keep the interest rate policy stable for "a while".
② Daly: Whether to cut interest rates in July or September is not the most critical.
③ Bostic: It may be difficult to cut interest rates in the short term.
Technical analysis:
Today's buying and selling boundaries:
148.45
Support and resistance levels:
149.80
149.30
148.97
147.93
147.61
147.10
Trading strategy:
If the price breaks through 148.97, consider buying in, the first target price is 149.30
If the price breaks through 148.45, consider selling in, the first target price is 147.93
Sweep On levels and Confirmation of Bullish pressure! Now that we have a sweep on levels we are looking for bullish pressure to continue. They have closed the 4Hr bullish. Being that it is Friday keeping expectation low cause price can break out and push hard or it can end up being Rotational. I feel there is a move here. We just have to wait for it to line up inside of the killzone. NOFOMO Mayn!

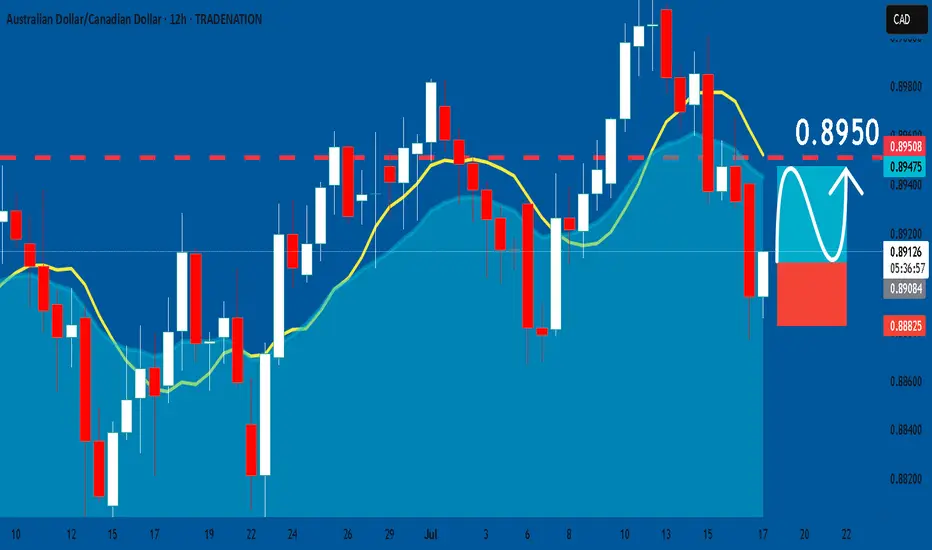
AUDCAD: Long Signal Explained
AUDCAD
- Classic bullish formation
- Our team expects pullback
SUGGESTED TRADE:
Swing Trade
Long AUDCAD
Entry - 0.8908
Sl - 0.8882
Tp - 0.8950
Our Risk - 1%
Start protection of your profits from lower levels
Disclosure: I am part of Trade Nation's Influencer program and receive a monthly fee for using their TradingView charts in my analysis.
❤️ Please, support our work with like & comment! ❤️
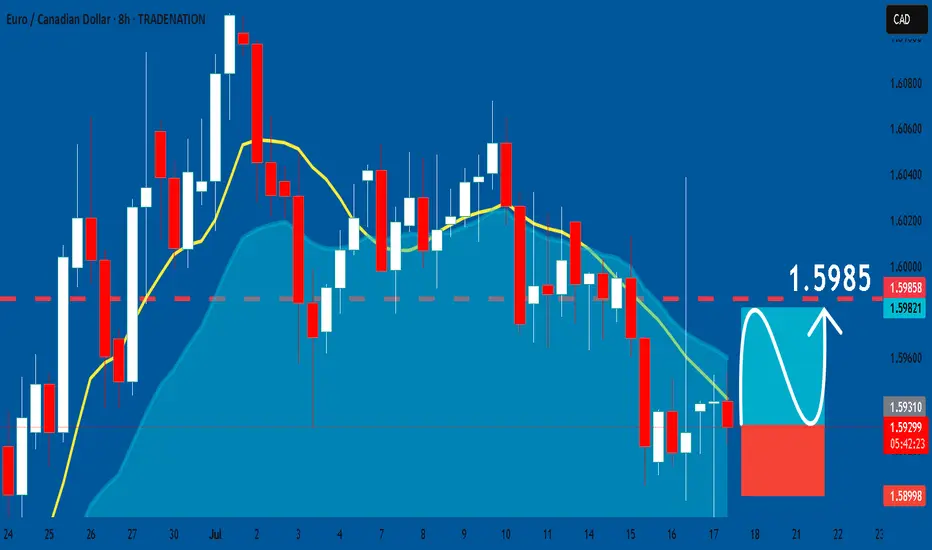
EURCAD: Long Signal with Entry/SL/TP
EURCAD
- Classic bullish pattern
- Our team expects retracement
SUGGESTED TRADE:
Swing Trade
Buy EURCAD
Entry - 1.5929
Stop - 1.5899
Take - 1.5985
Our Risk - 1%
Start protection of your profits from lower levels
Disclosure: I am part of Trade Nation's Influencer program and receive a monthly fee for using their TradingView charts in my analysis.
❤️ Please, support our work with like & comment! ❤️
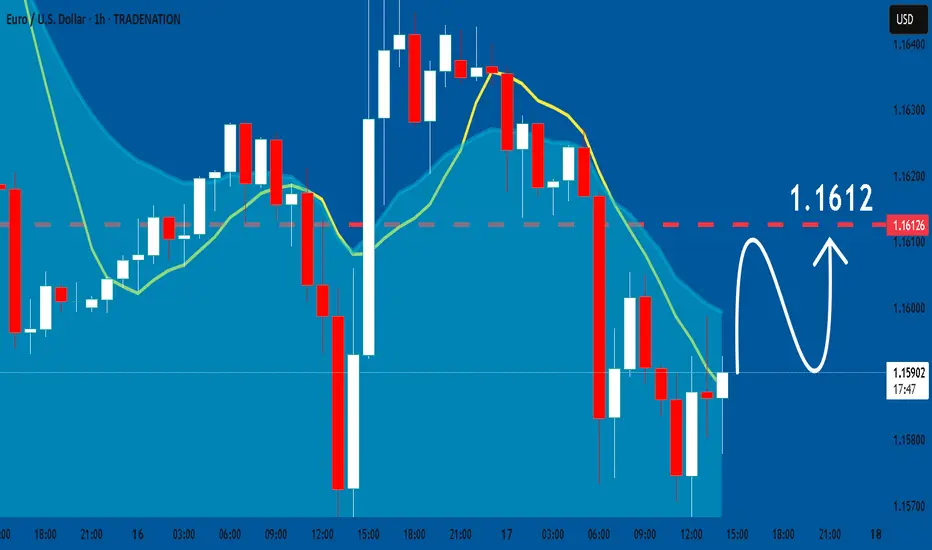
EURUSD: Bulls Will Push
Balance of buyers and sellers on the EURUSD pair, that is best felt when all the timeframes are analyzed properly is shifting in favor of the buyers, therefore is it only natural that we go long on the pair.
Disclosure: I am part of Trade Nation's Influencer program and receive a monthly fee for using their TradingView charts in my analysis.
❤️ Please, support our work with like & comment! ❤️
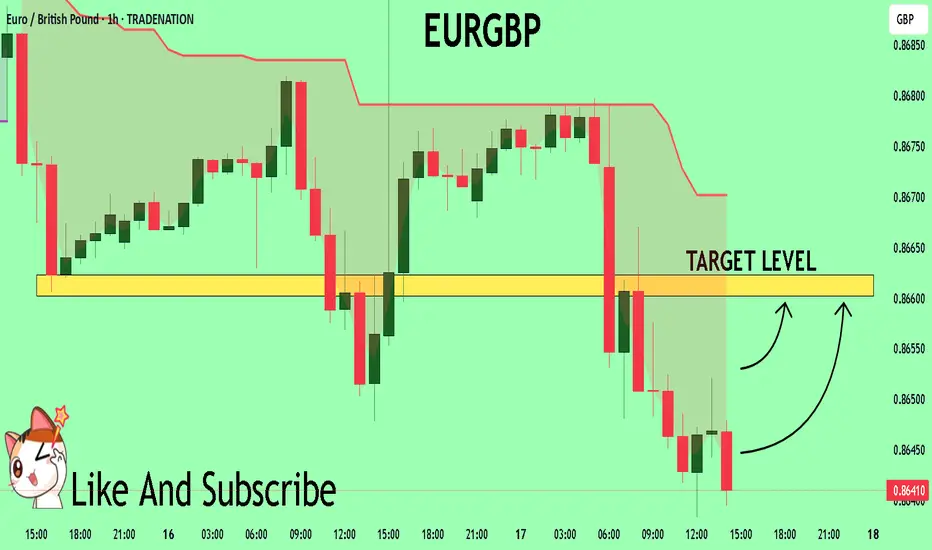
EURGBP Trading Opportunity! BUY!
My dear friends,
My technical analysis for EURGBP is below:
The market is trading on 0.8645 pivot level.
Bias - Bullish
Technical Indicators: Both Super Trend & Pivot HL indicate a highly probable Bullish continuation.
Target - 0.8660
About Used Indicators:
A pivot point is a technical analysis indicator, or calculations, used to determine the overall trend of the market over different time frames.
Disclosure: I am part of Trade Nation's Influencer program and receive a monthly fee for using their TradingView charts in my analysis.
———————————
WISH YOU ALL LUCK