GBPJPY Will Move Higher! Long!
Take a look at our analysis for GBPJPY.
Time Frame: 1h
Current Trend: Bullish
Sentiment: Oversold (based on 7-period RSI)
Forecast: Bullish
The market is approaching a key horizontal level 195.702.
Considering the today's price action, probabilities will be high to see a movement to 197.050.
P.S
Please, note that an oversold/overbought condition can last for a long time, and therefore being oversold/overbought doesn't mean a price rally will come soon, or at all.
Disclosure: I am part of Trade Nation's Influencer program and receive a monthly fee for using their TradingView charts in my analysis.
Like and subscribe and comment my ideas if you enjoy them!
LONG

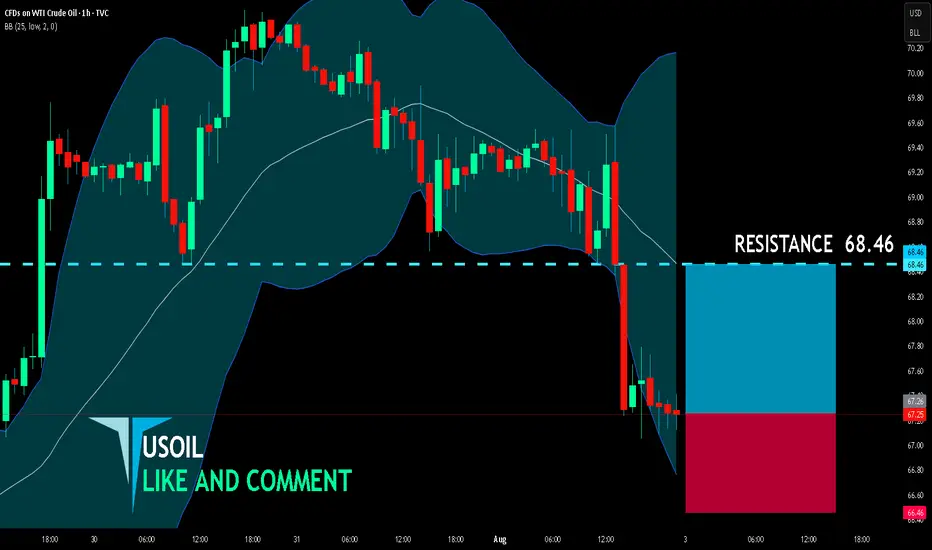
USOIL BULLS ARE STRONG HERE|LONG
USOIL SIGNAL
Trade Direction: short
Entry Level: 67.26
Target Level: 68.46
Stop Loss: 66.46
RISK PROFILE
Risk level: medium
Suggested risk: 1%
Timeframe: 1h
Disclosure: I am part of Trade Nation's Influencer program and receive a monthly fee for using their TradingView charts in my analysis.
✅LIKE AND COMMENT MY IDEAS✅
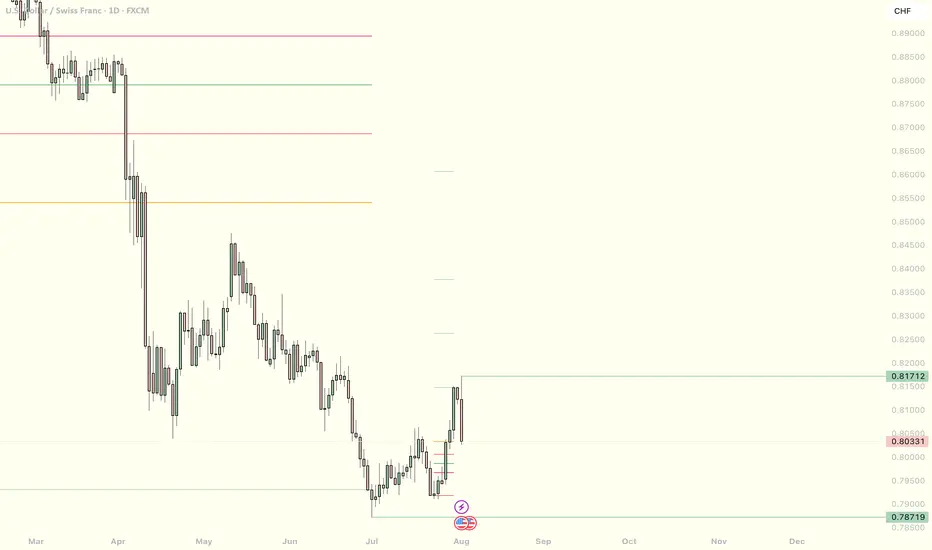
USDCHF Short term bullish?As dxy looks like it wants to run higher, USDCHF will likely also go higher for a short-term buying for a retracement to then continue its down trend. this pair looks good.
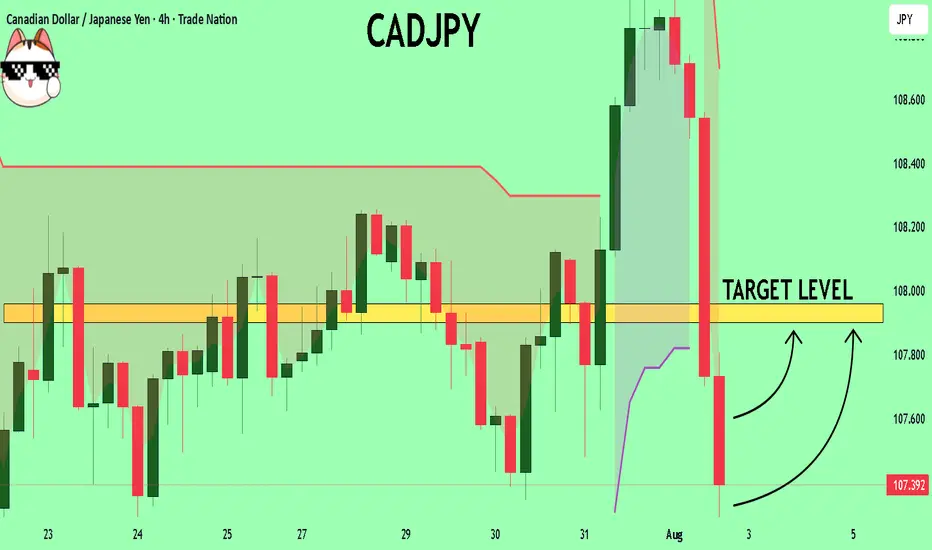
CADJPY Expected Growth! BUY!
My dear friends,
CADJPY looks like it will make a good move, and here are the details:
The market is trading on 107.35 pivot level.
Bias - Bullish
Technical Indicators: Supper Trend generates a clear long signal while Pivot Point HL is currently determining the overall Bullish trend of the market.
Goal - 107.90
About Used Indicators:
Pivot points are a great way to identify areas of support and resistance, but they work best when combined with other kinds of technical analysis
Disclosure: I am part of Trade Nation's Influencer program and receive a monthly fee for using their TradingView charts in my analysis.
———————————
WISH YOU ALL LUCK
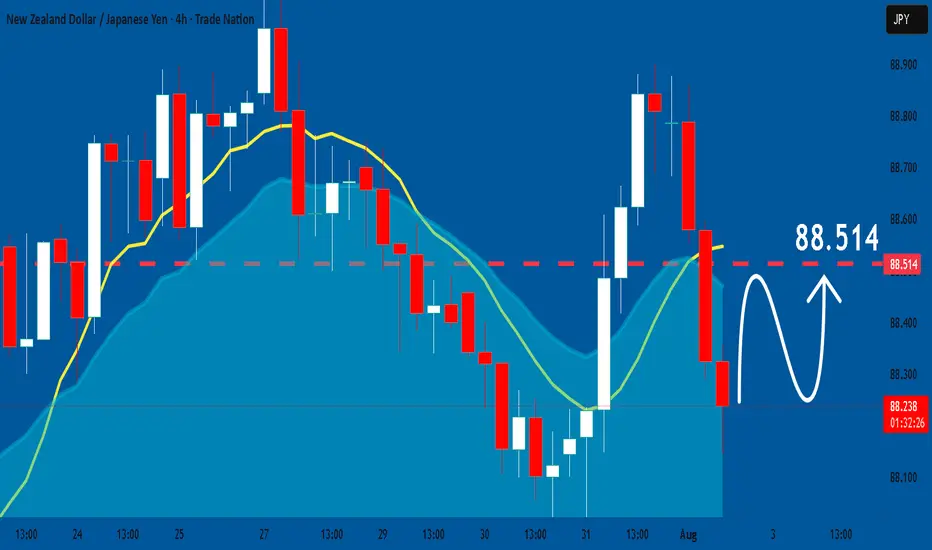
NZDJPY: Bullish Continuation
The recent price action on the NZDJPY pair was keeping me on the fence, however, my bias is slowly but surely changing into the bullish one and I think we will see the price go up.
Disclosure: I am part of Trade Nation's Influencer program and receive a monthly fee for using their TradingView charts in my analysis.
❤️ Please, support our work with like & comment! ❤️
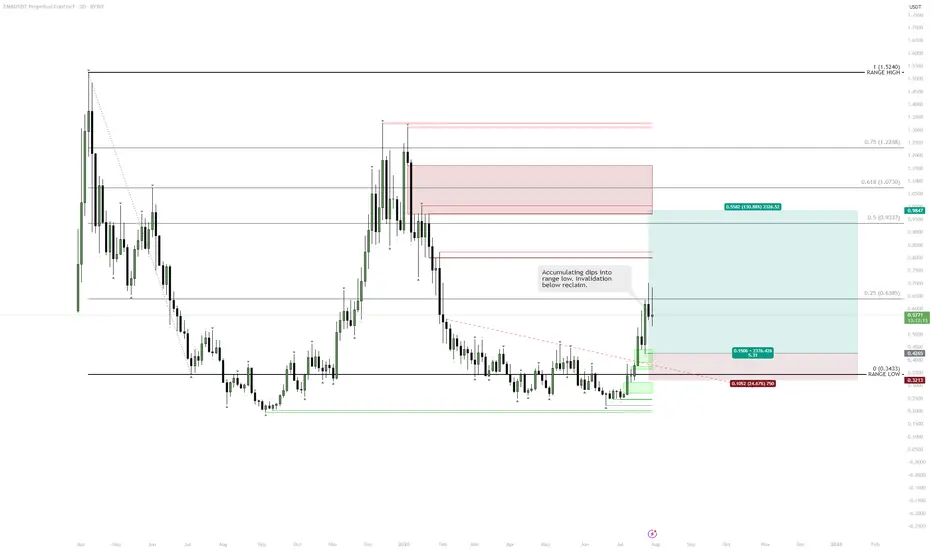
ENA | Range Low Reclaim — Targeting Midrange and AboveClear reclaim of the range low and a strong daily close confirm a bullish market structure shift.
Printing a higher high signals potential for continuation.
Dips toward the reclaimed range low are healthy, providing buy-the-dip opportunities.
Accumulation at the range low with invalidation below keeps risk tight.
Plan:
Accumulate pullbacks toward the range low.
Hold for midrange ($0.83) and upper range/major resistance.
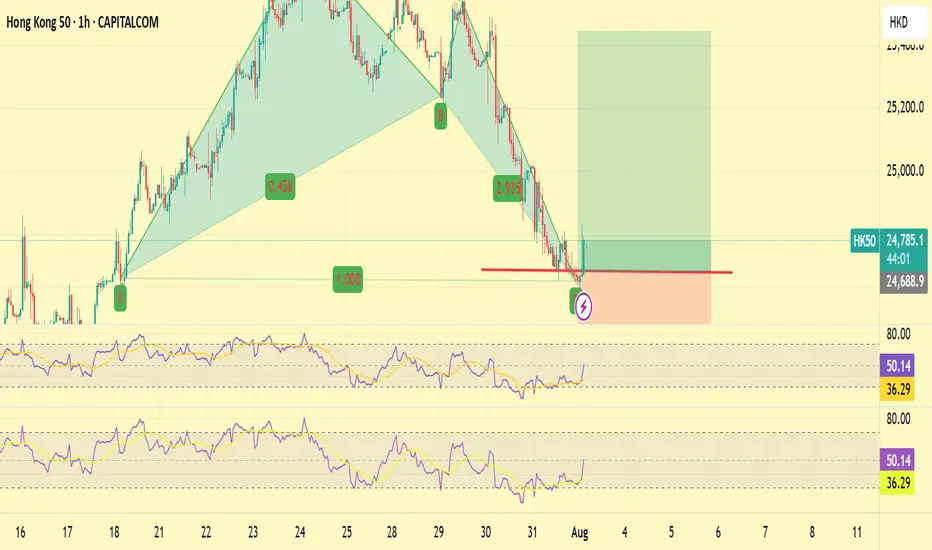
HK50 LONG This trade is with the daily trend and the showing the momentum still being very up
There are multiple bat patterns on H1 and M15
This trade is oversold on all timeframes up to H4 and showing divergence
Stop loss of 200 pips
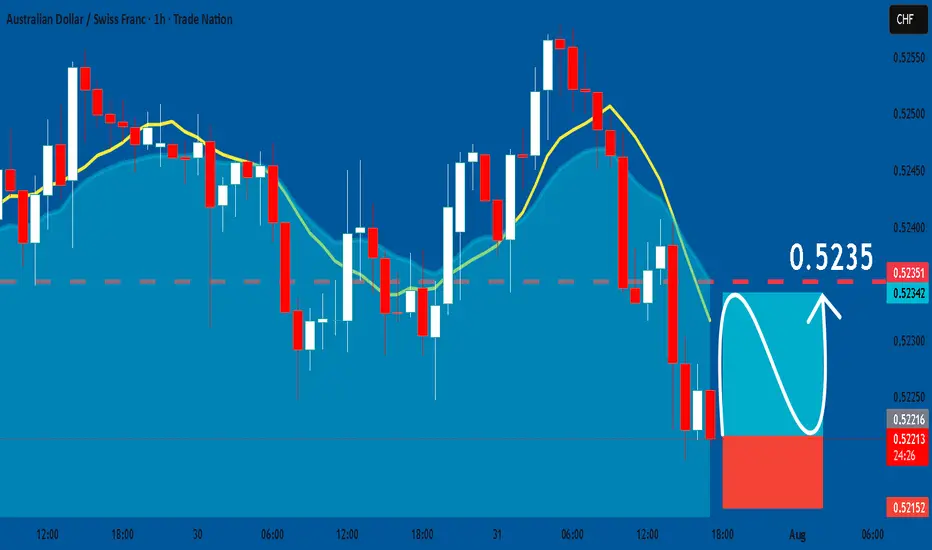
AUDCHF: Bullish Continuation & Long Signal
AUDCHF
- Classic bullish formation
- Our team expects pullback
SUGGESTED TRADE:
Swing Trade
Long AUDCHF
Entry - 0.5221
Sl - 0.5215
Tp - 0.5235
Our Risk - 1%
Start protection of your profits from lower levels
Disclosure: I am part of Trade Nation's Influencer program and receive a monthly fee for using their TradingView charts in my analysis.
❤️ Please, support our work with like & comment! ❤️
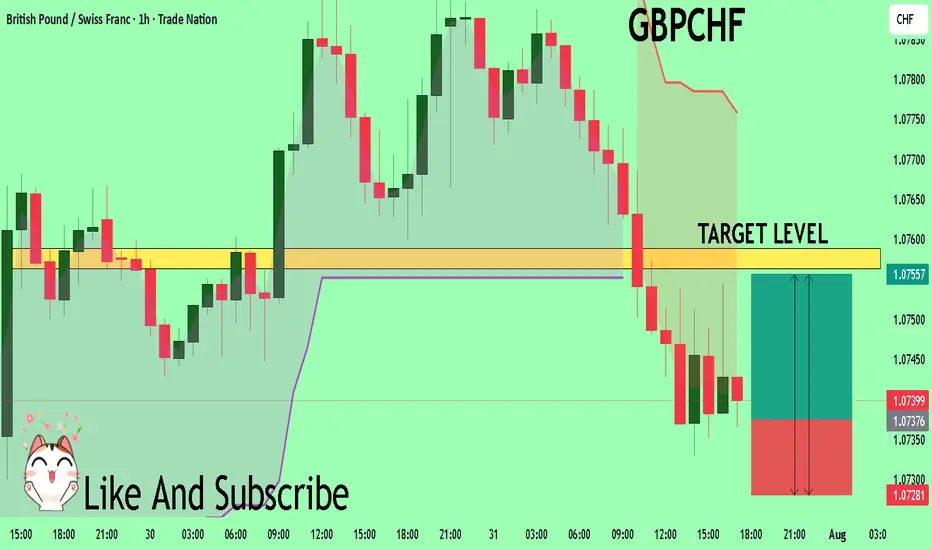
GBPCHF Trading Opportunity! BUY!
My dear followers,
This is my opinion on the GBPCHF next move:
The asset is approaching an important pivot point 1.0737
Bias - Bullish
Safe Stop Loss - 1.0728
Technical Indicators: Supper Trend generates a clear long signal while Pivot Point HL is currently determining the overall Bullish trend of the market.
Goal - 1.0756
About Used Indicators:
For more efficient signals, super-trend is used in combination with other indicators like Pivot Points.
Disclosure: I am part of Trade Nation's Influencer program and receive a monthly fee for using their TradingView charts in my analysis.
———————————
WISH YOU ALL LUCK
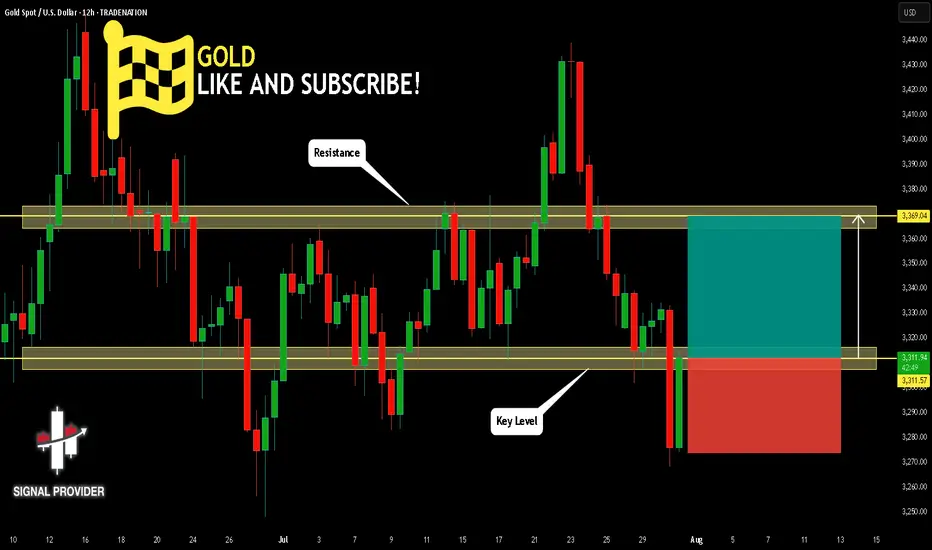
GOLD Will Go Higher From Support! Buy!
Here is our detailed technical review for GOLD.
Time Frame: 12h
Current Trend: Bullish
Sentiment: Oversold (based on 7-period RSI)
Forecast: Bullish
The market is testing a major horizontal structure 3,311.57.
Taking into consideration the structure & trend analysis, I believe that the market will reach 3,369.04 level soon.
P.S
The term oversold refers to a condition where an asset has traded lower in price and has the potential for a price bounce.
Overbought refers to market scenarios where the instrument is traded considerably higher than its fair value. Overvaluation is caused by market sentiments when there is positive news.
Disclosure: I am part of Trade Nation's Influencer program and receive a monthly fee for using their TradingView charts in my analysis.
Like and subscribe and comment my ideas if you enjoy them!
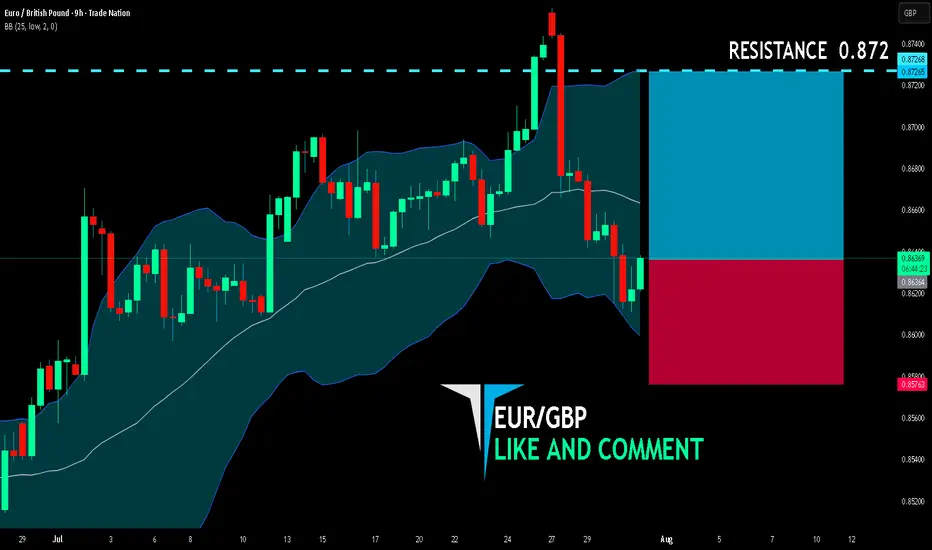
EUR/GBP BULLS ARE STRONG HERE|LONG
EUR/GBP SIGNAL
Trade Direction: long
Entry Level: 0.863
Target Level: 0.872
Stop Loss: 0.857
RISK PROFILE
Risk level: medium
Suggested risk: 1%
Timeframe: 9h
Disclosure: I am part of Trade Nation's Influencer program and receive a monthly fee for using their TradingView charts in my analysis.
✅LIKE AND COMMENT MY IDEAS✅
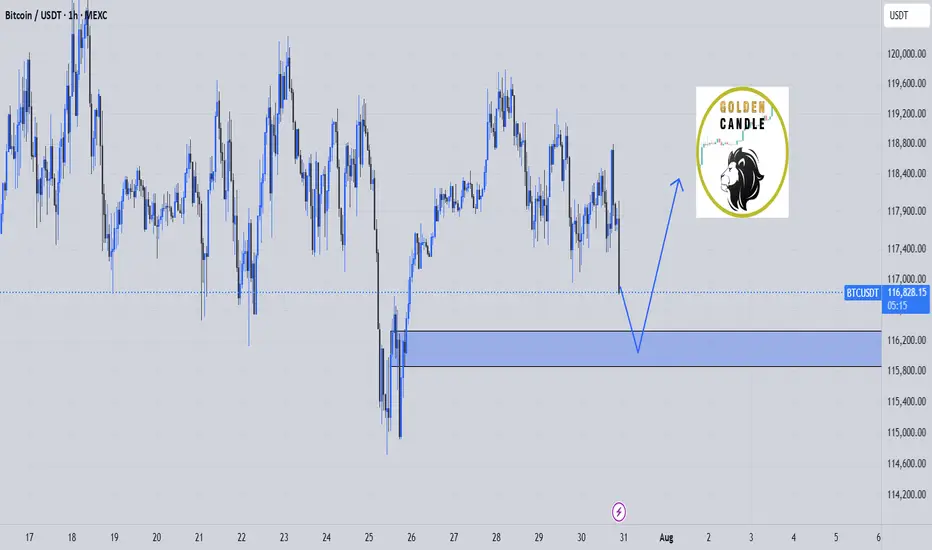
btc buy midterm"🌟 Welcome to Golden Candle! 🌟
We're a team of 📈 passionate traders 📉 who love sharing our 🔍 technical analysis insights 🔎 with the TradingView community. 🌎
Our goal is to provide 💡 valuable perspectives 💡 on market trends and patterns, but 🚫 please note that our analyses are not intended as buy or sell recommendations. 🚫
Instead, they reflect our own 💭 personal attitudes and thoughts. 💭
Follow along and 📚 learn 📚 from our analyses! 📊💡"
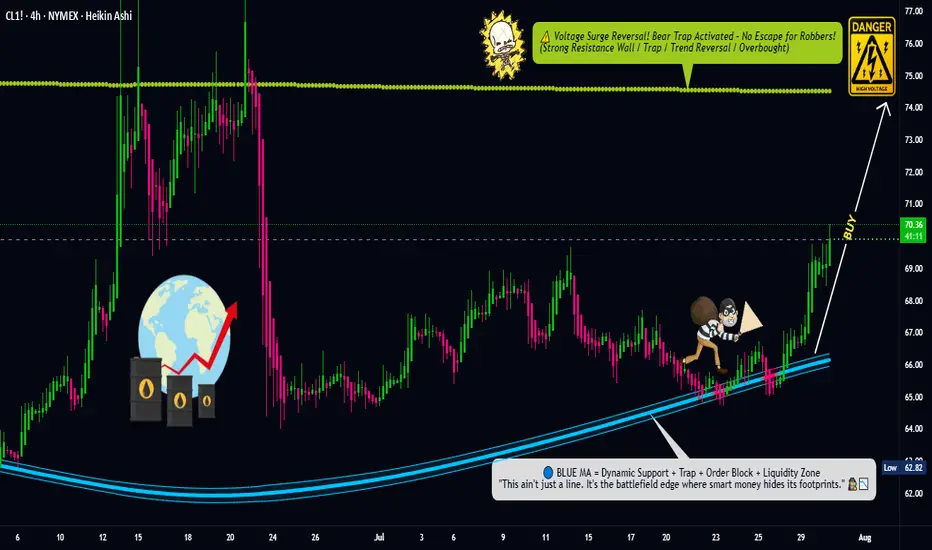
Oil Trap Activated – Limit Orders Set for the Big Score💥🛢️Crude Oil Vault Breach Plan – DCA Heist Begins!🧨💰
🚨Asset: CL1!
📈Bias: BULLISH RAID MODE ON
🎯Target: $74.50
🛡️Stop Loss: $67.50
🔑Entry: ANY LEVEL – Thief stacking limit orders like layers of gold bars 💼⚖️ (DCA Mode Activated)
🕵️♂️Thief Trader is not chasing, we're ambushing 🧠 — scaling in smart with multiple limit traps. The crew never FOMOs, we trap the market 🎯.
💣This is a layered loot plan, not for weak hands. Watch how we load up quietly while market sleeps 😴, then hit hard when the vault cracks open 🔐.
Support this heist by smashing that ❤️LIKE button
💬 Comment your plans below & join the real thief squad
🤝 Together we rob the market — LEGALLY & LOGICALLY
#ThiefTrader #OilHeist #CL1 #BullishTrap #DCA #CrudeOilStrategy #SmartMoneyPlay #MarketRobbery #TeamLoot #NoRetailPanic
BONK | Waiting for DemandNo position yet—alerts are set for the FVG and HTF demand zone below. DOGE/BONK still showing relative strength, so patience here is warranted.
Plan:
Wait for price to tag HTF area of interest (FVG/demand).
Look for LTF trigger for a long entry.
Prefer clean sweep/reclaim for confirmation.
Reasoning:
BONK has strong momentum, but entry here is late after an extended run.
Letting the setup come to me reduces risk of getting caught in a local top.
DOGE/BONK relative strength signals not to rush.

HYPE | Sweep & Reclaim SetupPlan:
Watching for a sweep into the blue H4 Untapped Demand zone, then a reclaim of 41.237 (green line) to add longs.
Ideal target: new ATH and 55 extension.
If the blue zone fails or we can't reclaim 41.237, risk-off mode: equal lows at 30.6 could be the draw.
Reasoning:
A sweep into demand would reset local liquidity and trap late shorts.
Reclaiming 41.237 confirms a shift in momentum and invalidates the breakdown.
Structure is bullish above 41.237; below, risk increases for deeper downside.

SEI | Setup: Sweep & Reclaim Scenario:Wait for a sweep of the range low (RL) into the Daily FVG (gray box).
Look for a reclaim of RL as the trigger for a long.
Reasoning:
Sweep into FVG traps late sellers and sets up liquidity for a reversal.
Reclaiming RL after the sweep signals strength and confirms a local bottom.
No need to chase entries—best R:R is after liquidity is cleared and level is retaken.

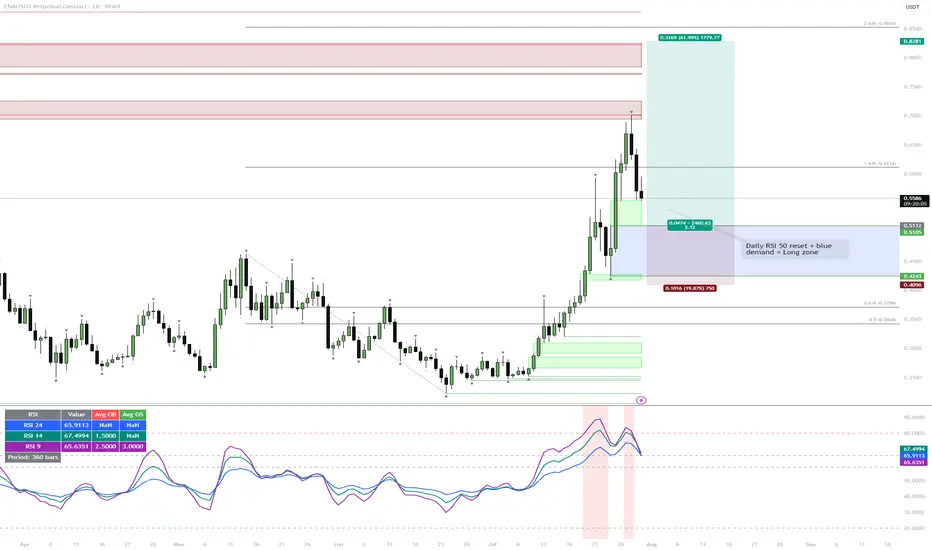
ENA | Waiting for the Daily RSI 50 ResetWatching for price to drop into the blue demand zone while the daily RSI resets to the 50 level. If both conditions align, that's the next high-probability long setup.
Reasoning:
Strong rally has left RSI elevated, so a cool-down is likely.
The blue zone lines up with the prior breakout and consolidation, so it's a logical area for buyers to step in.
A confluence of demand and neutral RSI usually provides the best R:R for trend continuation.
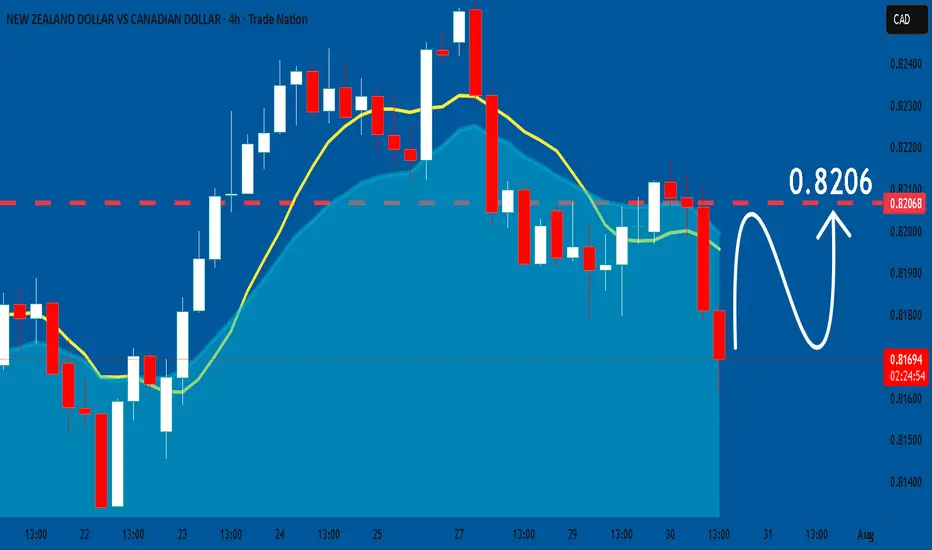
NZDCAD: Bullish Continuation is Expected! Here is Why:
The analysis of the NZDCAD chart clearly shows us that the pair is finally about to go up due to the rising pressure from the buyers.
Disclosure: I am part of Trade Nation's Influencer program and receive a monthly fee for using their TradingView charts in my analysis.
❤️ Please, support our work with like & comment! ❤️
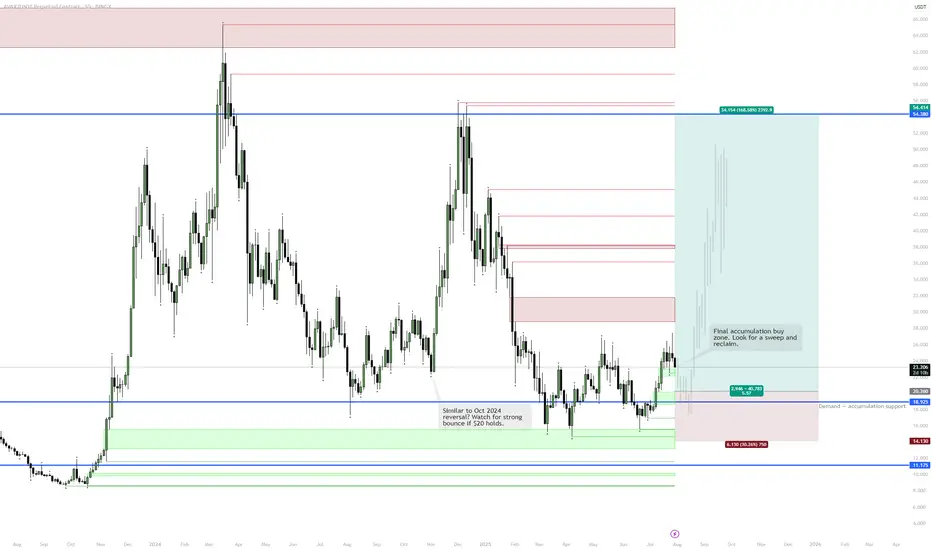
AVAX | Final Accumulation & Potential ReversalContext:
Price is in a major accumulation range, showing similarities to the October 2024 setup.
Green zones indicate strong demand/support; blue is key structural support.
Step-by-Step Scenario:
Accumulation Phase:
Price is consolidating above the $20 level, with repeated defenses of the support zone.
Spot Buys:
Orders set in the $19–$20 area to capture a potential “final shakeout.”
Spring/Reversal:
If price sweeps below $20 and quickly reclaims the level, this signals the final flush before reversal — mirroring the October 2024 bottom structure.
Upside Target:
First major resistance at $38, but the big objective is the $54–55 range, marking previous macro highs and supply.
Invalidation:
A sustained close below $14.1 would break the accumulation structure and invalidate the bullish scenario.
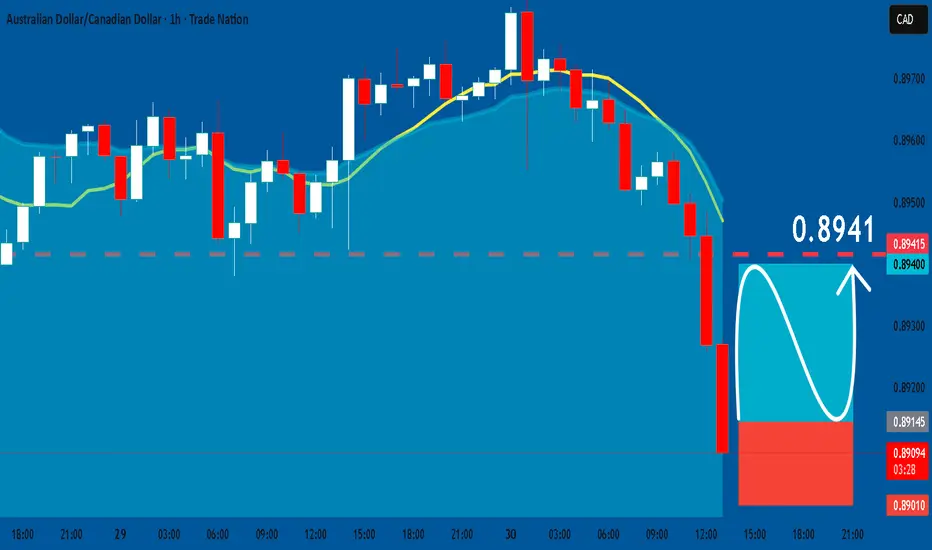
AUDCAD: Long Trade Explained
AUDCAD
- Classic bullish formation
- Our team expects pullback
SUGGESTED TRADE:
Swing Trade
Long AUDCAD
Entry - 0.8914
Sl - 0.8901
Tp - 0.8941
Our Risk - 1%
Start protection of your profits from lower levels
Disclosure: I am part of Trade Nation's Influencer program and receive a monthly fee for using their TradingView charts in my analysis.
❤️ Please, support our work with like & comment! ❤️
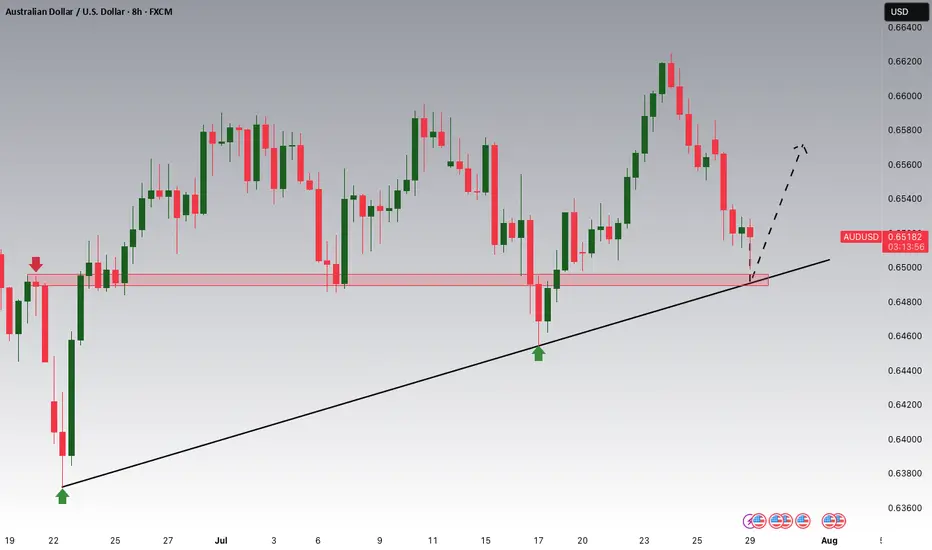
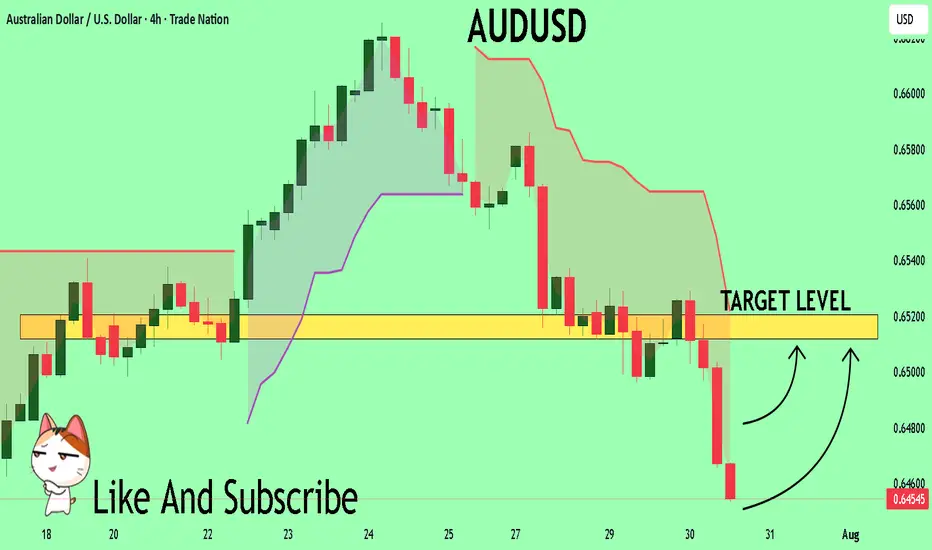
AUDUSD My Opinion! BUY!
My dear subscribers,
AUDUSD looks like it will make a good move, and here are the details:
The market is trading on 0.6455 pivot level.
Bias - Bullish
Technical Indicators: Both Super Trend & Pivot HL indicate a highly probable Bullish continuation.
Target - 0.6512
About Used Indicators:
The average true range (ATR) plays an important role in 'Supertrend' as the indicator uses ATR to calculate its value. The ATR indicator signals the degree of price volatility.
Disclosure: I am part of Trade Nation's Influencer program and receive a monthly fee for using their TradingView charts in my analysis.
———————————
WISH YOU ALL LUCK
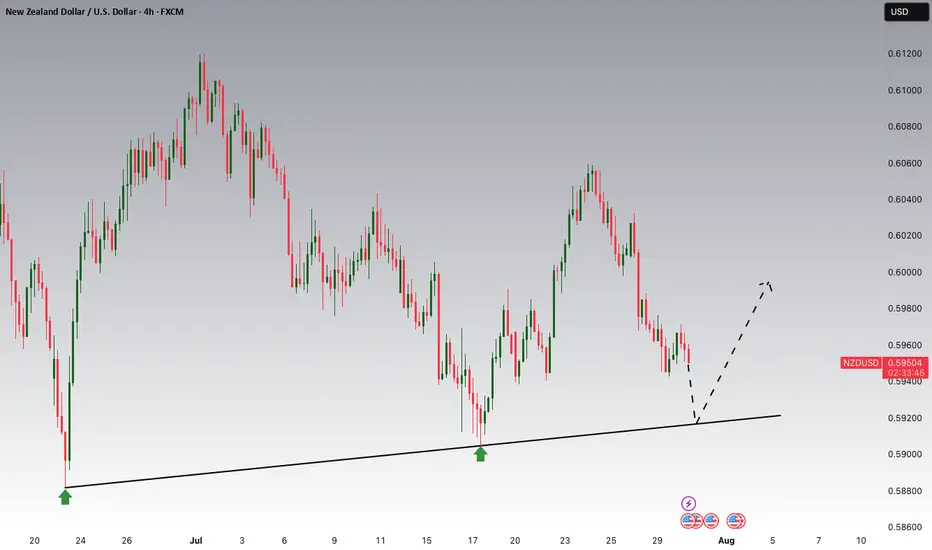
NZDUSD Potential UpsidesHey Traders, in today's trading session we are monitoring NZDUSD for a buying opportunity around 0.59200 zone, NZDUSD is trading in an uptrend and currently is in a correction phase in which it is approaching the trend at 0.59200 support and resistance area.
Trade safe, Joe.
AUDUSD Potential UpsidesHey Traders, in today's trading session we are monitoring AUDUSD for a buying opportunity around 0.64900 zone, AUDUSD is trading in an uptrend and currently is in a correction phase in which it is approaching the trend at 0.64900 support and resistance area.
Trade safe, Joe.