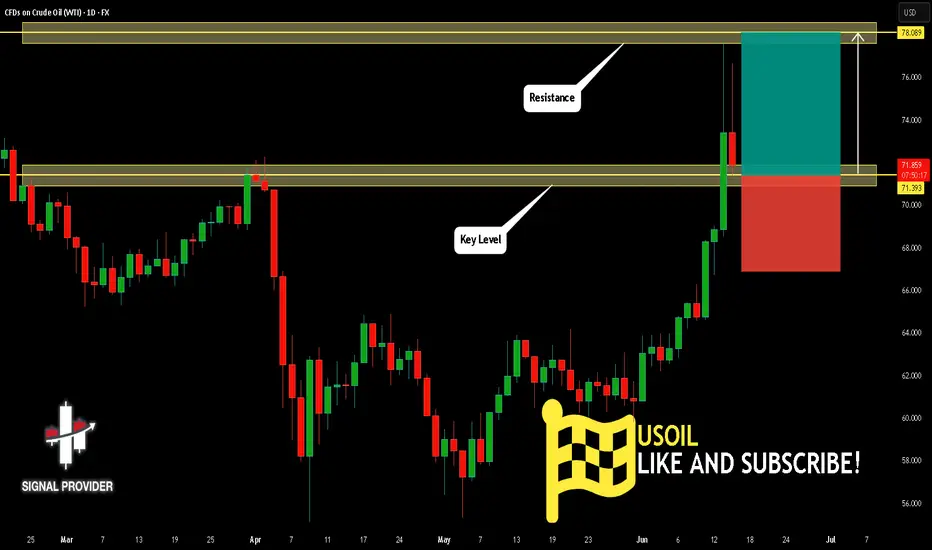
USOIL Will Move Higher! Buy!
Please, check our technical outlook for USOIL.
Time Frame: 1D
Current Trend: Bullish
Sentiment: Oversold (based on 7-period RSI)
Forecast: Bullish
The price is testing a key support 71.393.
Current market trend & oversold RSI makes me think that buyers will push the price. I will anticipate a bullish movement at least to 78.089 level.
P.S
Overbought describes a period of time where there has been a significant and consistent upward move in price over a period of time without much pullback.
Disclosure: I am part of Trade Nation's Influencer program and receive a monthly fee for using their TradingView charts in my analysis.
Like and subscribe and comment my ideas if you enjoy them!
LONG
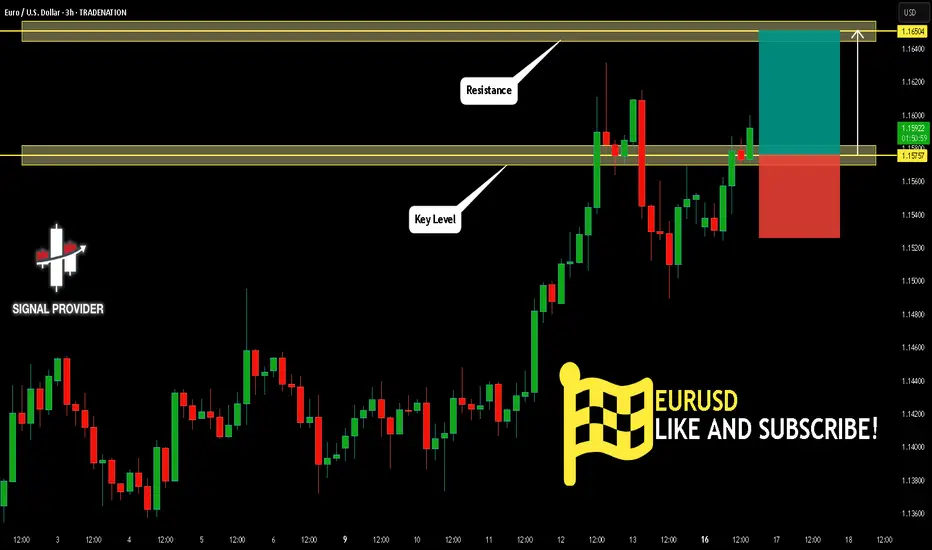
EURUSD Is Bullish! Long!
Here is our detailed technical review for EURUSD.
Time Frame: 3h
Current Trend: Bullish
Sentiment: Oversold (based on 7-period RSI)
Forecast: Bullish
The market is trading around a solid horizontal structure 1.157.
The above observations make me that the market will inevitably achieve 1.165 level.
P.S
Please, note that an oversold/overbought condition can last for a long time, and therefore being oversold/overbought doesn't mean a price rally will come soon, or at all.
Disclosure: I am part of Trade Nation's Influencer program and receive a monthly fee for using their TradingView charts in my analysis.
Like and subscribe and comment my ideas if you enjoy them!
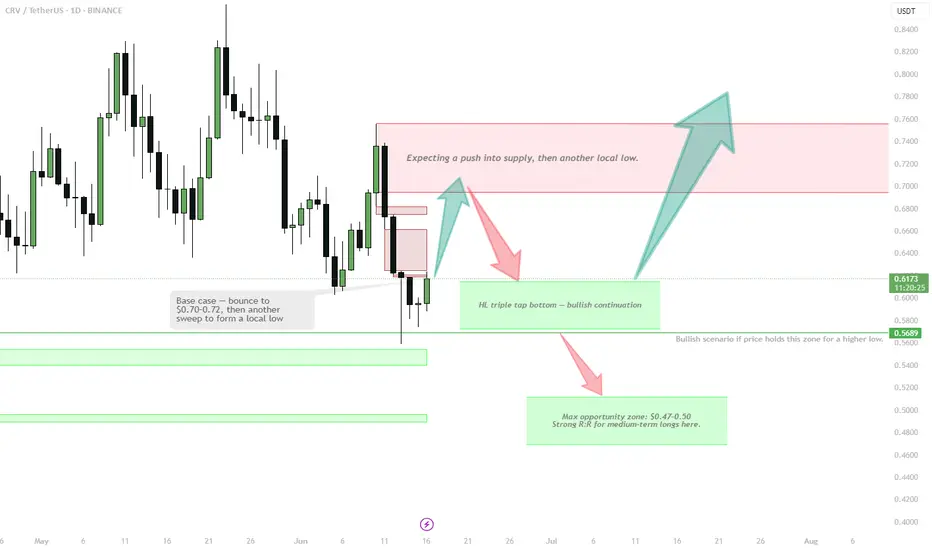
CRV | bounce then another sweep to form a local lowLiquidity taken, now eyeing push to $0.70–0.72 local supply.
Watching for another low after that move:
• HL triple tap = bullish base
• Or final drive into $0.47–0.50 = max opportunity for R:R swing longs
Breakout only confirmed above $0.75.
Patience — best setups come after the next local low.
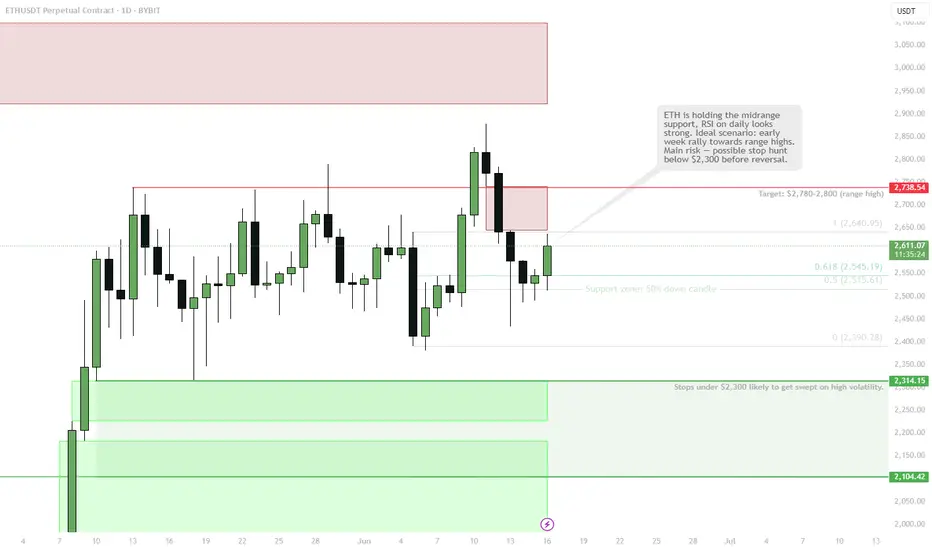
ETH is holding the midrange supportETH tagged 50% of the down candle that took out local lows — textbook support zone for new longs.
Main risk: stops under $2,300 probably get swept before real reversal — watch for fakeout.
Holding above $2,400 keeps the bullish thesis alive, next target $2,780–2,800.
As always — manage risk, don’t get caught on the wrong side of a sweep.
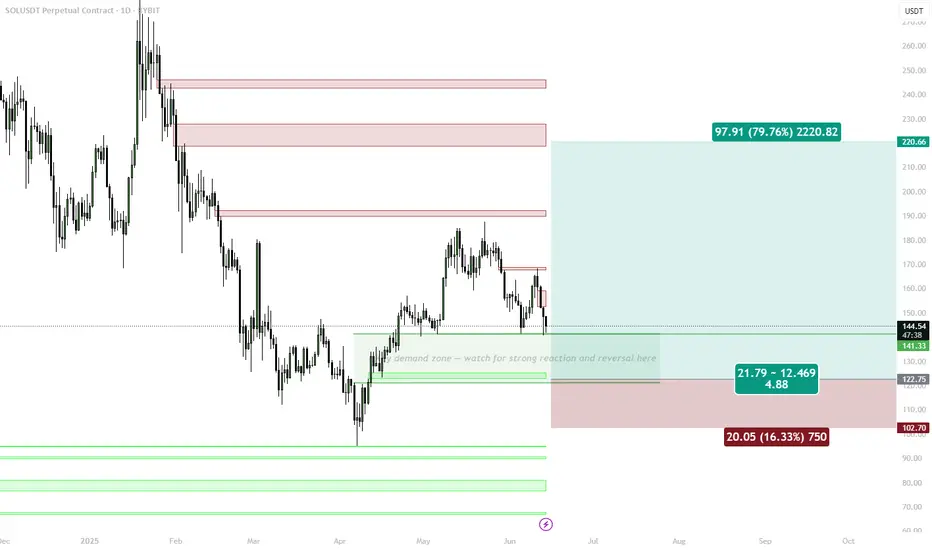
SOL | Key Demand Zone Retest in PlayBINANCE:SOLUSDT has pulled back into a major demand zone, following rejection from a local supply block. This zone previously acted as the base of the last impulsive move and now presents a critical level for a bullish reversal.
🟩 Key Demand Zone: $135–$125
• Valid demand cluster from April expansion
• Looking for bullish reversal signs or SFP before confirming entry
• Invalidates below $122.75
📌 Trade Setup (if confirmed):
• Entry near $125–130
• Target: $220 (79% upside)
• SL: Below $122.75
• R:R ≈ 4.88
🟥 Invalidation:
• Clean break below $122.75 = structure break
• Bearish continuation toward $102–105 zone
📌 This is the zone to look for strength — weak bounce = stand aside. Strong reaction = high R:R opportunity.
GOLD Is Very Bullish! Buy!
Please, check our technical outlook for GOLD.
Time Frame: 9h
Current Trend: Bullish
Sentiment: Oversold (based on 7-period RSI)
Forecast: Bullish
The market is approaching a key horizontal level 3,327.72.
Considering the today's price action, probabilities will be high to see a movement to 3,385.41.
P.S
Please, note that an oversold/overbought condition can last for a long time, and therefore being oversold/overbought doesn't mean a price rally will come soon, or at all.
Disclosure: I am part of Trade Nation's Influencer program and receive a monthly fee for using their TradingView charts in my analysis.
Like and subscribe and comment my ideas if you enjoy them!

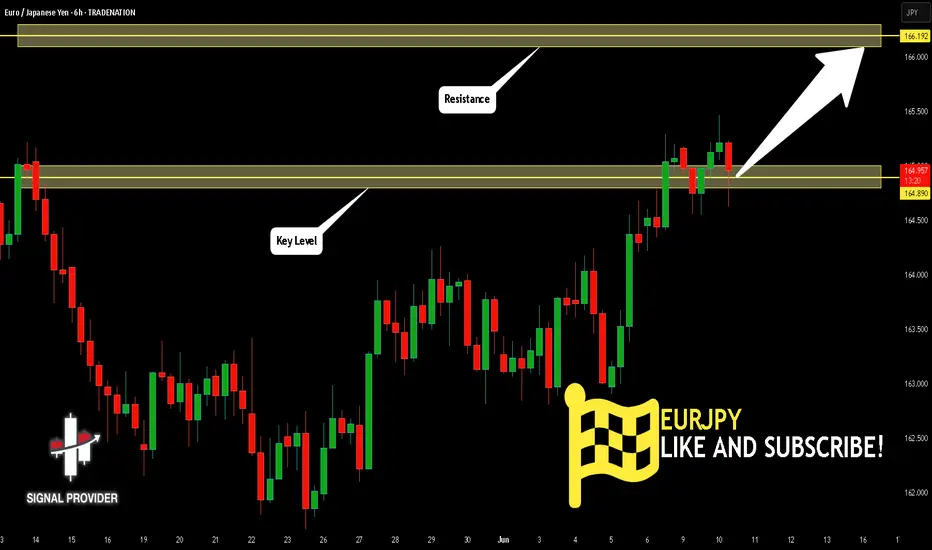
EURJPY Will Go Higher From Support! Buy!
Please, check our technical outlook for EURJPY.
Time Frame: 6h
Current Trend: Bullish
Sentiment: Oversold (based on 7-period RSI)
Forecast: Bullish
The price is testing a key support 164.890.
Current market trend & oversold RSI makes me think that buyers will push the price. I will anticipate a bullish movement at least to 166.192 level.
P.S
Overbought describes a period of time where there has been a significant and consistent upward move in price over a period of time without much pullback.
Disclosure: I am part of Trade Nation's Influencer program and receive a monthly fee for using their TradingView charts in my analysis.
Like and subscribe and comment my ideas if you enjoy them!
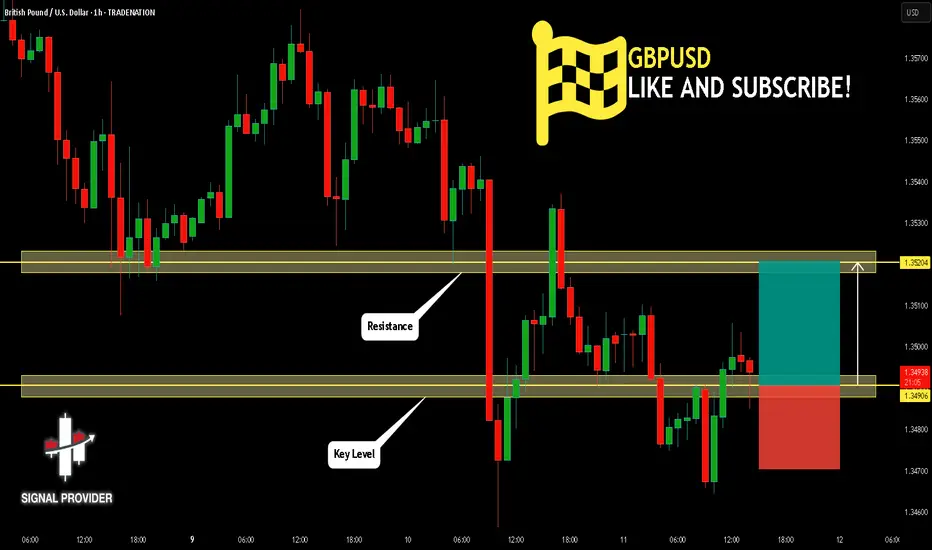
GBPUSD Will Move Higher! Buy!
Take a look at our analysis for GBPUSD.
Time Frame: 1h
Current Trend: Bullish
Sentiment: Oversold (based on 7-period RSI)
Forecast: Bullish
The price is testing a key support 1.349.
Current market trend & oversold RSI makes me think that buyers will push the price. I will anticipate a bullish movement at least to 1.352 level.
P.S
The term oversold refers to a condition where an asset has traded lower in price and has the potential for a price bounce.
Overbought refers to market scenarios where the instrument is traded considerably higher than its fair value. Overvaluation is caused by market sentiments when there is positive news.
Disclosure: I am part of Trade Nation's Influencer program and receive a monthly fee for using their TradingView charts in my analysis.
Like and subscribe and comment my ideas if you enjoy them!
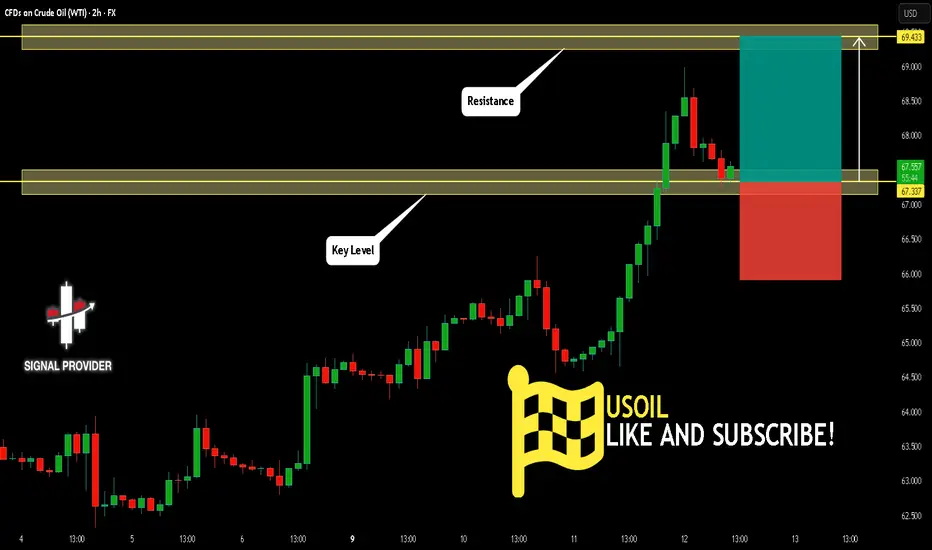
USOIL Will Go Higher From Support! Buy!
Take a look at our analysis for USOIL.
Time Frame: 2h
Current Trend: Bullish
Sentiment: Oversold (based on 7-period RSI)
Forecast: Bullish
The market is testing a major horizontal structure 67.337.
Taking into consideration the structure & trend analysis, I believe that the market will reach 69.433 level soon.
P.S
The term oversold refers to a condition where an asset has traded lower in price and has the potential for a price bounce.
Overbought refers to market scenarios where the instrument is traded considerably higher than its fair value. Overvaluation is caused by market sentiments when there is positive news.
Disclosure: I am part of Trade Nation's Influencer program and receive a monthly fee for using their TradingView charts in my analysis.
Like and subscribe and comment my ideas if you enjoy them!
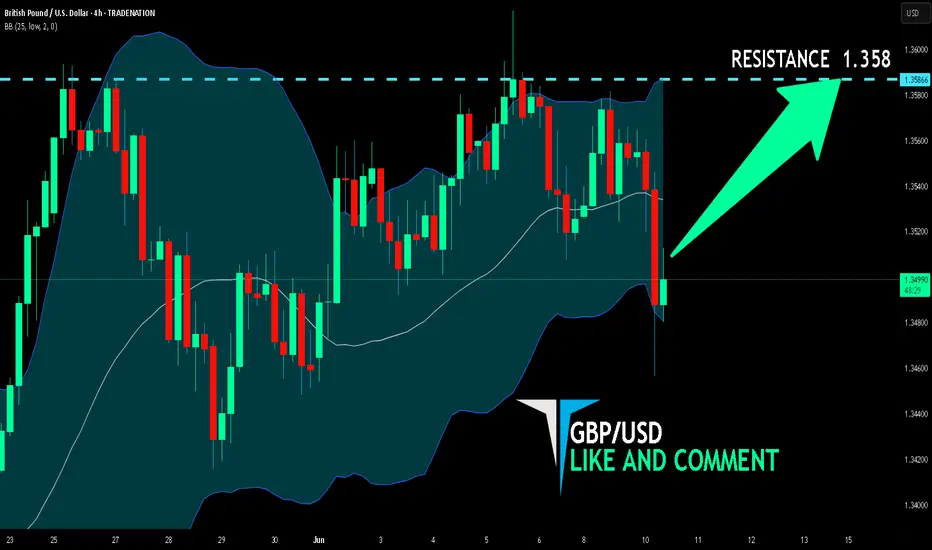
GBP/USD LONG FROM SUPPORT
Hello, Friends!
GBP/USD pair is trading in a local uptrend which know by looking at the previous 1W candle which is green. On the 4H timeframe the pair is going down. The pair is oversold because the price is close to the lower band of the BB indicator. So we are looking to buy the pair with the lower BB line acting as support. The next target is 1.358 area.
Disclosure: I am part of Trade Nation's Influencer program and receive a monthly fee for using their TradingView charts in my analysis.
✅LIKE AND COMMENT MY IDEAS✅
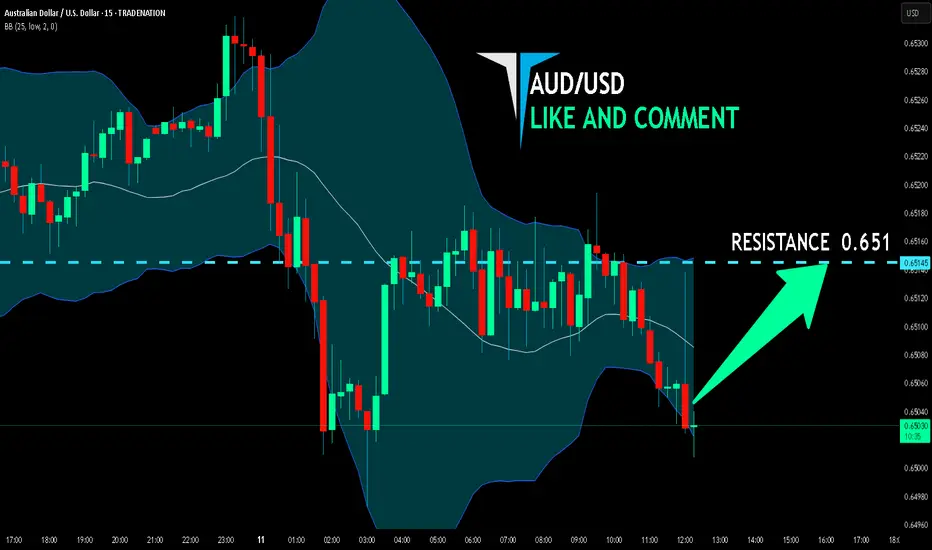
AUD/USD BULLISH BIAS RIGHT NOW| LONG
Hello, Friends!
AUD/USD pair is in the downtrend because previous week’s candle is red, while the price is clearly falling on the 15m timeframe. And after the retest of the support line below I believe we will see a move up towards the target above at 0.651 because the pair oversold due to its proximity to the lower BB band and a bullish correction is likely.
Disclosure: I am part of Trade Nation's Influencer program and receive a monthly fee for using their TradingView charts in my analysis.
✅LIKE AND COMMENT MY IDEAS✅
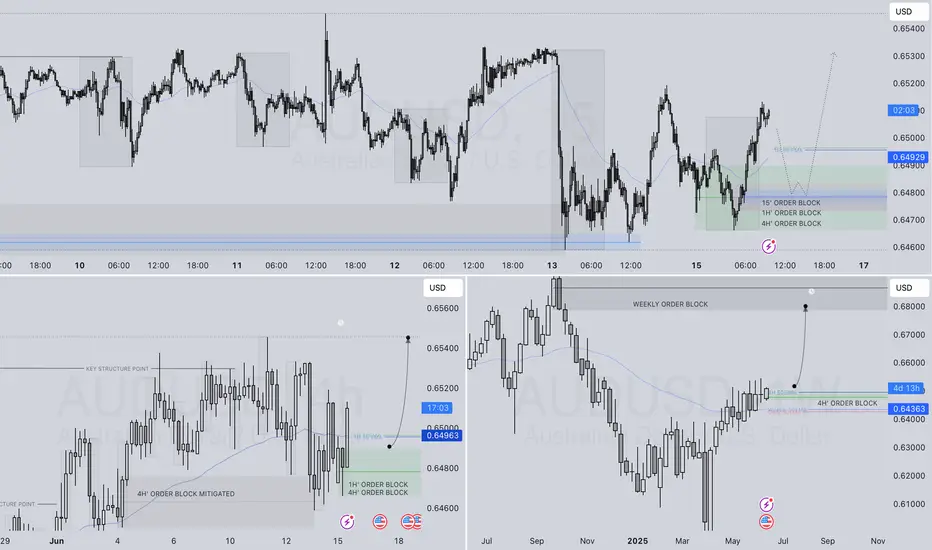
AUDUSD LONG FORECAST Q2 W25 D16 Y25AUDUSD LONG FORECAST Q2 W25 D16 Y25
Professional Risk Managers👋
Welcome back to another FRGNT chart update📈
Diving into some Forex setups using predominantly higher time frame order blocks alongside intraday confirmation & breaks of structure.
Let’s see what price action is telling us today! 🔥
💡Here are some trade confluences📝
✅4H Order block identified
✅1H Order block identified
✅15’ order block
✅Intraday bullish breaks of structure
🔑 Remember, to participate in trading comes always with a degree of risk, therefore as professional risk managers it remains vital that we stick to our risk management plan as well as our trading strategies.
📈The rest, we leave to the balance of probabilities.
💡Fail to plan. Plan to fail.
🏆It has always been that simple.
❤️Good luck with your trading journey, I shall see you at the very top.
🎯Trade consistent, FRGNT X
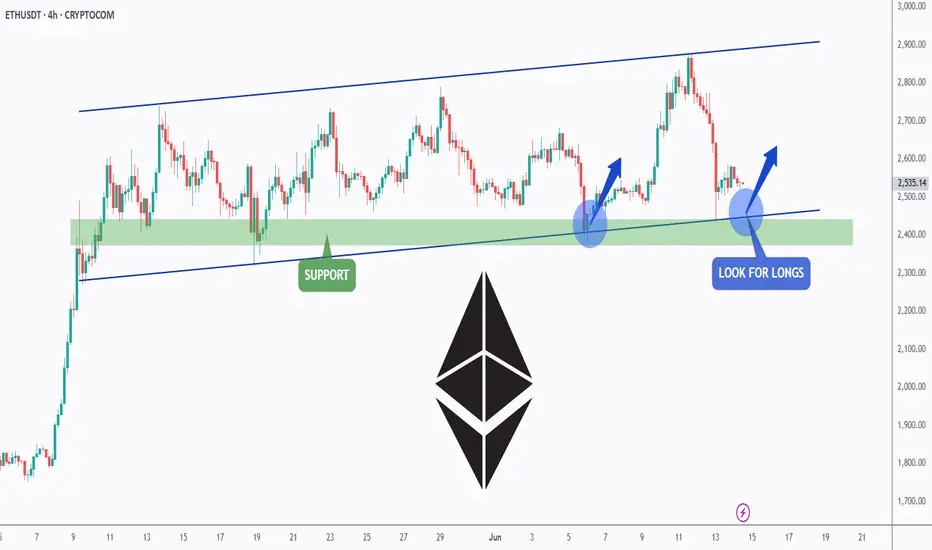
ETH is doing it AGAIN!Hello TradingView Family / Fellow Traders. This is Richard, also known as theSignalyst.
📈ETH has been overall bullish trading within the flat rising channels marked in blue.
Moreover, the green zone is a strong support zone!
🏹 Thus, the highlighted blue circle is a strong area to look for buy setups as it is the intersection of support and lower blue trendlines acting as non-horizontal support.
📚 As per my trading style:
As #ETH approaches the blue circle zone, I will be looking for bullish reversal setups (like a double bottom pattern, trendline break , and so on...)
📚 Always follow your trading plan regarding entry, risk management, and trade management.
Good luck!
All Strategies Are Good; If Managed Properly!
~Rich
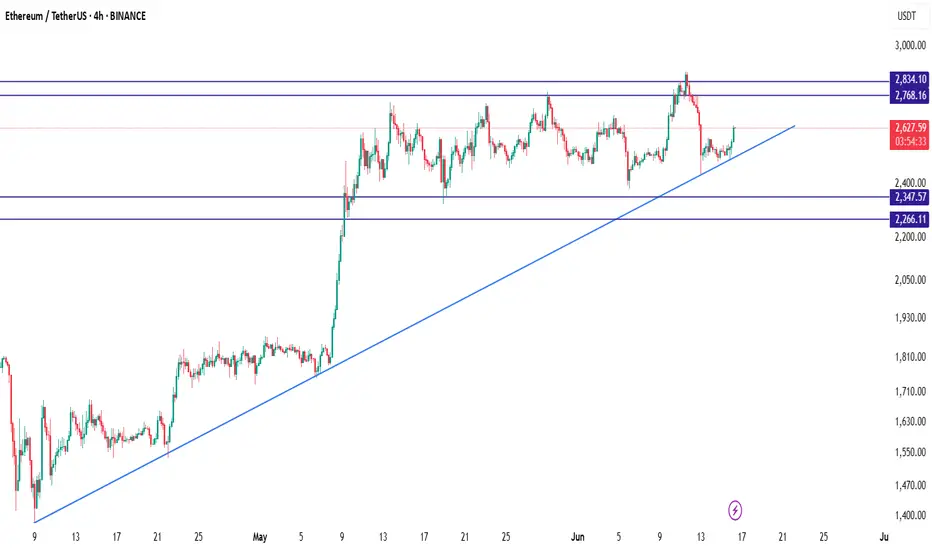
ETH/USDTEthereum (ETH/USDT) is currently maintaining its bullish momentum above a well-respected ascending trendline that has been active since early April. After a strong breakout above the 2347 level, the price entered a consolidation phase between 2600 and 2800, suggesting that the market is preparing for its next significant move. As of now, ETH is trading near 2627 and forming higher lows, which is a positive sign of buyer strength.
The key support zones are located at 2347 and 2266, while resistance levels to watch are 2768 and 2834. As long as the price holds above the ascending trendline, the bullish structure remains intact. A bounce from the current region, especially near the trendline, may present a favorable long opportunity. In such a scenario, a breakout above 2768 could open the path toward 2834 and potentially higher levels in the medium term.
A suitable long setup would involve entering around the 2620–2640 zone with a stop loss below 2347 to protect against trend invalidation. The first profit target can be set at 2768, and the second at 2834. However, traders should remain cautious: if ETH breaks below the trendline with strong bearish volume, the bullish outlook would weaken, and the price may revisit lower supports. Until then, the market structure favors buying the dips in alignment with the prevailing uptrend.
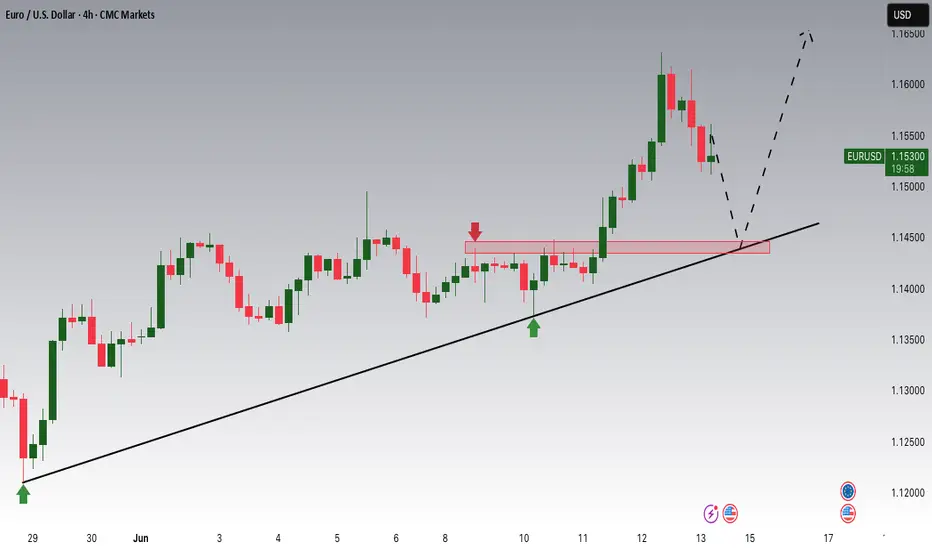
EURUSD Potential UpsidesHey Traders, in today's trading session we are monitoring EURUSD for a buying opportunity around 1.14500 zone, EURUSD is trading in an uptrend and currently is in a correction phase in which it is approaching the trend at 1.14500 support and resistance area.
Trade safe, Joe.
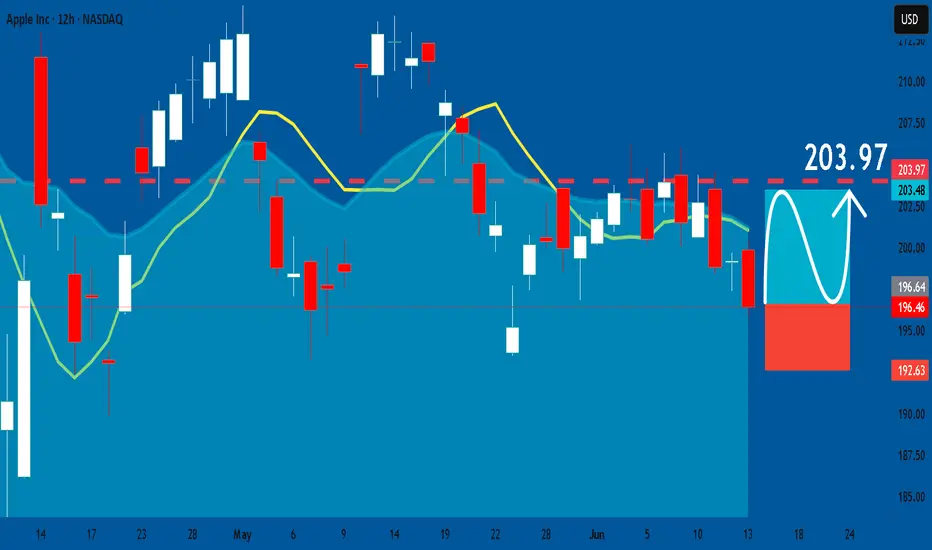
APPLE: Long Signal with Entry/SL/TP
APPLE
- Classic bullish pattern
- Our team expects retracement
SUGGESTED TRADE:
Swing Trade
Buy APPLE
Entry - 196.46
Stop - 192.63
Take - 203.97
Our Risk - 1%
Start protection of your profits from lower levels
Disclosure: I am part of Trade Nation's Influencer program and receive a monthly fee for using their TradingView charts in my analysis.
❤️ Please, support our work with like & comment! ❤️
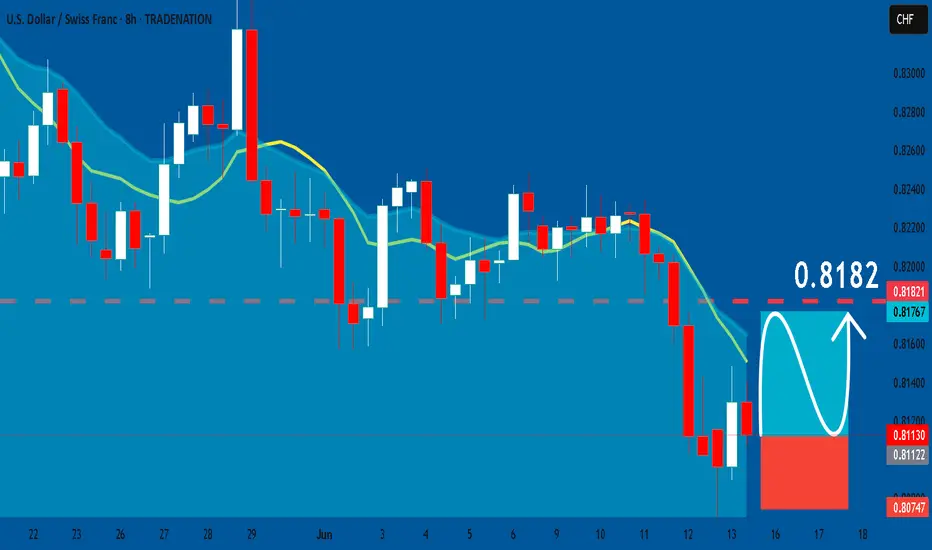
USDCHF: Bullish Continuation & Long Signal
USDCHF
- Classic bullish setup
- Our team expects bullish continuation
SUGGESTED TRADE:
Swing Trade
Long USDCHF
Entry Point - 0.8113
Stop Loss - 0.8074
Take Profit - 0.8182
Our Risk - 1%
Start protection of your profits from lower levels
Disclosure: I am part of Trade Nation's Influencer program and receive a monthly fee for using their TradingView charts in my analysis.
❤️ Please, support our work with like & comment! ❤️
SPX | HTF Breakout Confirmed, Watching for Pullback EntryHTF still bullish — watching W iFVG & weekly OB below as major bid zone.
Breakout to 2.13 next if structure holds.
Lose W OB? Full reset.
Best R:R for swings if we get a flush into 0.75–0.95.

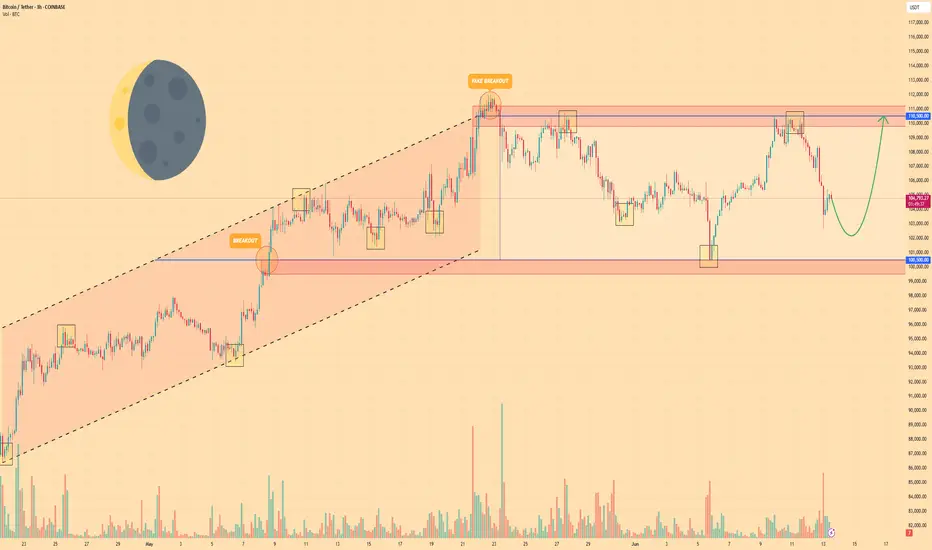
BITCOIN - Price can fall a little and start to move upHi guys, this is my overview for BTCUSDT, feel free to check it and write your feedback in comments👊
Price entered to rising channel, where at once bounced from support line and rose a little, and then corrected.
Next, price continued to move up and soon reached $100500 level, after which broke it and rose to resistance line.
After this movement, BTC corrected and continued to grow in rising channel and later reached $110500 level.
Bitcoin exited from rising channel, made a fake breakout of resistance level, and started to trades inside flat.
In flat, price tried to grow but failed and fell to support level and then grew back again, after which started to decline.
Now, I expect that BTC can repeat as move before, it falls a little and then grows to $110500 resistance level.
If this post is useful to you, you can support me with like/boost and advice in comments❤️
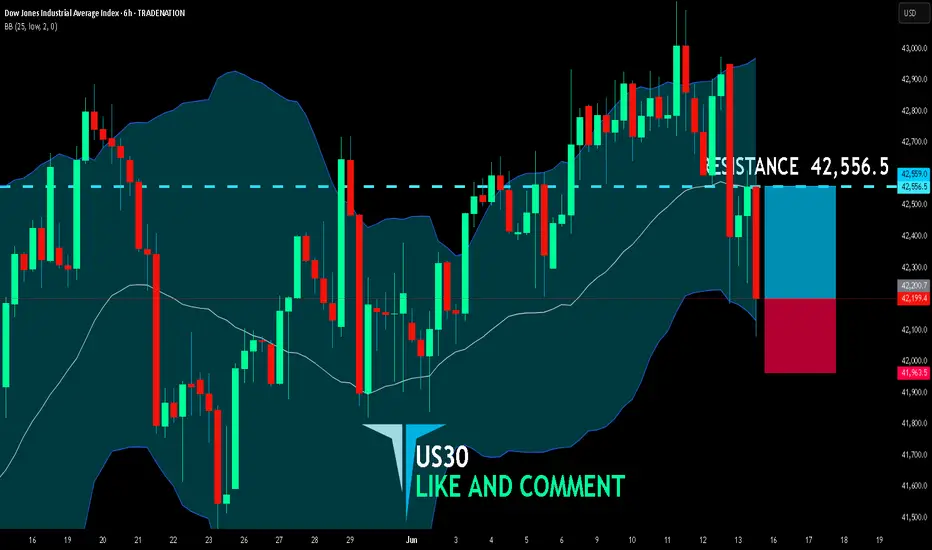
US30 BULLISH BIAS RIGHT NOW| LONG
US30 SIGNAL
Trade Direction: short
Entry Level: 42,200.7
Target Level: 42,556.5
Stop Loss: 41,963.5
RISK PROFILE
Risk level: medium
Suggested risk: 1%
Timeframe: 6h
Disclosure: I am part of Trade Nation's Influencer program and receive a monthly fee for using their TradingView charts in my analysis.
✅LIKE AND COMMENT MY IDEAS✅
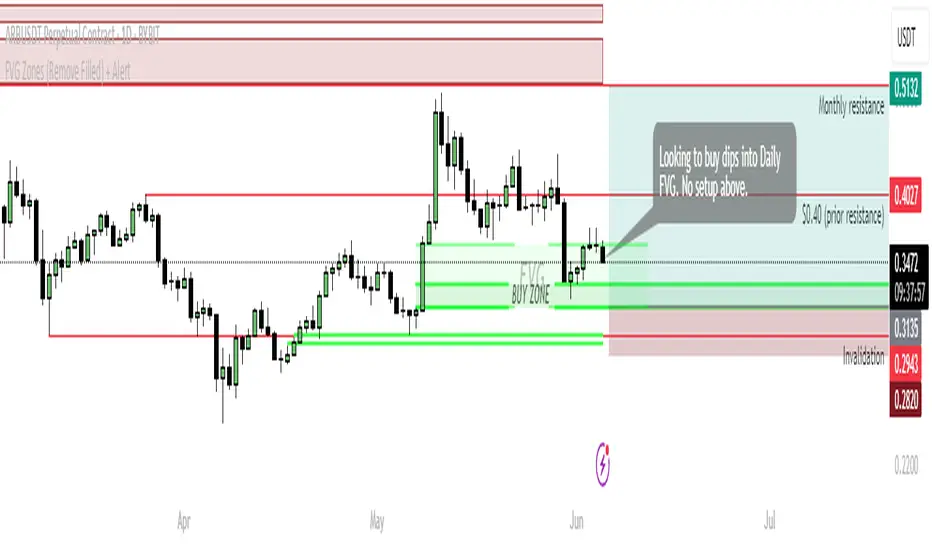
ARB — Waiting for Dip into FVG Buy ZonePrice is hovering just above a key Daily FVG zone, following a rejection from the $0.40 prior resistance. Current structure does not justify longs unless a dip into the FVG zone occurs.
🟩 Buy Zone: $0.3135–$0.33 (FVG)
• Confluence of demand and fair value gap
• High-probability entry if price dips into this area
• No setup above current price — wait for confirmation
🔴 Invalidation:
• Breakdown below $0.294 = structural failure
🎯 Targets:
• First: $0.40 (prior resistance)
• Then: $0.513–$0.514 (monthly resistance zone)
📌 Clear plan: no FOMO. Only act on dip into value zone, not from mid-range.
XAUUSD FULL DAILY OUTLOOK — 16 JUNE 2025👋 Hello traders, welcome to a key week for gold.
The bullish expansion continues to unfold cleanly, following weeks of calculated breakout sequences.
After liquidating major liquidity pockets below 3120 earlier this year, gold shifted into controlled higher timeframe expansion.
The breakout above May’s consolidation confirms full bullish structure control. However, we are now entering premium exhaustion territory, where liquidity traps become increasingly dangerous for emotional traders.
This is where most fail — chasing late breakouts — but we stay patient and execute only inside clean zones.
🔎 STRUCTURE PROGRESSION
✅ Weekly BOS fully confirmed → higher timeframe bullish structure intact.
✅ Daily has printed higher lows at 3120 → 3246, leading to the recent higher high at 3448.
✅ Price is now extended into premium expansion.
✅ EMA 5/21/50 fully locked bullish — trend continuation bias.
✅ RSI remains firm but near extended levels.
✅ Fibonacci extensions above are now fully in play.
🎯 DAILY BIAS — 16 JUNE 2025
Primary bias remains bullish as long as price holds above 3355 structure.
Price sits inside premium expansion, where liquidity traps may unfold near 3448–3505.
Controlled pullbacks into 3405–3385 remain healthy for continuation, while deeper dips into 3325 open better risk-reward positioning.
Bullish continuation remains the base case, but aggressive premium sweeps before FOMC remain highly probable.
🔼 DAILY SUPPLY ZONES
Price Zone Context
3448 – 3460 Breakout premium supply (first liquidity trap zone)
3500 – 3505 1.272 Fibonacci extension — major liquidity pocket
3570 – 3575 1.618 Fibonacci extension — exhaustion premium trap
🔽 DAILY DEMAND ZONES
Price Zone Context
3405 – 3385 Shallow pullback liquidity zone
3355 – 3325 Main Daily OB demand — structure protection
3290 – 3255 Deep flush zone — extreme HL recalibration zone
⚠ THE BATTLE THIS WEEK
✅ Price may attempt premium sweeps above 3448 → 3505 before any deeper correction.
✅ Below 3385 lies the first reactive zone for controlled pullbacks.
✅ FOMC remains the dominant macro driver — liquidity will likely front-run into Wednesday.
✅ Patience is key — the market may trigger both traps before any clear directional expansion unfolds.
🔐 Mindset Reminder:
In premium we don't chase — we wait for the market to exhaust liquidity and show real intent.
Our job is not to predict reversals, but to execute once liquidity confirms displacement.
🚀 If this helped you build your map for the week, hit that 🚀, drop your thoughts below, follow for full sniper insights.
We trade clean. We execute precise.
— GoldFxMinds
